Article Text

Abstract
Introduction Understanding how to deliver interventions more effectively is a growing emphasis in Global Health. Simultaneously, health system strengthening is a key component to improving delivery. As a result, it is challenging to evaluate programme implementation while reflecting real-world complexity. We present our experience in using a health systems modelling approach as part of a mixed-methods evaluation and describe applications of these models.
Methods We developed a framework for how health systems translate financial inputs into health outcomes, with in-country and international experts. We collated available data to measure framework indicators and developed models for malaria in Democratic Republic of the Congo (DRC), and tuberculosis in Guatemala and Senegal using Bayesian structural equation modelling. We conducted several postmodelling analyses: measuring efficiency, assessing bottlenecks, understanding mediation, analysing the cascade of care and measuring subnational effectiveness.
Results The DRC model indicated a strong relationship between shipment of commodities and utilisation thereof. In Guatemala, the strongest model coefficients were more evenly distributed. Results in Senegal varied most, but pathways related to community care had the strongest relationships. In DRC, we used model results to estimate the end-to-end cost of delivering commodities. In Guatemala, we used model results to identify potential bottlenecks and understand mediation. In Senegal, we used model results to identify potential weak links in the cascade of care, and explore subnationally.
Conclusion This study demonstrates a complementary modelling approach to traditional evaluation methods. Although these models have limitations, they can be applied in a variety of ways to gain greater insight into implementation and functioning of health service delivery.
- health systems evaluation
- HIV
- tuberculosis
- malaria
- mathematical modelling
This is an open access article distributed in accordance with the Creative Commons Attribution Non Commercial (CC BY-NC 4.0) license, which permits others to distribute, remix, adapt, build upon this work non-commercially, and license their derivative works on different terms, provided the original work is properly cited, appropriate credit is given, any changes made indicated, and the use is non-commercial. See: http://creativecommons.org/licenses/by-nc/4.0/.
Statistics from Altmetric.com
Key questions
What is already known?
Global health implementers and policy-makers recognise the importance of better information to deliver interventions more effectively.
Health systems strengthening is also seen as a key component of delivering health programmes.
Evaluation of interventions and programmes—in light of the increased emphasis on implementation science and health systems strengthening—is challenging to do in a way that reflects their real-world complexity.
What are the new findings?
Health systems modelling may be a useful approach for evaluating complex interventions.
This manuscript presents results, applications and lessons learnt from our experience using a health systems modelling approach in Democratic Republic of the Congo, Guatemala and Senegal, as part of the Prospective Country Evaluation of the Global Fund to Fight AIDS, tuberculosis and malaria.
We demonstrate several ways in which the results from these models can be applied for actionable and practical improvement of programme implementation.
What do the new findings imply?
A health systems modelling approach can offer new insights to improve programme implementation and intervention delivery, especially when combined with other implementation science approaches in a mixed-methods evaluation.
Challenges remain with developing health systems models for complex evaluation, and further methodological development is needed.
Introduction
The ‘science of delivery’ for global health interventions is a rapidly growing field aimed at taking interventions to scale.1 There is a growing acknowledgement in global health that while it is imperative to identify effective interventions, it is equally important that those interventions be implemented effectively and sustainably by local health systems.2 3
Simultaneously, the international donor community has emphasised health system strengthening as a key component to delivering health programmes.4 5 From 2010 to 2018, an estimated US$48.4 billion was donated worldwide for sector-wide approaches and health system strengthening.6 Among them, the Global Fund to Fight AIDS, tuberculosis (TB) and malaria (Global Fund) considers building resilient and sustainable systems for health (RSSH) one of their four strategic objectives,7 and a key means to implementing the programmes and interventions that they support.8
But with this emphasis on (1) understanding implementation and (2) strengthening health systems, interventions and programmes are difficult to evaluate in a way that reflects their real-world complexity.9 Discussion continues as to the best ways to assess the successes and challenges involved in implementation of interventions, often including a call for further advances in methods and approaches.10–12 Some conclude that evaluation of the effectiveness of complex interventions and programmes necessitates a more detailed analysis of indicators along the causal pathways that link interventions to their ultimate outcomes, rather than just analysis of the outcomes themselves.13 14 This may be especially valuable in the effort to understand implementation.
Health systems modelling (HSM) is a potential approach to filling this need within implementation science evaluations.15 16 An HSM reflects the dynamics of a system which delivers services and interventions, instead of focusing on the dynamics of disease transmission processes. Applications of HSM within global health include HIV and TB service delivery models,17 18 systems dynamics modelling of human resource for health,19 20 and simulation studies,21–23 but have had limited application to evaluating the implementation of HIV, TB, or malaria programmes.15 22 24 25
In this paper, we present methods, results and lessons learnt from our experience in using an HSM approach as part of the Prospective Country Evaluation of the Global Fund (PCE), a mixed-methods evaluation of how Global Fund investments are being operationalised in eight low-income and middle-income countries (LMICs). We further demonstrate many postmodelling applications that can be done after the model is fit. The emphasis of this work has been on utilisation-focused analysis,26 and as a result many of the methods employed come with important limitations. We conclude that HSM is a promising approach for evaluating complex interventions in such a way that focuses on learning about and enhancing future implementation.
Methods
Study setting
The PCE is a mixed-methods study of how Global Fund investments are being operationalised in eight LMICs (Cambodia, Democratic Republic of the Congo (DRC), Guatemala, Mozambique, Myanmar, Senegal, Sudan and Uganda).27 Initiated in 2017, the PCE is an ongoing evaluation platform conducted through collaboration between in-country and international partners to aid cross-country learning (online supplemental appendix 1). The goals of the PCE are to understand how and why Global Fund grants are achieving outcomes, and the ways in which they could be more efficient and effective. Among other implementation science methods, the PCE has applied modelling to understand these subjects. This manuscript details the work of one of two consortia involved in the PCE, which includes analysis from the DRC, Guatemala and Senegal.
Supplemental material
Conceptual framework
Before applying any statistical models, the PCE first developed a theoretical model of how health systems in each country translate financial and other inputs into health outcomes. Using an interactive online tool,28 the PCE drew from its diverse group of in-country and international experts to diagram the ‘results chain’, which is a sequence of related pathways by which financial inputs become disease control activities, activities become health system outputs, outputs become population outcomes and outcomes become health impact. This framework detailed both the theoretical constructs along each pathway as well as lists of measurable indicators within each construct. We developed one framework for each of the three diseases supported by the Global Fund (HIV, TB and malaria) which were reviewed and validated by experts in all eight PCE countries, by five global-level evaluation partners, and members of the Technical Evaluation Reference Group of the Global Fund. The PCE developed the results chains in a series of in-person workshops and subsequent online collaboration.
Data sources
Once the conceptual frameworks were developed, the PCE team collated data from all available sources in order to populate as many elements of the results chain with empirical indicators as possible. We carried out a separate exercise in each country to map data sources to indicators in the results chains.
Based on data access, availability, completeness, quality and feasibility, our consortium in the PCE selected three cases as pilot models: malaria in the DRC, TB in Guatemala, TB in Senegal.
In total, the three models included 10 distinct data sources, spanning financial data, country-specific administrative data, national programme data, surveys and survey-based model estimates. Table 1 details the data sources used in each country, summarising by groups of indicators (see online supplemental appendix 2 for a complete list of indicators used by each model).
Supplemental material
Summary of data sources and details by model
Data processing
PCE modelling teams conducted several data processing steps to standardise indicators and correct for known data quality limitations.
Indicators were extracted from their original data system (excel spreadsheets, online dashboards etc) using standardised scripts written in the R statistical programming language29 to ensure reproducibility. In some cases, indicators were available at different levels of geographic and temporal aggregation (eg, ‘Number of child contacts referred’ in Senegal was available by year and region, but ‘Total cases of tuberculosis identified and treated’ was available by quarter and district). After identifying all available indicators, modelling teams determined the most granular level of aggregation that was possible for a majority of indicators. Where necessary, indicators were then aggregated or disaggregated to that level. To disaggregate by geography, indicators were divided in proportion to the subsequent indicator in the results chain. To disaggregate temporally, we used log-linear interpolation, with the available data assigned to the midpoint of the corresponding time period.
PCE modelling teams then systematically corrected all data for missing values and outliers. We used a combination of visual examination of plots of data values over time and quantile regression to screen for extreme values, and either expectation-maximisation30 or generalised linear models to impute missing values (including those created by outlier screening).
Data transformations were applied prior to fitting each model. All rate variables were log-transformed and all proportion variables were logit-transformed to ensure univariate-normal distributions and count variables were cumulative summed over their available time series (starting from the first date in their time series, even if other indicators were only available for a shorter time frame). We applied 6-month time lags to the relationships between financial inputs and activities to reflect the time required to absorb and spend funds, based on estimates of programme lag times provided by in-country experts. Additionally, we applied 6 months leads to TB treatment success variables to incorporate the treatment duration into the modelled temporal relationship.
Additional country-specific corrections were applied depending on context. The DRC-malaria model statistically adjusted all estimates for population change and reporting completeness by including these as control variables in all model equations. The DRC modelling team also applied a ‘cross-walking’ procedure31 to add the short-term temporal variance of programme data to model estimates of population-level intervention coverage. In the Guatemala-TB and Senegal-TB model, investment in health system strengthening by the Global Fund was added to direct intervention investment to account for the sizeable contribution of the Global Fund to RSSH.
Statistical methods
Bayesian structural equation modelling was selected as the primary statistical method. This approach allows for the modelling of networks of relationships as in our results chain with prior distributions and complex error terms. We used weakly informative priors in all equations, including normally distributed priors or gamma-distributed priors, depending on the theoretical relationship between each explanatory variable and outcome variable. The prior distribution was gamma for all coefficents from inputs to outcomes, and was normal (with mean zero and precision of 0.01) for pathways directly leading to impact indicators, as well as for the control variables of date and completeness. Correlated error terms were used to represent non-directional theoretical relationships, for example, between different funding sources for the same intervention. Spatial ‘fixed effects’ were employed across the entire model (ie, model coefficients were estimated for every health zone, region or district; national graphs represent the average coefficient) to control for geographical confounding. Models were fit using R statistical software29 with the blavaan package32 to fit structural models and the glm function29 to fit linear models. The model code is available in a public repository (https://github.com/ihmeuw/gf/tree/develop/impact_evaluation). Online supplemental appendix 4 gives further details of the model code and an example regression equation. In all, the structural models amounted to a system of 15 regression equations in the DRC-malaria model, 19 equations in the Guatemala-TB model and 16 equations in the Senegal-TB model.
Supplemental material
Exceptions to this approach were taken in each country owing to data completeness, data availability and feasibility of model identification. The DRC-malaria model estimated the results chain as two separate models; one reflecting pathways from inputs to outputs, one reflecting pathways from outputs to outcomes. The Guatemala-TB and Senegal-TB models excluded correlated error terms and fit the models as a series of unrelated equations, rather than as a system of simultaneous equations.
Modelling teams conducted sensitivity analyses to explore the effect of using simultaneous versus unrelated equations, and the effect of including RSSH as an additive effect vs an interaction term.
Postmodelling analyses
The PCE conducted different post-modelling analyses in different country settings depending on the model findings and priorities of in-country and Global Fund stakeholders. In DRC, the model was used to measure efficiency and implementation effectiveness, that is, the rate by which outputs have translated into outcomes. We estimated these by calculating the reciprocal of corresponding regression coefficients. For example, we calculated the cost per unit delivered, as one divided by the regression coefficient relating inputs to activities (interpreted as the units per dollar). In Guatemala, the model was used to assess potential bottlenecks in service delivery and to understand mediation in the relationships between inputs and outputs. This was done by examination of the final model object and its coefficients. In Senegal, the model was used to identify potential weak links in the cascade of care, and to explore subnational patterns in implementation effectiveness.
Patient and public involvement
No patients were involved in this study. All data were accessed in aggregate form with no identifying information.
Results
Conceptual frameworks
The PCE defined one theoretical model per disease, as shown in figure 1 for malaria. Additional information for each framework is described in online supplemental appendix 2. Elements (boxes) in the framework represent distinct components of the health system or cascade of care that are the result of a preceding element or the driver of a subsequent element. Pathways (arrows) in the framework reflect direct causal effects of one element on another.

Conceptual framework for malaria.
For each element of each framework, an inclusive list of potentially measurable indicators was identified and listed as part of the theoretical model. 121 distinct indicators were listed for HIV, 99 for TB and 94 for malaria. See online supplemental appendix 3 for further details.
Supplemental material
The frameworks were adapted for each country-disease model and varied depending on the data available to populate the model and the intervention pathways prioritised for evaluation (online supplemental appendix 2). Among the potentially measurable indicators listed for each framework, only a subset were available in the data in each country. For the DRC-malaria model, data were available to populate 25 indicators in the framework. For the Guatemala-TB model, 24 indicators were identified. For the Senegal-TB model, 22 indicators were identified. Indicators that were unavailable for analysis were primarily clustered in the inputs and activities sections of the framework. Only financial resources and commodity-based activities were available in the data.
Model results
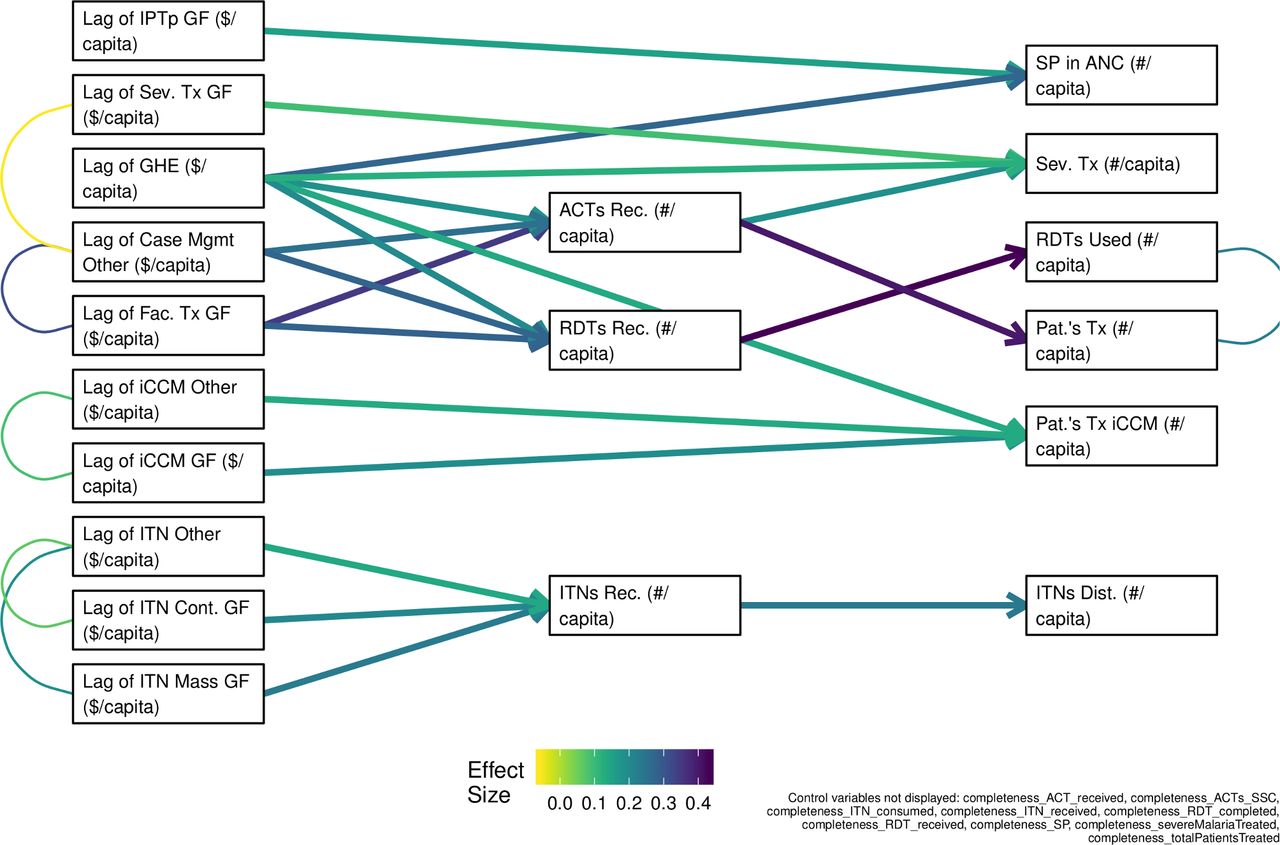
Figure 2 below displays the results from the DRC malaria model. In this figure, each box represents a separate variable in the system of equations. Columns ordered from left to right represent inputs, activities, outputs and outcomes. Arrows between boxes represent regression coefficients, starting from an independent variable (ie, explanatory variable) and ending at its corresponding dependent variable (ie, outcome variable). Curved, undirected lines represent correlated error terms. Coefficient values, labelled ‘effect sizes’, are displayed as standardised estimates, reflecting the SD change in an outcome variable associated with a 1 SD increase in the respective explanatory variable.

Model diagrams and effect sizes in structural equation models of malaria in DRC. Model A incorporates financial inputs, activities and outputs. Model B incorporates outputs and outcomes. Full definitions of each variable are listed in online supplemental appendix 2, table 1. The DRC model was fit in two sections for feasibility. A and B refer to the two models. ACT, artemisinin-based combination therapy; DRC, Democratic Republic of the Congo; GF, global fund; iCCM, integrated community case management; IPTp, intermittent preventive treatment during pregnancy; ITN, insecticide-treated nets; RDT, rapid diagnostic test; SP, sulfadoxine pyrimethamine; Tx, treatment.
In the DRC model, the strongest coefficient estimates were generally observed between activities and outputs, indicating a strong measurable relationship between the shipment of commodities and their corresponding utilisation in this model. For example, the strongest pathway in figure 2A connects RDTs received (activity) with RDTs used (output). This coefficient has a value of 0.43 (95% CI 0.21 to 0.65), meaning per single SD increase in RDT shipment, we observed a 0.43 SD increase in RDT output, controlling for other factors. Weaker coefficients were observed generally between inputs and activities; the weakest coefficient in the model was along the pathway connecting Global Fund expenditure to the number of patients with severe malaria treated (midpoint: 0.09, 95% CI −0.06 to 0.24). Uncertainty also varied; 12 of the 20 pathways displayed in figure 2 had 95% CIs that included both positive and negative values.
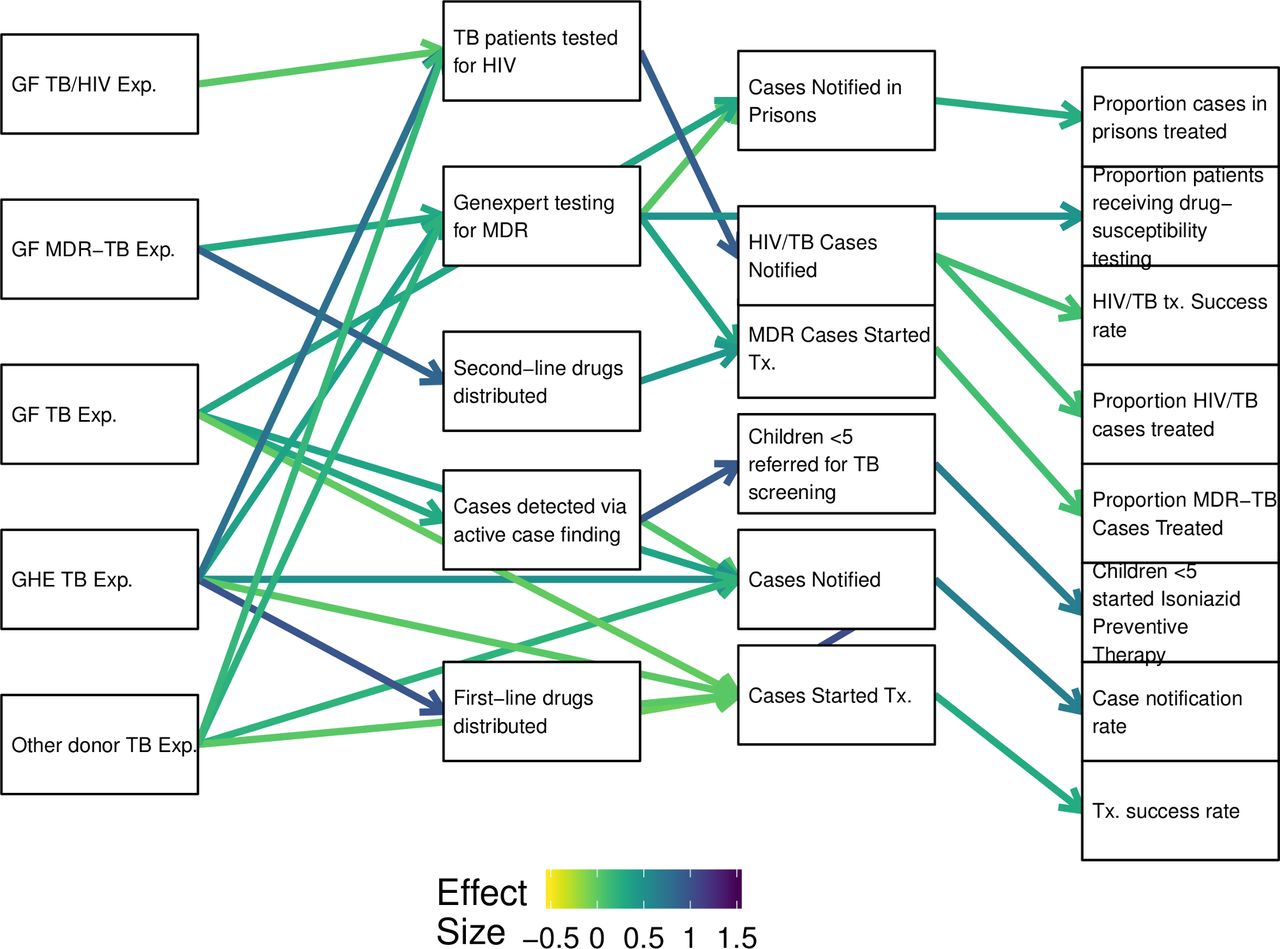
Figure 3 displays the model results for TB in Guatemala. In Guatemala, the strongest model coefficients were notably more evenly distributed throughout the results chain. Standardised model coefficients ranged from −0.05 (95% CI −0.04 to −0.06), along the pathway connecting first-line drugs distributed to cases started on treatment to 1.04 (95% CI 0.97 to 1.11), along the pathway connecting cases notified to cases started on treatment. CIs were notably more consistent than in the DRC model, ranging from the coefficient connecting the number of cases screened for MDR-TB to the number of cases notified in prisons (midpoint: 0.023, 95% CI 0.020 to 0.025), to that connecting the number of HIV-TB cases notified to the proportion of HIV-TB cases treated (midpoint: 0.123, 95% CI −0.037 to 0.283).

Model diagrams and effect sizes in structural equation models of TB in Guatemala. Full definitions of each variable are listed in online supplemental appendix 2, table 1. ARV, antiretroviral medication; Exp, expenditure; GF, global fund; MDR-TB, multidrug-resistant tuberculosis; Tx, treatment.
The diagram differed in Senegal to include context-specific activities and outcomes (figure 4). The Senegal results varied the most widely, but in general the coefficients in the Community Care for TB pathways (GF TB Comm Exp) had the largest coefficients in the model. There was a positive association between funding for TB community care and several activities to refer people to care and treatment (including home visits, social mobilisations, and radio broadcasts). In turn, home visits had a positive association with several outputs including number of probable cases referred to care (midpoint: 1, 95% CI 0.96 to 1.04) and the number of children in contact with TB patients referred to preventive treatment (midpoint: 0.96, 95% CI 0.85 to 1.07). Some pathways in this model resulted in extreme and highly uncertain estimates that lacked interpretable value (shown in grey). For example, activities such as social mobilisation campaigns and radio broadcasts may be distantly related to treatment success and difficult to assess numerically in a similar way, but were important to represent in the model for stakeholder context.
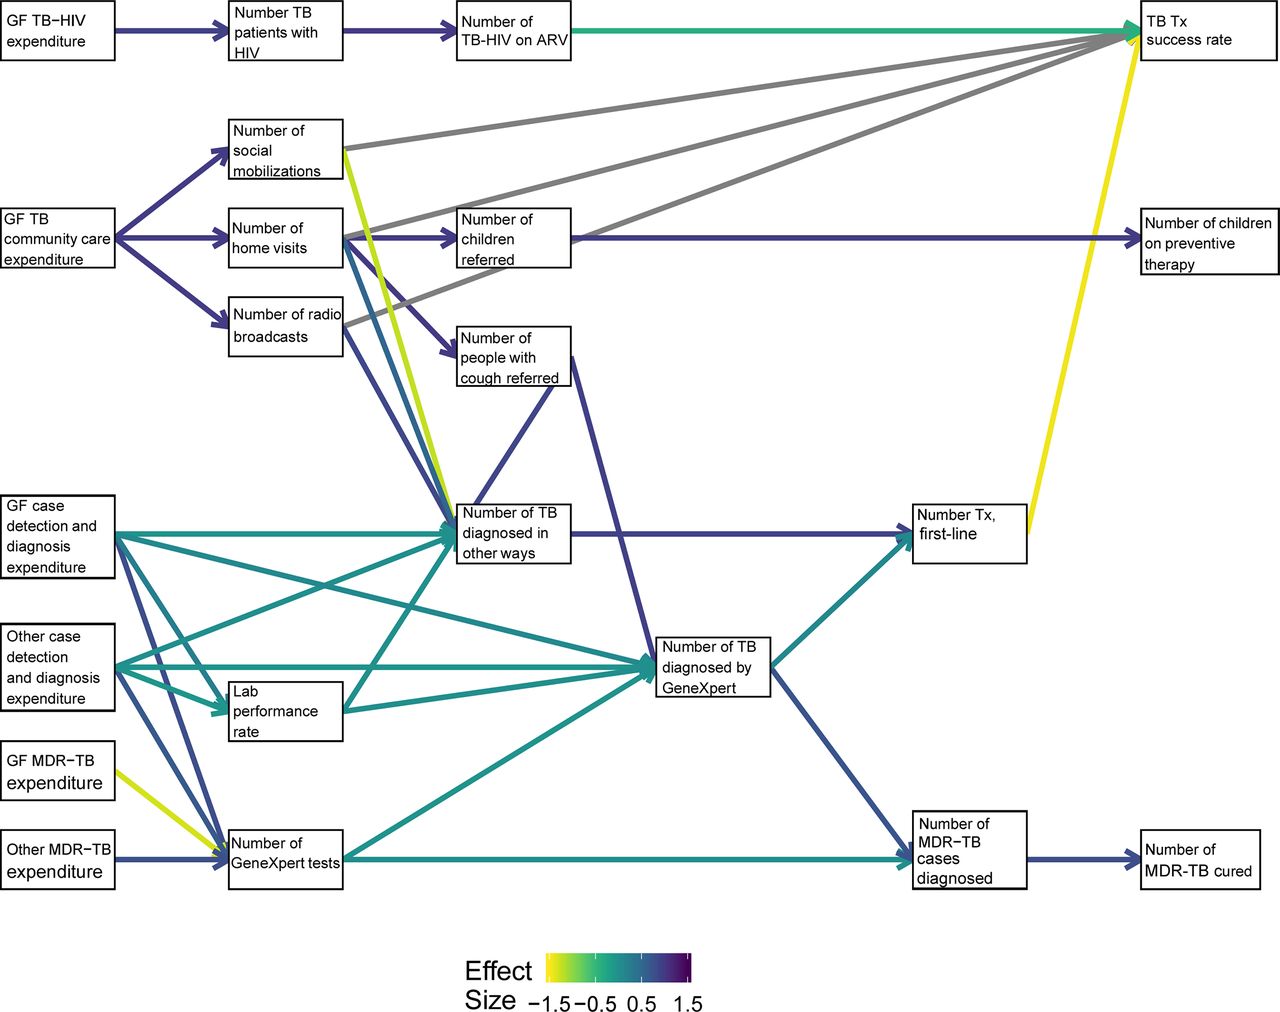
Model diagrams and effect sizes in structural equation models of TB in Senegal. Full definitions of each variable are listed in online supplemental appendix 2, table 1. Grey pathways indicate extreme and highly uncertain coefficients. ARV, antiretroviral medication; GF, global fund; MDR-TB, multidrug-resistant tuberculosis; Tx, treatment.
Postmodelling applications
In DRC, the PCE used the above model to measure efficiency and what may be called implementation effectiveness, that is, the rate by which outputs have translated into outcomes. The model provides a new estimate of the end-to-end cost of delivering commodities above simply the procurement cost. For example, the model estimates that it cost US$9.95 on average (95% uncertainty interval: US$5.68–US$40.12) to procure and ship one insecticide-treated nets (ITN) during the period 2010–2018. The model similarly estimates an average cost of US$3.04 (95% uncertainty interval: US$1.73–US$12.83) per RDT, and US$1.56 (95% uncertainty interval: US$0.88–US$6.74) per ACT procured and shipped. Regarding effectiveness, this approach estimates that for every ten additional ITNs distributed to households, an additional 3.95 (95% uncertainty interval: 1.74–6.17) persons have consequently reported sleeping under ITNs the previous night. In the model diagram, this equates to a standardised coefficient of 0.36 (95% CI 0.15 to 0.57). The coefficient for ITN distribution is comparatively lower than the coefficient for treatment delivery, either through community case management (estimate: 0.56, 95% CI 0.22 to 0.90) or in-facility, either severe (estimate: 0.5, 95% CI 0.07 to 0.93) or uncomplicated malaria (estimate: 0.70, 95% CI 0.34 to 1.06), suggesting lower implementation effectiveness for ITN distribution than delivery of medications.
In Guatemala, the PCE used the above model to assess potential bottlenecks in service delivery and to understand mediation in the relationships between inputs and outputs. We observed that the coefficient connecting number of notified cases of comorbid HIV/TB to TB treatment success rates for patients living with HIV (estimate: 0.1, 95% CI 0.05 to 0.15) is weaker than the coefficient connecting drug susceptible TB treatment initiation to drug susceptible TB treatment success (estimate: 0.28, 95% CI −0.02 to 0.58). A similarly low coefficient was observed connecting MDR-TB treatment initiation to MDR-TB treatment coverage (estimate: 0.1, 95% CI −0.19 to 0.39). In other words, treating drug-resistant and comorbid patients appears to be a potential bottleneck regarding successful care in Guatemala’s national TB programme. On the other hand, the relatively evenly distributed coefficients throughout the Guatemala model may be indicative of a health system with fewer obvious weak points. Regarding mediation, the HSM was used to observe that while the relationship between Global Fund TB expenditure and cases notified (estimate: 0.33, 95% CI 0.16 to 0.5), as well as the relationship between government TB expenditure and cases notified (estimate: 0.51, 95% CI 0.39 to 0.63) were moderately strong, their relationship with treatment initiation was relatively weak (controlling for case notification). This is largely due to the very strong relationship between case notification and treatment initiation. In other words, the model estimates an effect of expenditure on treatment initiation that is largely mediated through case notification, and with very little direct effect.
In Senegal, the PCE used the above model to identify potential weak links in the cascade of care, and to explore subnational patterns in implementation effectiveness. We observed that the coefficient relating the number of TB patients started on first-line treatment and drug-susceptible TB treatment success rates is, on average across the country, negative (estimate: −1.44, 95% CI −26.63 to 23.75). While the number of cases successfully treated has increased over time in the data included in this analysis, this negative coefficient indicates that it has not increased as rapidly as treatment initiation. This points to a specific stage in the TB cascade of care that is underperforming. In addition, the we used the model to examine how many of these coefficients vary within the country. For example, the same coefficient was highly variable between regions as shown in figure 5. While some regions’ estimates were less certain than others (eg, the Diourbel region had a coefficient of 29.86% and 95% CI of 1.69 to 57.51), the single national number obscures noteworthy variation within the country.

Subnational variation in coefficient relating the number of TB patients started on first-line treatment and drug-susceptible TB treatment success rates in Senegal. Depicts coefficient estimates from the Senegal model on a standardised scale, that is, depicting the number of SD drug-susceptible TB treatment success rates were expected to change per SD increase in the number of TB patients started on first-line treatment. TB, tuberculosis.
Discussion
As part of the PCE, we developed conceptual frameworks and health system models for HIV, TB and malaria and applied them to evaluate delivery of a complex package of interventions in three countries. Although the models do come with some important limitations, we believe this study shows that an HSM approach is a valuable addition to other implementation science methods to gain greater insight into the functioning of health service delivery.
Statistical and mathematical models to evaluate global health interventions are rarely done in a way that emphasises multiple, interdependent interventions, indirect effects and relationships along causal pathways. Modelling approaches are being employed to measure important health indicators with ever more precision and validity,33–35 but despite advances, they usually focus on the nuances of disease transmission processes or on forming highly accurate predictions, with the near-universal objective of helping policy-makers prioritise and allocate resources.36 In other words, most statistical models in global health are used to aid decision science, but may be equally valuable to aid implementation science, as this study has aimed to do.
Through the PCE, teams are already disseminating these results for use in informing national programme strategies, grant implementation processes, and topics for further investigation. For example, the suggestion from some of the findings in DRC are that these new estimates could have practical utility for budgeting during the next funding request (estimates of cost per unit delivered), as well as setting realistic targets for grant implementation (estimates of increases in coverage per additional output). In Guatemala, the potential bottlenecks identified have been considered as an evidence-based starting point for further qualitative evaluation. In Senegal, diverse subnational patterns are being disseminated as a way of drawing increased attention to equity considerations for areas that may need further prioritisation by the national programme. In each country, model results were also used in triangulation with other evaluation results to support the findings of other methods or identify areas needing further study. In these ways, the PCE has used an HSM approach to gain pragmatic insights about how to improve implementation in grants and programmes.
This work extends earlier efforts in the application of HSM in multiple ways. First, by collaboratively developing conceptual frameworks and models with in-country teams, these models are locally-relevant, tailored to the specific interventions occurring in a country, and incorporate the most robust data sources available in each setting. As others have advocated, purposively inclusive, theory-based practices should be further emphasised in global health systems research.14 37 38 Second, by carrying out these models as part of a prospective evaluation, we have produced timely results that can be readily used by stakeholders, demonstrating that HSM approaches—especially post-modelling analysis—can potentially aid programme implementation directly. Finally, this work adds to the broader literature of assessing the contribution of development assistance towards health outcomes. As Ataya et al13 describe measuring the effect of health investment by tracking trends in mortality, morbidity and coverage indicators overlooks the complex causal pathways by which investments become changes in outcomes. This work demonstrates an approach toward detailing those causal pathways.
Another strength of this work is the use of routine national programme data, an underused data source in LMICs.39 National programme data and administrative data, sometimes referred to as health management information system (HMIS) data, are collected in increasing volumes in most LMICs, but are rarely analysed in academic literature across a whole health system or disease area. There are important caveats to these data, as low completeness can render them poorly representative of population-level health outcomes. However, through over a decade of financial investment in HMIS and sustained work by in-country monitoring and evaluation teams, HMIS data are increasing in completeness and coverage.40 41 We expect these data systems to continue to improve, making it imperative to advance analytical methods that use them for purposes such as implementation science.
There are also important limitations to these analyses. Already mentioned, data quality and availability among HMIS data can vary. Although we have taken steps to systematically correct for issues such as missing data and outliers, systematic misclassification (either overcounting or undercounting) may persist and contribute to bias in the model results. Further, some data included in the model were found to be highly variable, at times resulting in wide uncertainty intervals described above. For this reason, the direction and magnitude of the coefficients represented in the model should be interpreted in the context of other data, such as from stakeholder interviews. Finally, the availability of data limited our ability to comprehensively reflect the conceptual framework, especially with indicators that pertain to non-financial inputs and activities that lack traceable commodities.
Apart from data quality limitations, a number of model limitations are important to discuss as well. First, the models presented here are all static models. No time-varying or otherwise-dynamic coefficients were built into the models, although dynamic HSM have already been identified as the standard.15 Second, the models presented are necessarily a simplification of the complete conceptual framework. Numerous variables and elements were included in the conceptual model but not in the statistical model, leaving important gaps between adjacent indicators and some pathways only superficially represented. Similarly, we elected to aggregate some variables, especially financial variables to construct the model, which loses some detail in terms of expenditure by intervention. Third, the lagged relationships between inputs and activities, as well as certain outputs and treatment success rates were uniformly applied. In reality, the delay between expenditure and activity is likely to both fluctuate over time and by intervention, but this model assumed them to be constant. Finally, many factors from outside the health system are not reflected in this model, and thus confounding may be of concern. While many linkages, such as the linkage between shipment of a commodity and facility output of it, may be assumed to be unaffected by changes in community indicators, others, such as the linkage between coverage of services and changes in burden of disease, are inarguably confounded. This limited our ability to reliably measure those aspects of the results chain, hence the models that conclude with outcomes rather than impact. Each of these limitations is important, but they are also the result of an applied, use-focused approach; we developed these models expressly for the purpose of evaluating implementation in a way that it can be used in a timely fashion.
Future directions of this work may seek to mitigate some of these limitations. For example, more detailed examination of specific aspects of the results chain, such as supply chains, already exists and could be incorporated into these models.42 43 Some authors have advocated an approach that focuses on the least-certain pathways for secondary analysis.14 Other HSM work has implemented both systems dynamics models and disease transmission models in tandem to reach the end of the results chain.18 25
Nevertheless, we believe HSM approaches have important utility in complex evaluations and implementation science. Among global policy-makers, the mechanisms of local health service delivery are often perceived as micro-planning concerns outside the control of donors and the international community. But to improve population health it is imperative to both identify effective interventions and to deliver them efficiently and effectively, and both global and local stakeholders benefit from better delivery. This is especially true in the context of stagnating development assistance for health as has been the case for several years.6 To do so, a continued focus on the complexity of health systems and the delivery of services through them is necessary, and the approach demonstrated here may be an important new approach for doing just that in global health evaluations.
Acknowledgments
The authors wish to acknowledge the many evaluators involved in the Prospective Country Evaluation, including those not listed as authors to this manuscript from global evaluation partners Euro Health Group, Institute for Health Metrics and Evaluation, Johns Hopkins University, PATH Seattle, and University of California, San Francisco, as well as country evaluation partners not listed as authors to this manuscript from Centro de Investigación Epidemiológica en Salud Sexual y Reproductiva (Guatemala), Infectious Disease Research Collaboration (Uganda), Institut Santé et Développement (Senegal) and PATH (DRC). Finally, the authors thank the Technical Evaluation Reference Group (TERG), the TERG Secretariat and the Monitoring, Evaluation and Country Analysis (MECA) teams of the Global Fund for their guidance and support in this study.
References
Supplementary materials
Supplementary Data
This web only file has been produced by the BMJ Publishing Group from an electronic file supplied by the author(s) and has not been edited for content.
Footnotes
Handling editor Valery Ridde
Contributors All authors contributed to the conception, design and implementation of the study, and contributed to the final manuscript. DEP drafted the initial manuscript and developed the modelling approach. DEP and JMR led analysts in each country. GA, EK, EL, DEP and JMR collated data and carried out the Guatemala-TB model. SM, KC, AB and DEP collated data and carried out the DRC-Malaria model. IG, AF, RT, FRC and DEP collated data and carried out the Senegal-TB model. CC, JM, GM, KS, EP, BH and CO-C provided further insight and interpretation of results. EK, SM, AF and RT led the Guatemala, DRC and Senegal teams respectively. HD, BHP and SSL led the IHME team.
Funding This research was supported by the Global Fund to Fight AIDS, TB and Malaria as part of the Global Fund Prospective Country Evaluation Study.
Disclaimer The funder had no involvement in the decision to submit for publication.
Competing interests None declared.
Patient consent for publication Not required.
Provenance and peer review Not commissioned; externally peer reviewed.
Data availability statement Data are available on request. Data may be obtained from a third party and are not publicly available. Data were acquired through direct engagement with national TB and malaria programmes, via web-based platforms, through direct engagement with the Global Fund to Fight AIDS, TB and Malaria or via publicly available data sources. Some data may be available for sharing on request, dependent on the specific request.
Supplemental material This content has been supplied by the author(s). It has not been vetted by BMJ Publishing Group Limited (BMJ) and may not have been peer-reviewed. Any opinions or recommendations discussed are solely those of the author(s) and are not endorsed by BMJ. BMJ disclaims all liability and responsibility arising from any reliance placed on the content. Where the content includes any translated material, BMJ does not warrant the accuracy and reliability of the translations (including but not limited to local regulations, clinical guidelines, terminology, drug names and drug dosages), and is not responsible for any error and/or omissions arising from translation and adaptation or otherwise.