Article Text

Abstract
Introduction The COVID-19 pandemic is an unprecedented public health crisis. It is becoming increasingly clear that people’s behavioural responses in the USA during this fast-changing pandemic are associated with their preferred media sources. The polarisation of US media has been reflected in politically motivated messaging around the coronavirus by some media outlets, such as Fox News. This resulted in different messaging around the risks of infection and behavioural changes necessary to mitigate that risk. This study determined if COVID-related behaviours differed according to trust in left-leaning or right-leaning media and how differences changed over the first several months of the pandemic.
Methods Using the nationally representative Understanding America Study COVID-19 panel, we examine preventive and risky behaviours related to infection from COVID-19 over the period from 10 March to 9 June for people with trust in different media sources: one left-leaning, CNN and another right-leaning, Fox News. People’s media preferences are categorised into three groups: (1) those who trust CNN more than Fox News; (2) those who have equal or no preferences and (3) those who trust Fox News more than CNN.
Results Results showed that compared with those who trust CNN more than Fox news, people who trust Fox News more than CNN engaged in fewer preventive behaviours and more risky behaviours related to COVID-19. Out of five preventive and five risky behaviours examined, people who trust Fox News more than CNN practised an average of 3.41 preventive behaviours and 1.25 risky behaviours, while those who trust CNN more than Fox News engaged in an average of 3.85 preventive and 0.94 risky behaviours, from late March to June. The difference between these two groups widened in the month of May (p≤0.01), even after controlling for access to professional information and overall diversity of information sources.
Conclusions Our findings indicate that behavioural responses were divided along media bias lines. In such a highly partisan environment, false information can be easily disseminated, and health messaging, which is one of the few effective ways to slowdown the spread of the virus in the absence of a vaccine, is being damaged by politically biased and economically focused narratives. During a public health crisis, media should reduce their partisan stance on health information, and the health messaging from neutral and professional sources based on scientific findings should be better promoted.
- prevention strategies
- public health
- health education and promotion
This is an open access article distributed in accordance with the Creative Commons Attribution Non Commercial (CC BY-NC 4.0) license, which permits others to distribute, remix, adapt, build upon this work non-commercially, and license their derivative works on different terms, provided the original work is properly cited, appropriate credit is given, any changes made indicated, and the use is non-commercial. See: http://creativecommons.org/licenses/by-nc/4.0/.
Statistics from Altmetric.com
Key questions
What is already known?
COVID-19 can be mitigated by good health behaviours. The media serves as an important means of diffusing this factual information in the USA, especially during a time of emergency.
During public health crises, much of the health messaging via mass media in the USA either does not follow best practices for effective crisis communication or contains misleading information.
What are the new findings?
People’s media preference is associated with their behaviours during the pandemic. Those who trust Fox News more than CNN exhibited a significantly lower number of preventive behaviours and higher number of risky behaviours related to COVID-19.
What do the new findings imply?
Media plays an important role in promoting health knowledge. News outlets need to reduce their political stances on health information during a health crisis.
As the COVID-19 pandemic continues, public health agencies should better use strategic health messaging tools to raise public attention in order to contain the potential spread of the virus.
Introduction
By late July 2020, COVID-19 had infected over 4 million people and killed at least 150 000 people in the USA.1 With no vaccine and limited treatment options, the only remaining strategy to reduce cases is infection mitigating precautions and accurate health messaging.2–5 Behaviours recommended to reduce COVID-19 infection include frequent hand washing, decreasing social contact and wearing masks and gloves.6 An essential component of this messaging is the mass media, which educates the public with what is known about the virus and information about health behaviours that can reduce individual-level risk.7 In the USA, the media serves as an important means of diffusing information, especially during a time of emergency.8 However, the information is often defined, processed and presented by different stakeholders with distinct views and interests that can motivate delivery of biased and misleading information.9 10 Previous studies have shown that, during public health crises, much of the health messaging via mass media either does not follow best practices for effective crisis communication or contains misleading information.11 12 The spread of false information is associated with the transmission patterns and consequently the scale of the pandemic.13
In particular, the political orientation of a media outlet may influence the type of coverage an issue receives.14 Despite being recognised as a global public health crisis by healthcare professionals, the significance of COVID-19 has become a part of an ongoing political debate in the USA. This debate results in media coverage that promotes partisan narratives on COVID-19. The portrayal of the situation is often quite different between left-leaning and right-leaning news outlets. In the USA, Fox News is the largest cable news channel and is considered a right-leaning news source. Cable News Network (CNN) is the second largest US cable news channel and is considered a left-leaning news source. Since the pandemic, CNN has been providing a relatively consistent narrative that matched the views and recommendations of health experts. However, Fox News consistently downplayed the lethality of the pandemic to match the Republican administration’s narrative.15 This politically driven narrative may have led their viewers to believe the pandemic was not as serious as the mainstream media claimed. Therefore, they may be less cautious and engage in risky health behaviours. Past literature has shown that conservatives who paid close attention to right wing media sources were less likely to take infection mitigating precautions.16 According to a survey conducted by the Pew Research Center, responses to the pandemic vary drastically among Americans who identify Fox News, CNN or Microsoft National Broadcasting Company (MSNBC) as their primary media source. In particular, 79% of viewers of Fox News believed the media exaggerated the risks related to COVID-19, in comparison to 54% of CNN viewers and 35% of MSNBC viewers.17 It is important to better understand the relationship between political bias in the media and health behaviours, as risk-reducing behaviours are critical to protecting public health during a major epidemic.
We are also interested in exploring behavioural change over the course of the pandemic related to the bias in trusted media sources. Increasing prevalence of the virus may make people more cautious and lead to adjustments in their mitigating behaviours. However, the political narratives of the pandemic also changed over time, which may be reflected in changing behaviours. While CNN had a more consistent narrative that matched the views and recommendations of health experts over the period of study, Fox News continued to shift their narratives in order to echo views of leaders of the republican party. For instance, Fox News quickly changed its narrative from describing the pandemic as a ‘hoax’ to referring to the virus as a ‘crisis’ after President Trump’s declaration of a national emergency.18 However, starting in April, Fox News changed their narrative again to push for reopening of the economy by downplaying the significance of the pandemic and instead focusing on the importance of the economy to the health and well-being of Americans.19
The objective of this study is to examine whether Americans’ media preferences are associated with their virus mitigating health behaviours during the first several months of the COVID-19 epidemic. We hypothesise that people who trust Fox News more than CNN practice fewer preventive behaviours and more risky behaviours. We also hypothesize that differences in people’s mitigating behaviours changed over time according to shifting media narratives.
Methods
Data
We used data from the Understanding America Study (UAS) COVID-19 Survey National Sample. The UAS survey is an ongoing longitudinal national probability-based internet panel of approximately 9000 non-institutional US adults. It has collected information at multiple time points each year on economic, labour, attitudinal and health measures since 2014, administered by the Center for Economic and Social Research, University of Southern California (USC). Respondents answered the survey questions on a computer, tablet, or smartphone, and they were provided a tablet and broadband internet if they did not have access to the internet.
To better understand how the COVID-19 affects American households, the UAS COVID-19 national survey20 started tracking the pandemic impact since 10 March 2020. Follow-up surveys were fielded every 2 weeks beginning 1 April 2020. Each day during the survey period, 1 in 14 of the respondent pool was invited to take the online survey and given 2 weeks to respond. More than 90% of the responses were completed in 2 weeks for each wave, and most close to the time of receipt of the survey, because of additional incentives for a prompt response. The main support for this COVID-19 national survey is provided by USC and the Bill & Melinda Gates Foundation. The parent survey is supported by the US NIH and Social Security Administration.
The current study uses the first five waves of the study, which were collected 10 March to 31 (wave 1), 1 April to 29 (wave 2), 15 April to May 12 (wave 3), 29 April to May 26 (wave 5) and 13 May to June 9 (wave 6). Among the 8502 invited to the COVID-19 survey in March, 6933 (82%) completed it. After limiting our analysis to participants who completed surveys in all five waves (n=4942) and excluding respondents with missing information on model covariates (n=79), our final analtytical sample consisted of 4863 respondents.
Measures
Our dependent variables are the preventive behaviour score, measured at each of the five waves, and the risky behaviours score, measured at waves two through five.
Preventive behaviours
Respondents were asked ‘which of the following have you done in the last 7 days to keep yourself safe from coronavirus?’:worn a face mask; washed your hands with soap or used hand sanitiser several times per day; cancelled or postponed personal or social activities; avoided eating at restaurants; and avoided public spaces, gatherings or crowds. Response options included’yes’, ‘no’ or ‘unsure’. We created binary indicators with yes responses coded as 1 and no responses coded 0. We coded ‘unsure’ as 0 since the behaviours were well defined in the questions and an ambiguous response likely indicated non-participation in the activity. We then summed across the five items to create a preventive behaviour score ranging from 0 to 5.
Risky behaviours
Similarly, respondents were also asked ‘in the last 7 days, have you done the following?’: Gone out to a bar, club or other places where people gather; gone to a friend, neighbour or relative’s residence (that is not your own); had visitors such as friends, neighbours or relatives at your residence; attended a gathering with more than 10 people, such as a reunion, wedding, funeral, birthday party, concert or religious service; had close contact (within 6 feet) with people who do not live with you. Response options were again ‘yes’, ‘no’, ‘unsure’. We coded the answer ‘unsure’ as ‘yes’, and constructed a risky behavioural count ranging from 0 to 5 indicating the number of ‘yes’ answers.
Our independent variables were all measured at the first interview and include media preference, access to professional sources of information, diversity of sources of information and sociodemographic characteristics.
Media preference
Participants were asked ‘how much do you trust the following sources of information about the coronavirus (COVID-19)?’ about 18 sources, including CNN and Fox News. The responses included ‘trust completely’, ‘trust mostly’, ‘trust somewhat’ and ‘do not trust at all’. We chose to focus on CNN and Fox News because (1) they are two largest US news outlets, and (2) the Ad Fontes Media rating of media political bias designates CNN as left-leaning and Fox News as hyperpartisan right.21 Based on respondents’ self-reported trust for the two news outlets, we created a variable capturing three categories of media preference: (1) those who trust CNN more than Fox News; (2) those who have equal or no preference and (3) those who trust Fox News more than CNN. This variable is used as an indicator of the COVID-related health messaging that viewers receive from watching their trusted news media, which is characterised by the media’s own narrative. This measure also captures the effect of how individuals filter information based on their own biases.
Self-reported access to professional sources
We included a professional information accessibility score as a covariate because this information source may also influence people’s perception of the pandemic and thus influence their behaviours. Participants were asked ‘Which of the following information sources have you used to learn about the coronavirus in the past 7 days?’, and provided a list of 20 sources that included government officials and agencies, health professionals and organisations, as well as social and traditional media. Respondents indicated ‘yes’ if they used the source and ‘no’ otherwise. For this variable, we only included health professionals and organisations, which are WHO, the US Department of Health and Human Services, the Centers for Disease Control and Prevention (CDC), local public health officials and physicians. The professional information accessibility score is the count of professional sources a participant reported he/she used to understand the pandemic, and ranges from 0 to 5.
Diversity of information
The other 15 sources out of 20 were used to develop an index of diversity of information sources. These included contacts on social media, close friends/family members, coworkers/classmate/other acquaintances, public television (TV) and radio, international/national/local TV news, national/local newspapers, and president Trump/vice president Pence. The count ranges from 0 to 15.
Covariates
Covariates include age, gender, race/ethnicity, education level and household income. Age was categorised into three groups: younger adults from 18 to 44, middle-aged adults from 45 to 64 and older adults aged 65 and above. Race/ethnic groups include non-Hispanic white, non-Hispanic black, Hispanic, non-Hispanic Asian and others. Education was classified as high school or less, some college education without a bachelor’s degree and a bachelor’s degree or more. Annual household income was categorised into four groups, roughly representing quartiles. In terms of working status, we categorised respondents as: having a job and can work from home having a job but cannot work from home and have no job.
Statistical analysis
Sample characteristics are shown at baseline. Trends in behaviours over time were compared across respondents with different media preferences. To test our hypothesis that people’s behaviours differ across media preference groups, accounting for characteristics known to be associated with media preference, we conducted multivariate Ordinary Least Squares (OLS) regression for preventive behaviours scores and risky behaviours scores. The first model adjusts for sociodemographic characteristics. We determined if the relationship between media preference and behaviours changed over time by including an interaction term between wave and media preference category. Because people may have a more accurate and comprehensive understanding of the pandemic if they learn from a wider range of information sources or information provided by professionals, we also adjust for differences in access to professional sources and overall diversity of information in a second model.
Since these are panel data, we report cluster adjusted standard errors to account for individuals’ repeated observations. All results were weighted to be nationally representative, and all analyses were performed using Stata V.16.
Patient and public involvement
This study uses secondary data. Although members of the public were surveyed as part of the study, no patients or the public were directly involved in the design, conduct, reporting or dissemination plans of this research.
Results
Table 1 shows sample characteristics. While 28.6% of the sample reported more trust in CNN than Fox, about half (51.6%) reported having equal or no preferences, and 19.8% reported trusting Fox more than CNN. In reference to obtaining information about the coronavirus from professional sources of information in the prior 7 days, 73.2% reported using CDC, 54.9% reported using HSS, 58.0% reported using WHO, 24.1% reported using physicians and 54.4% reported using local health officials. On average, people used 2.6 professional sources and 5.7 media information sources to learn about the coronavirus in the past 7 days.
Sample characteristics at baseline: UAS COVID-19 Study (n=4840)
With respect to the age distribution of the sample, 41.5% are age 18–44, 35.6% are 46–64 and 22.9% are 65 and older. The sample is about equally male (50.4%) and female (49.6%). Two-thirds of the sample are non-Hispanic whites (66.3%), 10.9% are non-Hispanic blacks, 13.9% are Hispanics, 5.5% are non-Hispanic Asians and 3.4% are non-Hispanic others. The percentage of people who have a high school degree or less is 35.8%, while 27.8% have some college experience and 36.4% have a college degree or more. In terms of household income, 25.1% of the sample earn less than US$30 000 per year, 27.1% earn between US$30 000 and US$59 999, 24.3% earn between US$60 000 and US$99 999, and 23.5% earn more than US$100 000. About two-fifths (40.4%) of the sample do not have jobs, 23.2% have jobs and are able to work from home and 36.5% have jobs but are not able to work from home.
Figure 1 descriptively depicts the trends over time in preventive behaviours by media preference or the percentage of people within each of the three media preference groups who report having practised each preventive behaviour within the past 7 days (point estimates, 95% CIs and p values from tests of differences are reported in online supplemental table 1). At most time points, people who trusted CNN were more likely to engage in preventive behaviours than those who trust Fox News. We observe marked change in most preventive behaviours over time. For most of the preventive behaviours, the peak engagement appears during 1 April to 29 April at the second wave of the survey. With the third wave, the percentages engaging in preventive behaviours started to drop. The one behaviour which did not follow the same time pattern was wearing masks which increased over time, but generally levelled off near the end of the observation period. The summary measure indicated a relatively constant level of behaviours for people who trust CNN more, but for those who trust Fox News engaging in preventive behaviours declined over time.
Supplemental material
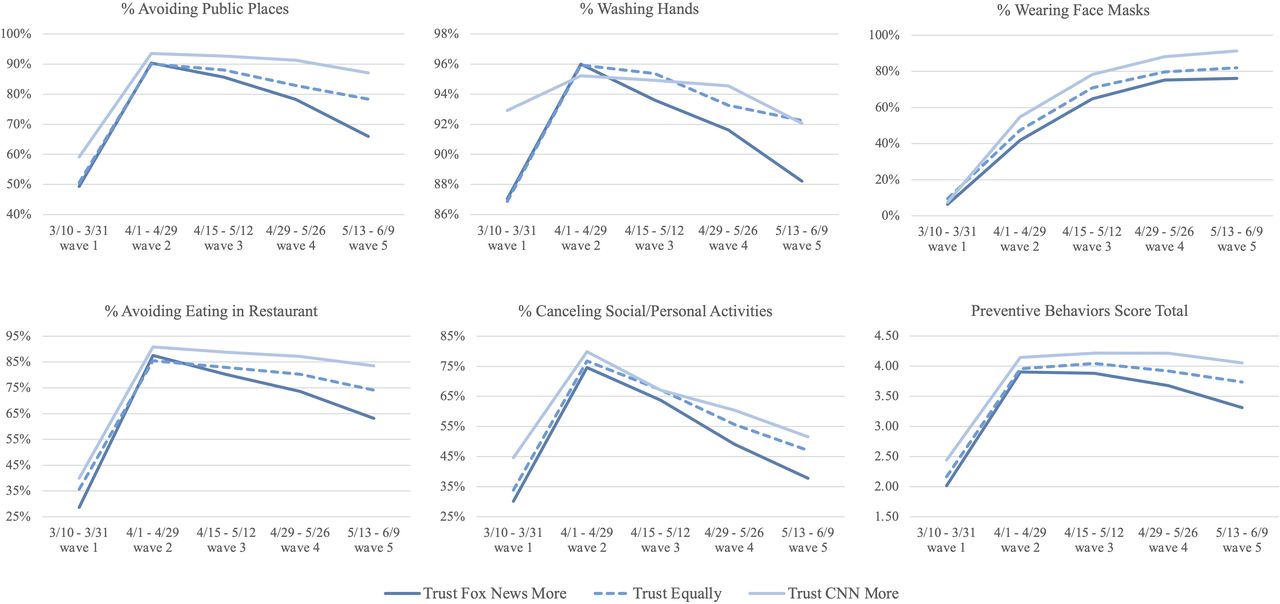
The Percent Practicing Preventive Behviors Over Time by Media Preferences. Preventive behaviours include: ‘worn a face mask’, ‘washed your hands with soap or used hand sanitiser several times per day’, ‘cancelled or postponed personal or social activities’, ‘avoided eating at restaurants’ and ‘avoided public spaces, gatherings or crowds’. Percentages and CIs can be found in the online supplemental table 1.
Figure 2 shows the trends in risky behaviours descriptively and CIs can be found in the online supplemental table 1. Starting in wave 2 the proportion engaging in risky behaviours has been increasing, but, in general, risky behaviours were highest among those who trust Fox News more and lowest among those who trust CNN more. The CIs can be found in the online supplemental table 1.

The Percent Practiving Risky Behaviors Over Time by Media Preferences. Risky behaviours include: ‘Gone out to a bar, club or other places where people gather’, ‘gone to a friend, neighbour or relative’s residence (ie, not your own)’, ‘had visitors such as friends, neighbours or relatives at your residence’, ‘attended a gathering with more than 10 people, such as a reunion, wedding, funeral, birthday party, concert or religious service’, ‘had close contact (within 6 feet) with people who do not live with you’. Percentages and CIs can be found in the online supplemental table 1.
To further understand the difference across media preference groups and the time trend observed in the figures, we conducted a regression analysis including additional control variables and the interaction of media preference and time. The results of the regression model are presented in table 2. We treat wave two as the reference category because it was the peak of the epidemic and the period at which was observed the least difference between media bias groups.
Results of regressions predicting preventive behaviours and risky behaviours
We first present the results for preventive behaviours. As shown in the preventive model 1, at the second wave, people who have equal or no preferences practised fewer preventive behaviours (β=−0.13, p=0.012) than people who trust CNN more, and people who trust Fox News more practised the fewest preventive behaviours among the three media preference groups (β=−0.16, p=0.006). The reduction in preventive behaviours for the equal preference group was significant at waves 4 and 5 compared with those who trust CNN more (wave 4: β=−0.11, p=0.032; wave 5: β=−0.13, p=0.025) and the reduction for those who trust Fox New more was even greater (wave 4: β=−0.30, p<0.001; wave 5: β=−0.51, p<0.001).
People aged 65 and above, women, non-Hispanic Asians, and the most educated are more likely to practise preventive behaviours (p<0.001). Those who have a job but cannot work from home performed fewer preventive behaviours (β=−0.14, p=0.005). In the preventive model 2, the effects of media preferences on preventive behaviours become insignificant after controlling for self-reported access to professional information and diversity of information, which are both associated with more preventive behaviours (p<0.001).
In model 1, preference for Fox News over CNN was also significantly associated with more risky behaviours (β=0.13, p=0.031) at wave 2. Risky behaviour increased with the passage of time, and this positive time effect is significantly higher after wave 4 (wave 4: β=0.23, p<0.001; wave 5: β=0.51, p<0.001) compared with before. During the last two waves, the positive effect of a preference for Fox News on risky behaviours is significantly enhanced (wave 3: β=0.12, p=0.038; wave 4: β=0.23, p<0.001; wave 5: β=0.31, p<0.001). People who have equal or no preferences engaged in more risky behaviour at wave 2 (β=0.11, p=0.027) than people who trust CNN more. However, these two groups do not differ in the time change in risky behaviours.
People aged 65 and older, women, non-Hispanic Asians, the most educated, and those who do not have a job are less likely to practise risky behaviours (p<0.05). Those who have a job but cannot work from home are more likely to practise risky behaviours (β=0.15, p=0.009). In model 2 for risky behaviours, after controlling for access to professional information and diversity of information, all previously mentioned effects remain significant except for those who have equal or no preferences and the most educated. Diversity of information is linked to more risky behaviours (p=0.012) while having more sources of professional information is linked to fewer (p<0.001).
Our models predict that through all waves, people who trust Fox News more than CNN practised an average of 3.41 preventive behaviours, while people who trust CNN more than Fox News practised 3.85 preventive behaviours. People who trust Fox News more than CNN practised an average of 1.25 risky behaviours, while those who trust CNN more than Fox News engaged in 0.94 risky behaviours. We also confirmed that people who trust Fox News more than CNN have consistently practised fewer preventive and more risky behaviours from wave 1 to 5, compared with who trust CNN more (p≤0.01). Those who have equal or no preferences practised significantly more preventive and fewer risky behaviours than those who trust Fox News more during the last two waves (p<0.01), and consistently exhibited significant fewer preventive and more risky behaviours than who trust CNN more for all waves (p<0.05).
Discussion
The purpose of the study is to determine whether people’s COVID-19 mitigating health behaviours varied according to their trust in partisan media sources. There were three main findings, (1) that people who trust right-leaning media more than left-leaning media engaged in significantly fewer preventive and more risky behaviours throughout the survey period; (2) people’s health behaviours changed significantly over time and (3) the change in people’s behaviours overtime varies by media preference.
First, people who trust Fox more than CNN exhibited significantly fewer preventive behaviours and more risky behaviours, compared with those who trust CNN more than Fox. This observation matched previous literature. A study by Simonov et al 18 showed that an increase in Fox News viewership was associated with a reduction in the tendency to stay at home. A different study by Anderson used cellular mobility data and found that areas with a higher share of CNN viewers had a larger increase in the fraction of devices staying at home, whereas an increase in Fox News viewership was associated with a decrease in the share of devices staying at home.22
We believe there are two possible explanations for this observation. First, people’s behaviours are influenced by the biased health messaging provided by politically driven narratives. As discussed above, compared with CNN, Fox News consistently downplayed the danger of the virus for the sake of political interest.15 Viewers’ understanding of the pandemic is thereby compromised, resulting in poor decision making in their health behaviours.16 Second, people’s behaviours may be influenced by their own political stance, in which the media preference becomes a mere proxy for their political preference instead of a source of information. Specifically, republican ideology has long been centred around the idea of individualism and an emphasis on personal freedom, which has been reflected in a conservative health policy agenda throughout US history.23 Therefore, it is possible that people who trust Fox naturally prefer a more ‘hands-off’ approach and are more likely to refuse strict health policies such as self-quarantining and social distancing. The significant association between media preference and behaviours is likely a combination of both mechanisms.
Interestingly, we observed that people that have equal or no preferences between CNN and Fox News generally engaged in more preventive behaviours and fewer risky behaviours than those who prefer the right-leaning media, but engaged in fewer preventive behaviours and more risky behaviours than those who prefer left-leaning media. It is possible that those who do not have a strong media preference are more easily swayed by misleading information compared with those who trust and follow health messaging provided by more factual information sources like CNN.18 Given that over half of our sample have equal or no preferences, this observation provided insight that biased and false health messaging provided by big media sources like Fox may affect not only its group of loyal viewers but also some broader audience who are indifferent in terms of information sources.
In agreement with our expectation, people’s health behaviours changed significantly as the pandemic unfolded. The results suggest that, compared with March, the sample as a whole became more cautious in early April. This observation may be explained by the progression of the pandemic—from March to April, as the daily incidence and the prevalence of COVID-19 confirmed cases and deaths started to rise notably in the USA. However, since late April, regardless of media preference, everyone has increasingly been practising more risky behaviours, either because people have become tired of quarantine, or because state and local governments gradually started implementing opening-up policies. Since the government and research agencies have not reached a consensus on when new COVID-related deaths are going to drop, this behavioural trend should raise public health concerns, and strategic health messaging is needed to contain the potential spread of the virus.
Finally, we observed that the change of people’s behaviours over time varies by media preference, illustrated by the interaction between time and media preference in our results. One explanation may be the political heterogeneity in the change of media narrative over time. Since the beginning of March, as CNN had already started reporting the progression of the pandemic, delivering professional advice and commentaries from the WHO and CDC, while questioning the response of Trump’s administration. On the other hand, during the same period, Fox News downplayed the lethality of the virus and encouraged the public to continue normal activities. They emphasised that the pandemic is no more harmful than a seasonal influenza and ‘an attempt to impeach the president’.24 Thus, the difference between the initial narratives may explain the heterogeneity between people’s behaviours in early March.
However, as numbers of infections and deaths skyrocketed throughout March, Fox News quickly shifted their narratives in mid-March by providing more up-to-date information and inviting medical experts to educate the public about the virus. The same host who described the virus as a ‘hoax’ in early March, Sean Hannity, commented on 18 March that ‘this programme has always taken the coronavirus seriously and we never called the virus a hoax’.24 25 At this time, the CNN and Fox narratives were relatively similar regarding the pandemic. This scenario nicely matched our results, which indicated that both CNN and Fox viewers’ mitigating health behaviours increased rapidly throughout March and peaked in early April—even more rapidly for Fox viewers than CNN viewers.
Yet, the divergence appeared again in May. Our results suggested that, although people’s preventive behaviours declined for both media preference groups in May, the group that trusts Fox more than CNN was declining faster than the group that trusts CNN more than Fox. Risky behaviours followed the same pattern. Again, the results matched the real-life scenario. Starting in May, people started engaging in fewer preventive and more risky behaviours, regardless of their media preferences, but this decline was more salient among people who trust Fox more than CNN, compared with people who trust CNN more than Fox. In terms of the media narratives, Fox News switched back to a politically driven narrative in May. They questioned the efficacy of social distancing, downplayed the significance of the pandemic and instead focused on the importance of the economy. They both directly and indirectly promoted risky behaviours by promoting the benefits of getting outside and prematurely declaring the country safe to reopen. Therefore, compared with people who only trust CNN, who perhaps became less cautious due to an overall decline in awareness, people who only trust Fox showed a faster decline in their mitigating health behaviours. The highly matched overlap between the change of the media’s narratives and the trend of people’s behaviours suggest that during this pandemic, the messages sent from the media were significantly associated with people’s attitudes and responses.
Our study has limitations. First, it is difficult to establish the causal relationship between people’s media preference and their health behaviours. There are two possible underlying mechanisms: (1) People’s behaviours are influenced by the biased health messaging provided by politically driven narratives and (2) People’s behaviours are influenced by their own political stance, in which the media preference becomes a mere proxy for their political preference instead of the information itself. The significant association between media preference and behaviours is likely a combination of both mechanisms; nevertheless, no clear causal relationship can be inferred from this correlation. Our second limitation is that we selected Fox News and CNN as the proxies for political bias in the media. While this selection is largely due to the data availability as well as the partisan reputations of both news outlets, we recognise the potential for future studies to include more news outlets based on their political stances. Finally, we did not have direct measures of either the consumption of media or the content of information disseminated by media sources.
Conclusion
Our research indicated that people’s response to the corona virus pandemic is divided along media bias lines in the USA. Particularly, people who trust a right-leaning media source more exhibited a significantly lower number of preventive behaviours and higher number of risky behaviours related to COVID-19, in comparison to people who trust a more left-leaning source. Moreover, not only do politically driven narratives lead to biased health messaging, but also people may actively filter out the information that does not match their political leanings. This study has many policy implications for the future progression of COVID-19 and health messaging in general. In a highly partisan environment, false information can be easily disseminated. Health messaging, despite being one of the few effective ways to slowdown the spread of the virus in the absence of a vaccine, is doomed to fail if the media prioritise political interests over population health. In fact, the detrimental consequences of the misleading information have been seen in the current pandemic. As an example, recent research shows that more than 22 000 deaths could have been avoided in the New York area if social distancing had been practised just 1 week earlier.6
In order to hold news outlets accountable, media should reduce their partisan stance on health information so that they do not cloud the public’s judgement during a health crisis. Some effective practices for health messaging in the media include carefully communicating what is known/not known about the crisis’ impact on human health based on neutral and professional sources based on scientific findings and promoting action steps the viewer can take to reduce the threat.26–29 It is also important to offer balanced COVID-related information that can increase the viewer’s perceived self-efficacy of practising protective measures, without causing a mental health burden.30
Acknowledgments
Support for the preparation of this paper was provided by a grant from the National Institutes of Health (U01AG054580) and from the National Institute on Aging (P30 AG017265). This paper relies on data from survey(s) administered by the Understanding America Study, which is maintained by the Center for Economic and Social Research (CESR) at the University of Southern California. The content of this paper is solely the responsibility of the authors and does not necessarily represent the official views of USC or UAS. The collection of the UAS COVID-19 tracking data is supported in part by the Bill & Melinda Gates Foundation and by grant U01AG054580 from the National Institute on Aging.
References
Footnotes
EZ and QW are joint first authors.
Handling editor Seye Abimbola
Contributors All four authors outlined and edited drafts. EZ and QW performed analyses and wrote the first draft. JA and EMC also oversaw the analyses. All authors participated in the revision of the article. Final approval of the article is by all authors.
Funding Support for the preparation of this paper was provided by a grant from the National Institutes of Health (U01AG054580) and from the National Institute on Aging (P30 AG017265).
Competing interests None declared.
Patient and public involvement Patients and/or the public were not involved in the design, or conduct, or reporting, or dissemination plans of this research.
Patient consent for publication Not required.
Provenance and peer review Not commissioned; externally peer reviewed.
Data availability statement The survey and data are available from University of Southern California Understanding America Study website: https://uasdata.usc.edu/index.php