Article Text

Abstract
Background Approaches in malaria risk mapping continue to advance in scope with the advent of geostatistical techniques spanning both the spatial and temporal domains. A substantive review of the merits of the methods and covariates used to map malaria risk has not been undertaken. Therefore, this review aimed to systematically retrieve, summarise methods and examine covariates that have been used for mapping malaria risk in sub-Saharan Africa (SSA).
Methods A systematic search of malaria risk mapping studies was conducted using PubMed, EBSCOhost, Web of Science and Scopus databases. The search was restricted to refereed studies published in English from January 1968 to April 2020. To ensure completeness, a manual search through the reference lists of selected studies was also undertaken. Two independent reviewers completed each of the review phases namely: identification of relevant studies based on the Preferred Reporting Items for Systematic Reviews and Meta-Analyses guidelines, data extraction and methodological quality assessment using a validated scoring criterion.
Results One hundred and seven studies met the inclusion criteria. The median quality score across studies was 12/16 (range: 7–16). Approximately half (44%) of the studies employed variable selection techniques prior to mapping with rainfall and temperature selected in over 50% of the studies. Malaria incidence (47%) and prevalence (35%) were the most commonly mapped outcomes, with Bayesian geostatistical models often (31%) the preferred approach to risk mapping. Additionally, 29% of the studies employed various spatial clustering methods to explore the geographical variation of malaria patterns, with Kulldorf scan statistic being the most common. Model validation was specified in 53 (50%) studies, with partitioning data into training and validation sets being the common approach.
Conclusions Our review highlights the methodological diversity prominent in malaria risk mapping across SSA. To ensure reproducibility and quality science, best practices and transparent approaches should be adopted when selecting the statistical framework and covariates for malaria risk mapping. Findings underscore the need to periodically assess methods and covariates used in malaria risk mapping; to accommodate changes in data availability, data quality and innovation in statistical methodology.
- systematic review
- malaria
- review
- geographic information systems
- control strategies
This is an open access article distributed in accordance with the Creative Commons Attribution Non Commercial (CC BY-NC 4.0) license, which permits others to distribute, remix, adapt, build upon this work non-commercially, and license their derivative works on different terms, provided the original work is properly cited, appropriate credit is given, any changes made indicated, and the use is non-commercial. See: http://creativecommons.org/licenses/by-nc/4.0/.
Statistics from Altmetric.com
Summary box
What is already known?
The disproportionate decline of malaria risk overtime and between/within countries in sub-Saharan Africa attributed to biological, environmental, social and demographic factors has triggered a renewed interest in its fine-scale epidemiology.
Enhanced computational ability and availability of data of high quality and volume has enabled the quantification malaria risk burden in space and time leading to the proliferation of methods within a formal statistical framework.
The complexity of spatio-temporal models has increased, making inferential and predictive processes difficult to undertake.
What are the new findings?
The production of more granular estimates of malaria risk hinges on accessibility to and collection of timely data at finer resolutions.
Variable selection should be objectively developed to contribute to the maximum predictive accuracy of the spatio-temporal model.
What do the new findings imply?
Spatio-temporal approaches need to robustly quantify the sub-national burden of malaria risk, as an epidemiological prerequisite to intervention strategies.
Investments in primary data collection at subnational scales, development and continuous application of robust modelling tools and approaches will be important for orienting malaria control and elimination efforts in the next decade.
As the malaria landscape diversifies, new tools will be required to not only highlight changes locally, but also to provide evidence-based insights into factors driving the change.
Introduction
Global efforts to control and eliminate malaria are intrinsically linked to the Sustainable Development Goals.1 Specifically, the Global Technical Strategy (GTS) for Malaria (2016–2030) reiterates the need to reduce both malaria case incidence and mortality rates by up to 90%2 in high burden countries, mostly concentrated in sub-Saharan Africa (SSA), and eliminating malaria in at least 35 countries and preventing resurgence in malaria-free countries.2 However, in 2018, SSA had an estimated 213 million clinical episodes of malaria, caused mainly by Plasmodium falciparum parasite3 . To address this high burden, the GTS emphasises on the need to target interventions according to subnational disease risk stratification.2
The importance of malaria risk mapping in Africa can be traced back to the mid-1950s when malaria epidemiology formed a critical prelude to the design of interventions aimed at eliminating malaria.4 A resurgence in malaria cartography emerged in the 1990s,4–6 coinciding with an era of intensive control and elimination activities. Over the last 20 years, national and subnational malaria risk maps have been developed in many endemic countries in SSA.4 7 8 This has led to a proliferation of methods and an increase in data quality and quantity—prompted by the demands for robust and reliable characterisation of malaria risk in space and time.
The science of malaria cartography has evolved from hand-drawn risk maps to contemporary digital maps due to the demand for computational solutions and methodologies. These are needed to produce accurate estimates at a high spatial and temporal resolution to facilitate monitoring elimination progress within and between countries in SSA.8 Modern mapping embracing novel statistical techniques at high spatial and temporal resolution are increasingly being used to inform public health policy.9 10 Most recently, this has been aided by the availability of curated spatial databases, geographical information systems, enhanced computational capabilities and the advancement in spatial statistics. Standardised nationally representative survey initiatives, such as the geolocated Malaria Indicator Survey and the Demographic and Health Survey platforms, have availed geocoded malaria data with relevant covariates.11 12 This has enabled the characterisation of malaria risk at a high spatial resolution over which health policy is made.
Previous reviews have been conducted to; identify environmental risk factors of malaria transmission,11 13 summarise methodological and computational power advancement.12 Despite the increase in the number of malaria risk mapping studies, there are no recent and comprehensive reviews of the changes in methodological frameworks and covariates used. Consequently, we aimed to identify and review malaria risk mapping studies, to assess analytical methods and covariates used in the last five decades.
Methods
The protocol guiding this review has been previously published.14 Our results are reported according to the Preferred Reporting Items for Systematic Reviews and Meta-Analyses guidelines .15 16 A notable deviation from our protocol was limiting the review scope to SSA where the burden of malaria is highest and countries have broadly similar malaria vector and parasite ecologies and health system contexts, compared with low-income and middle-income countries.3 17 A rigorous three-phase process was undertaken to transparently identify and summarise spatio-temporal studies based on their methodical framework and covariates employed used in malaria risk mapping.
Phase 1: Identification of relevant studies/keyword search.
Search terms and databases
All studies published between 1 January 1968 and 30 April 2020 were systematically searched through four electronic databases (PubMed, Web of Science, EBSCOhost and Scopus) using search terms defined in online supplemental table 1. To improve the search strategy, thematically mined keywords were funnelled using Boolean operators and truncations before being employed across the selected electronic reference databases. The starting year (1968) corresponded to the year when the first global audit of malaria endemicity was undertaken.5 12 Relevant studies were imported into Endnote, version X9 (Clarivate Analytics, Philadelphia, Pennsylvania, USA) (online supplemental table 1).
Supplemental material
Phase 2: Study selection
Studies were screened independently by two authors JNO and CK for possible inclusion based on information provided in the title and abstract. Relevant studies based on the research questions were subsequently appraised on their eligibility for full-text review. The full-text review entailed the application of a more stringent inclusion/exclusion criteria for selecting studies to be included for data extraction. Additional papers were identified by examining the reference lists of retrieved studies and by contacting the authors where necessary. Emerging discrepancies were resolved by consensus and by an independent arbitrator (BS). A comprehensive and pilot tested form was used for data extraction.
Inclusion and exclusion criteria
Peer-reviewed studies that employed spatial, temporal and spatio-temporal modelling techniques in malaria risk mapping in SSA were considered. A spatial model was defined as one that explicitly included a geographical index, while a temporal model included a time index. Studies using at least one visualisation or modelling technique (with or without covariates) for assessing the burden of malaria were included. Commentaries, expert reviews and/or reports that did not include original research were read, and only relevant studies cited included.
Phase 3: Data extraction
A standardised extraction form was used to independently extract the data by two reviewers (JNO and CK). The tool was first piloted and refined accordingly. Discordance between the reviewers with respect to the information extracted was resolved by consensus and by consulting with an independent arbitrator (BS). For each selected study, the following information was extracted (online supplemental table 2) namely:
Supplemental material
Bibliographic information (Author, year, study setting and period, primary unit of analysis, spatial and temporal resolution).
Study objective(s)
Data aspects (data sources, malaria data, covariate type)
Analytical method (modelling approach(es), assumptions, cluster detection techniques, statistical tests, diagnostic/validation checks).
Results and discussions (key findings, modelling gaps, recommendation(s)).
Quality assessment
A previously used 8-point scoring criteria18 was adapted and modified to assess the quality of the individual studies based on their aims and objectives, input data, model validity, results and conclusions (online supplemental table 3). Screening questions/criterion were used to guide the scoring process, with the score ranging from 0 (poor) to 2 (good) on each criterion. The overall quality level assigned to individual studies were summarised into four broad categories; very high (>13), high (11–13), medium (8–10) and low (<8) (online supplemental table 3).
Supplemental material
Results
Literature search, data synthesis and quality assessment
A total of 7189 studies were retrieved from the various databases with 170 studies fully screened after the title and abstract review. Ultimately 107 studies were included for review and underwent quality assessment and synthesis (figure 1).

Study flow from literature search to data extraction and analyses.
The distribution of studies by geographical scale and scope varied across SSA. Five (5%) studies were continental in scale, 48 (45%) studies were national and 52 (49%) studies were subnational. Kenya (10 studies) and Tanzania (9 studies) had the highest number of publications included in the review (figure 2).
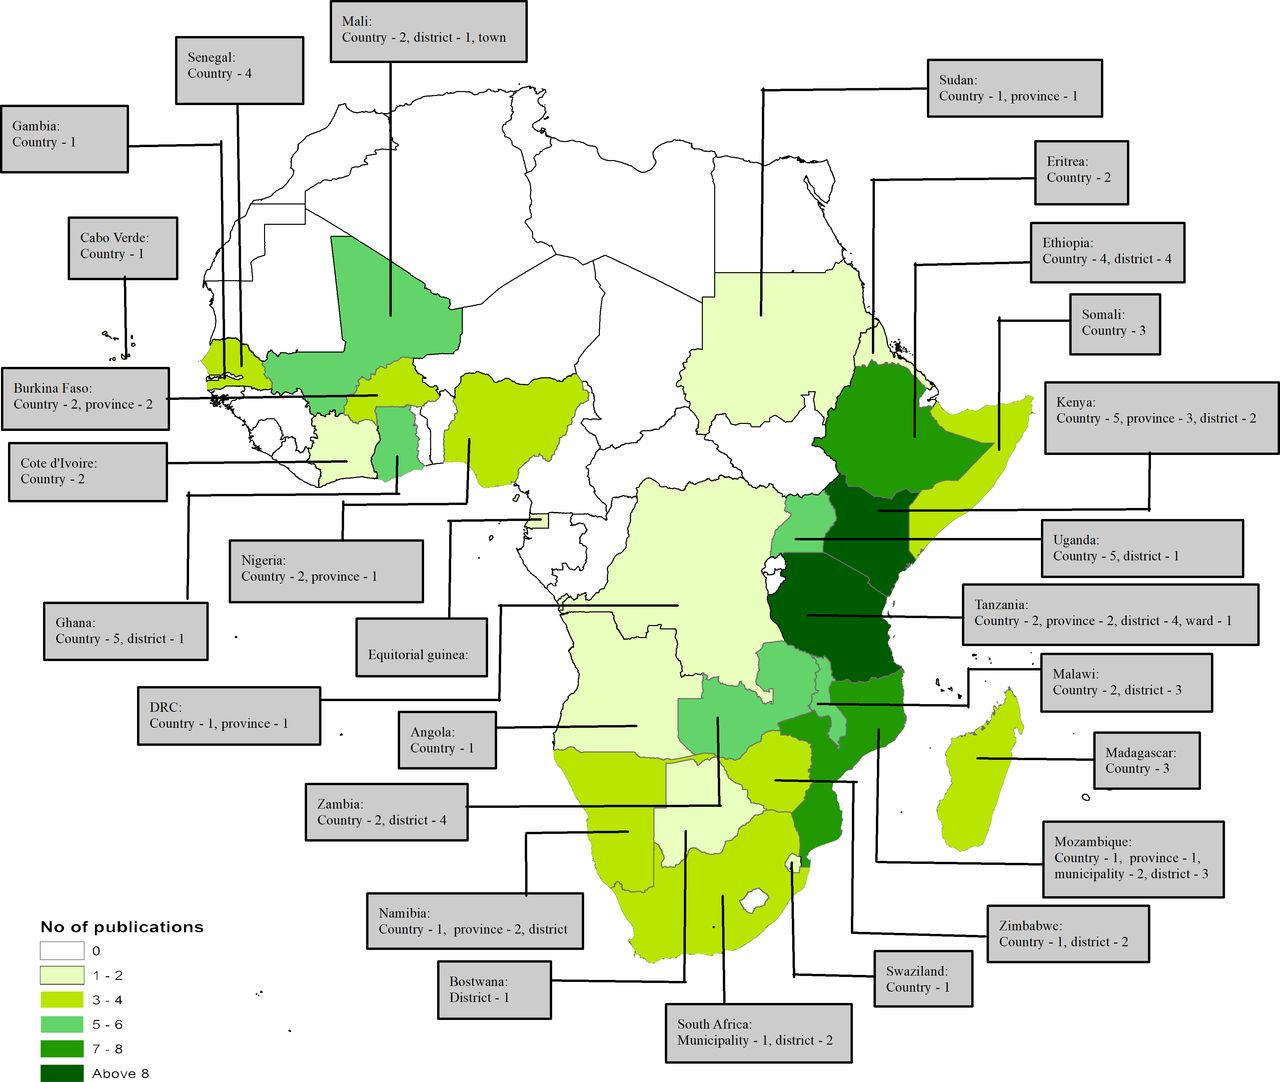
Geographical scale and scope of studies. Geographical scale (municipality, district, province/state, country) of studies is given in grey boxes. The studies covered 27 countries in sub-Saharan Africa with East Africa being the most represented subregion.
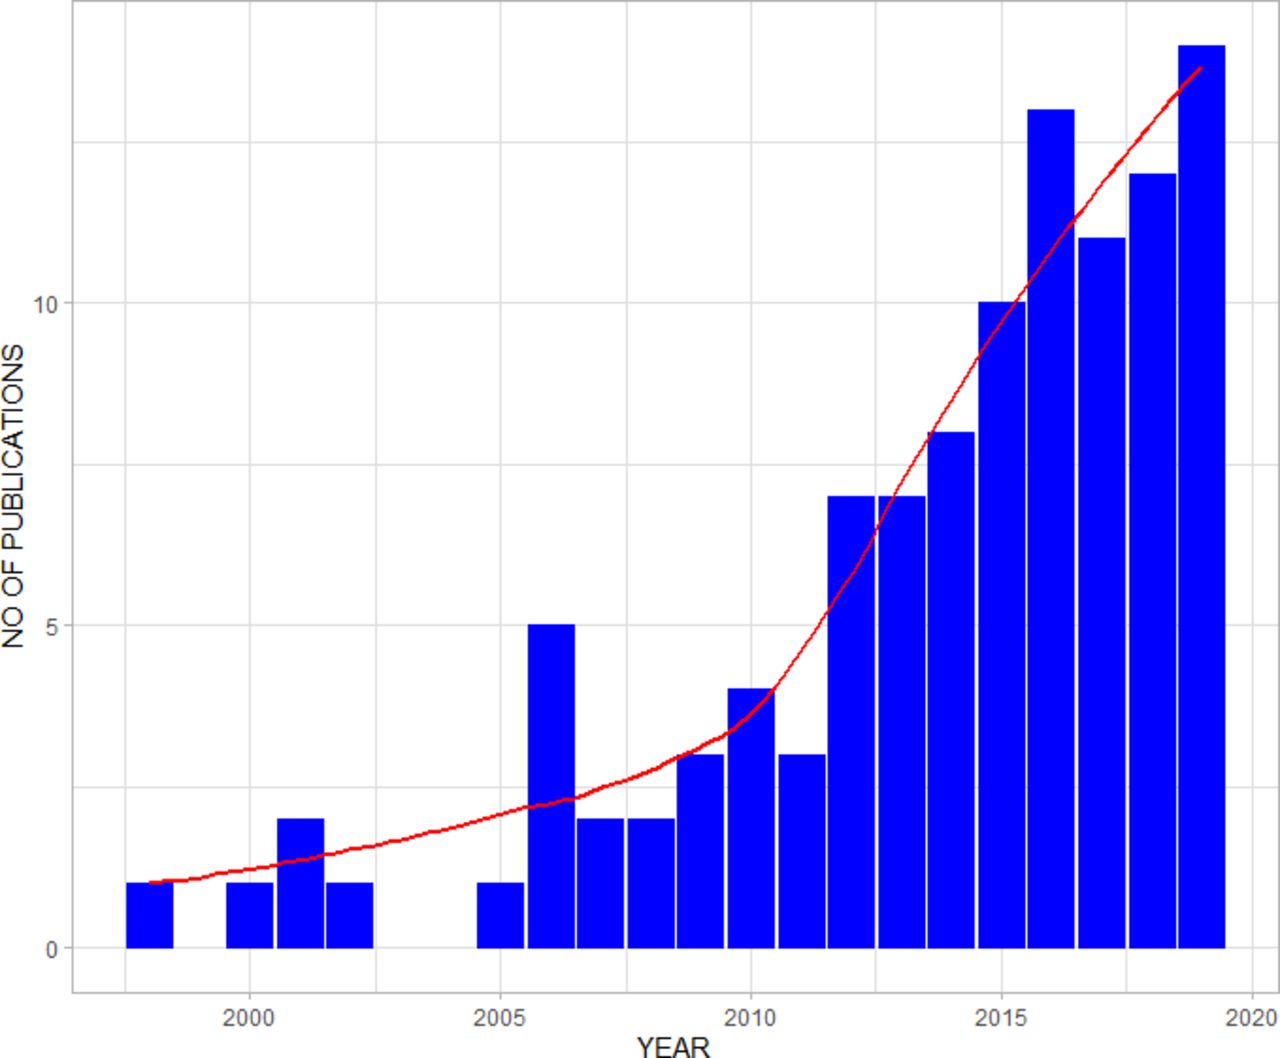
The longest study period spanned 115 years,19 while the shortest study period was 3 months.20 Fifty-eight (54%) studies had an overall study period ranging between 3 months and 5 years, while 21 (20%) studies had their study period ranging between 6 and 10 years and 28 (26%) studies spanned more than 10 years. Overall, the number of publications increased over the review period (figure 3).

Bar—chart with a trend line (red) showing the total number of included studies.
The median score was 12 out of 16, with 16 representing the highest possible quality. The overall quality score of the reviewed studies ranged from 7 to 16. Two studies were of low quality, 22 studies were of medium quality, 42 studies were of high quality and 41 studies were of very high quality (online supplemental table 3).
Data sources, covariate selection and preprocessing
From the review, global, continental, national and subnational databases/repositories provided a rich source of both malaria data and covariates used for modelling. These sources comprised of geographically referenced surveys used by 34 (32%) studies, 20 (19%) studies used population databases and 10 (9%) studies used government records. Routinely collected data from the Health and Demographic Surveillance System were used in 16 (15%) studies. Sources of climatic and environmental covariates consisted of ground station observations used by 17 (16%) studies and remotely sensed satellite surrogates of climate, urbanisation and topography were employed by 49 (46%) studies (table 1).
Data sources
In this review, variable selection techniques were explicitly specified by 47 (44%) studies. These techniques varied substantially; with the frequentist approach used in 14 (13%) studies to assess the (uni and multi) variate association between malaria outcomes and its covariates being the most common. Significant covariates were included if their nominal p value was less than 0.001,21–24 0.05,25–27 0.1,28 0.15,29 300.2.31 32 and 0.25.33 The generalised linear models used by nine (8%) studies identified the best covariate subset based on Wald’s p value20 32 34–36 and the variance inflation factor.37 Additionally, six (6%) studies used the total-sets analysis based on Bayesian information criterion (BIC) statistic to identify the optimal variable combination. Principal component analysis was employed by eight (8%) studies to reduce dimensions and avoid collinearities in environmental factors,38 39 meteorological factors38 40 and household demographics.32 33 41–43 The Bayesian stochastic search was used by three (3%) studies to identify covariates with the highest inclusion probability. Other techniques employed included the least absolute shrinkage and selection operator (LASSO) penalty, the Spike and slab and the Bayesian model averaging cumulatively used by five (5%) studies. Two studies (2%) reviewed covariates used in past studies to identify and adopt the best suite of covariates to be included in their model (table 2).
Analytical methods used in malaria risk mapping
Data preprocessing procedures were employed in 37 (35%) studies. The verification of geographical coordinates by either paper maps44 or global digital maps8 31 34 36 42 44–58 used in 20 (21%) studies was the most common procedure. Algorithms based on the catalytic conversion models8 36 46 48–50 55 59–61 were used in 10 (9%) studies to generate age-adjusted malaria prevalence predictions, that is, age range of 2–10 years. Continuous variables were standardised in seven (7%) studies; by log transformation,62 centring on the mean47 63–66 and zero.47 Four (4%) studies excluded study regions with inconsistent datasets8 19 67 68 while two (2%) studies used the average of its nearest values.69 70 Other approaches used included the multivariate stepwise regression,71 using data values extracted from previous surveys.32
Modelling covariates
The type and number of covariates included in malaria models varied across studies. Different categories encompassing climatic and environmental, sociodemographic and malaria intervention covariates were identified. The most common covariates in the environmental domain were rainfall and temperature used in 61 (57%) and 59 (55%) studies, respectively; while the most common sociodemographic covariates used in 12 (11%) studies were population size and age. Malaria interventions (insecticide-treated bed nets, indoor residual spraying and artemisinin-based combined therapy) used in 32 (30%) studies and transmission seasonality used in 28 (26%) studies were also common. Detailed variations and adaptations covariates are presented in table 3.
Covariates used in malaria risk mapping
Spatial, temporal and spatio-temporal methods
A variety of spatial, temporal and spatio-temporal methods were employed to visualise malaria risk patterns, explore spatial clusters and model risk across space and time in SSA. Measurement of malaria burden varied across studies with the type of outcome informing the modelling framework. The most common malaria metric used in models, was incidence used in 50 (47%) studies and prevalence used in 37 (35%) studies. Table 3 presents a summary of the malaria outcomes that were considered in the papers included in the review.
In settings of low malaria transmission, local and global spatial cluster detection methods were used in 31 (29%) studies to identify significant geographical variation in malaria risk patterns (table 2). These were the Kulldorf spatial scan statistic, Getis’ Gi*(d) local statistic; local Moran’s I statistic and the Global Moran’s I statistic. On the other hand, nine (8%) studies used temporal models to explore and forecast malaria risk at different temporal resolutions, with the autoregressive integrated moving average (ARIMA) model used in seven (6%) studies being the most common. Two studies (2%) used a univariate seasonal ARIMA model to explore malaria risk patterns (table 2).
The Bayesian spatial only and space-time kriging—a statistically unbiased and robust interpolation method appropriate for study settings with limited data; was used in five (6%) studies, to predict risk at unsampled locations,67 72 improve predictions in geographical areas with considerable variation between observed values and model predictions45 73 and model the spatial and temporal correlations of monthly malaria morbidity cases.62
Using point-referenced data sourced from multiple independent surveys, 27 (25%) studies applied both the model-based geostatistical (MBG) and Bayesian MBG methods to analyse, predict and map malaria risk. In this framework, the spatio-temporal dependency was modelled as a Gaussian process in fourteen (13%) studies.8 34 36 37 43 46 48–50 53 59 60 64 74 Spatial only random effects (dependency) were modelled via the Gaussian prior distribution26 27 29–31 41 63 65 75–78 in 12 (11%) studies. Temporal random effects were assigned a first order autoregressive AR (1) prior distribution in three (3%) studies37 75 79 and second order autoregressive AR(2) prior distribution8 in one (1%) study (table 4).
Structure of the spatio-temporal models
Using observations aggregated over distinct geographical region/spatial partitions/adjacent units (eg, census tract, administrative boundaries); 15 (14%) studies used the Bayesian conditional autoregressive (CAR) models, to explore the spatial and spatio-temporal variation of malaria risk. To account for the temporal dependency between consecutive time points; seven studies (6%) used the first order autoregressive AR (1) prior process, whereas one study (1%) used the random walk of order one RW (1) prior process (table 4).
Other models
Generalised linear modelling framework, such as the Poisson, logistic regression, negative binomial and geographically weighted regression, was used in fifteen studies (14%). These models explored the association of malaria counts or rates and its correlates, using appropriate exponential distribution families. Machine learning techniques such as the artificial neural network and the boosted regression tree were used to analyse incidence patterns and to examine malaria prevalence, respectively (table 4).
Model validation, performance and uncertainty
A range of different validation techniques were used to assess model fitness and to select the optimal predictive models. The most commonly used approach entailed partitioning the data for model training and validation and was employed in 24 (22%) studies. The training set was then used to validate the predictive model fit, whereas the validation set was used for assessing the model predictive ability. The representative holdout datasets were selected using a spatially and temporal declustered algorithm,8 48 49 59 stratified sampling approach75 and randomly.35 46 50 53 80 Information criteria, that is, the deviance information criterion, Akaike information criterion and the BIC were used in seventeen (16%) studies. Seven (7%) studies used variogram-based algorithms to identify estimates falling within the 95% credible interval. Model precision and accuracy metrics included the mean prediction error, root mean squared error, mean absolute prediction error, mean error and the SD (table 2).
Summarised modelling framework
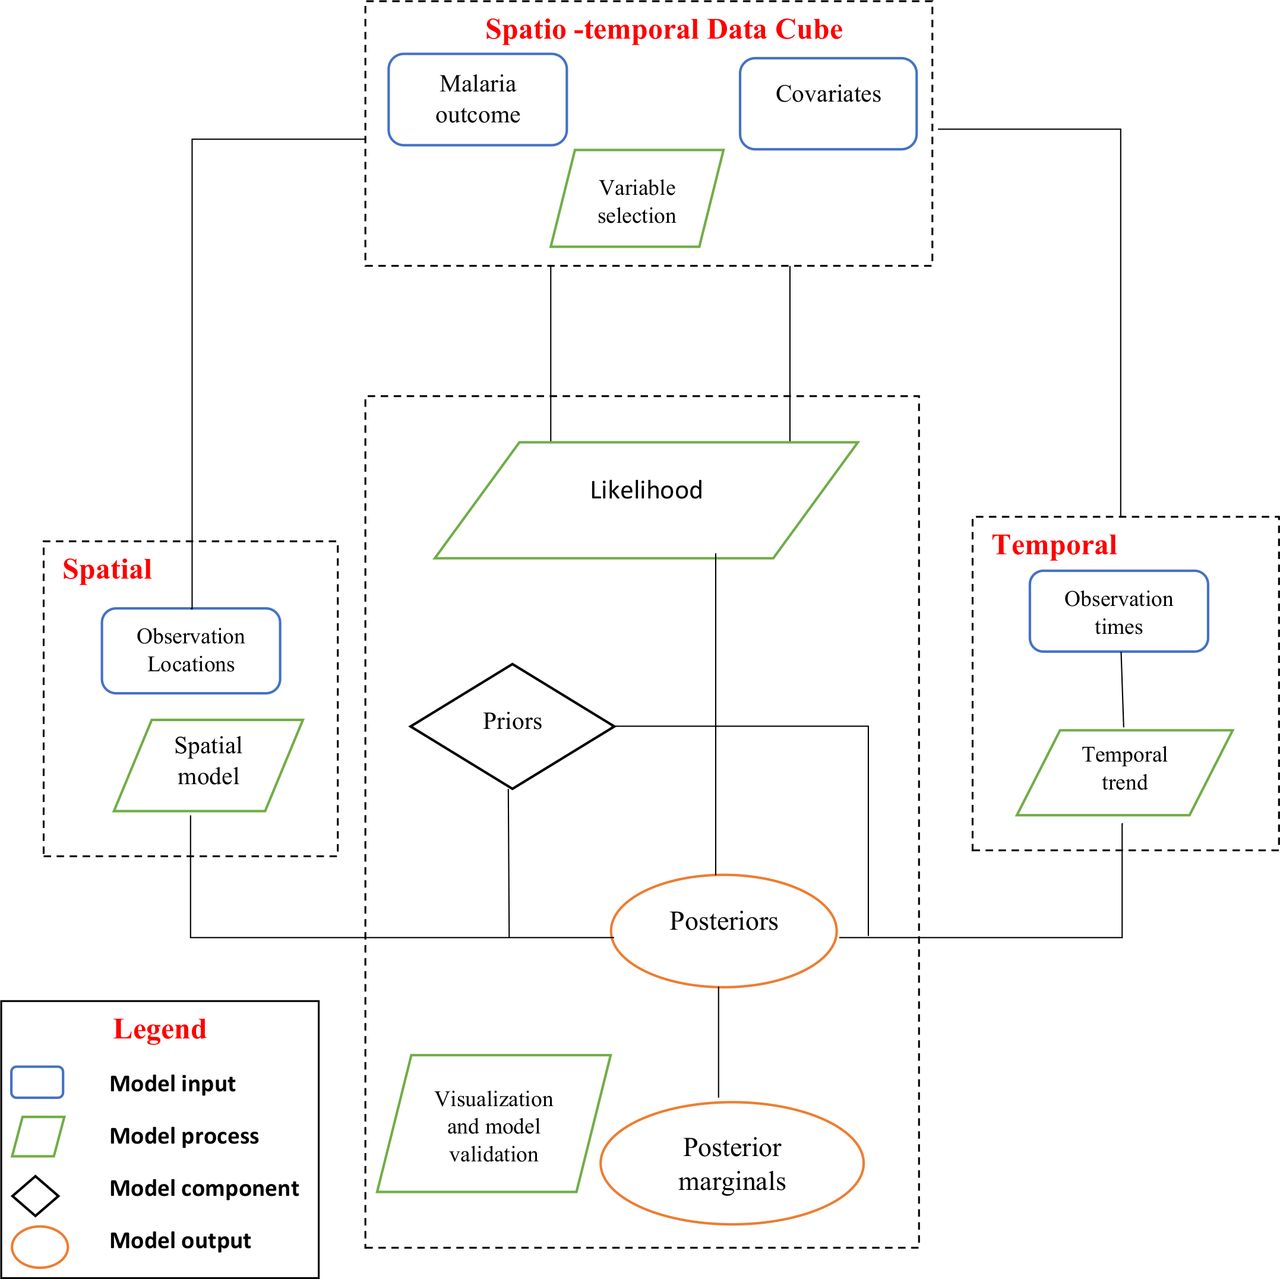
The rapid expansion of methods and data informs the need to guide future spatial and spatio-temporal modelling of infectious diseases in SSA (online supplemtal table 4). We illustrate a framework composed of four fundamental modelling entities, namely: inputs, process, stochastic components and output. Malaria data and covariates sourced from different spatial and temporal resolutions are considered to be the model inputs. A series of progressive and interdependent steps/processes on the model inputs are then used to generate the outputs (posterior marginals). Posterior marginals can then be approximated using iterative computational techniques such as the Markov Chain Monte Carlo methods or by using numerical integrations via the Integrated Nested Laplace Approximations method.81 82(figure 4)
Supplemental material

Schematic illustration of the spatio-temporal modelling framework for malaria risk in sub-Saharan Africa.
Discussion
Scalable guidelines for rigorous and transparent statistical methodology are necessary for reproducible malaria risk estimation. This review offers a comprehensive appraisal and synthesis of methods and covariates used in malaria risk mapping in SSA in the last five decades.
Sources of malaria data
High-resolution maps revealing the spatio-temporal variation of malaria endemicity are useful for estimating malaria burden, quantifying the effectiveness of control initiatives and assessing the progress towards its elimination nationally and subnationally. However, malaria risk mapping efforts in SSA are rarely based on routinely collected data. Instead, periodic and costly household survey’s data have traditionally been used in modelling malaria risk. To address this challenge and obtain robust estimates reflective of the subnational burden, WHO initiated the high burden to high impact approach in 2018, which underscored the need for reliable national data systems. This is considered central to the understanding of malaria burden in low transmission settings and in the most vulnerable populations.3 Additionally, the approach has availed more malaria data in malaria-endemic settings, and caution is needed when gathering and interpreting findings generated from data at fine spatial and/or temporal scales with varying degree of completeness and representativeness.83
The steady growth of satellite, remote sensing platforms and curated databases has made available a rich suite of both environmental and socioeconomic covariates at a finer level of detail useful for mapping malaria risk at high spatial and temporal resolution. Validating the quality of available satellite data prior to their inclusion in malaria studies remains central to achieving robust estimates.
While malaria incidence and prevalence metrics can be modelled from routine health information systems and sample surveys respectively, caution should be taken when interpreting estimates as both metrics are products of interacting factors such as interventions, sociodemographic and environmental factors that may contribute to the overall risk. A concise picture may be achieved by measuring malaria indicators at a finer spatial scale and exploring the nature and scope of the interaction. Data on malaria mortality as an outcome were sparse, and efforts must be made to increase data collection and improve the sensitivity and specificity of malaria mortality burden attribution in SSA.74 83As many countries in SSA transition epidemiologically from high to low malaria transmission zones, obtaining useful metrics for mapping risk from sparse national surveys at low, moderate and heterogeneous transmission settings possess unique challenges for measuring progress and impact.84
The paucity of continuous, reliable data necessary to yield estimates with greater geographical and temporal richness is a growing concern in the era of evidence-based public health. A high-quality, routinely collected data avail an alternative source of malaria metrics for continuous analysis over time.83 Investments should be channelled towards establishing and addressing inadequacies in the health information systems to enable subnational mapping of malaria risk. However, the urge for quality data and the increasing need of accurate estimates can significantly be improved by adoption of data-driven modelling approaches that leverage both routine and household survey data in their model framework.85 Additionally, detailed information on critical data sources, preliminary data adjustments undertaken before modelling should be availed as an important step towards enhancing reproducibility of methods and estimates.86
Understanding covariates used in mapping malaria risk
Improving the precision of malaria risk estimates largely depends on limiting subjective decisions. These decisions may impact on the modelling process, even as more covariates becomes accessible at finer geographical and temporal resolutions. Studies have shown large variables to be desirable for prediction, whereas small sets of variables to be meaningful for inference.87 It is important to understand the complex relationship between covariates at the same spatial or temporal resolution, to avoid overfitting. The trade-off between model interpretability, predictive ability, spatial and temporal scope, data accessibility and computational limitations are critical factors worth considering when selecting candidate covariates. Evidentially variable selection is an important preliminary step for a robust malaria risk mapping exercise. However, this approach continues to receive little attention amidst the growing diversity of covariate layers that need to be identified and included in the models.
Environmental and climatic factors influence mosquito vector abundance, distribution and longevity; at different time scales88 and are important for mapping malaria risk.59 A scoping review by Zinszer et al 89 highlighted the importance of climatic-related predictors in malaria risk prediction. Understanding the different facets and extent of how climatic influences on malaria risk variation; has been enhanced by advances in remote sensing and satellite imagery technology, increasing the availability of remotely sensed climatic data at high spatial resolution.35 In this review proxies of; temperature (land surface temperature, temperature suitability index, mean/min/max/weekly) and rainfall/precipitation (weekly/monthly/annual) were the most widely used environmental factors related to malaria transmission in SSA. Vegetative indices such as elevation, surface moisture, land use and land cover were included in malaria risk maps, primarily due to their association with temperature and precipitation which indirectly influences90 the distribution of malaria. Remote sensing will continue to feature prominently as a cost-effective tool for mapping malaria risk in SSA and an important source of environmental and climatic covariates.91 The review further demonstrates the significance of non-climatic determinants such as malaria interventions and demographic factors in malaria risk mapping.
Modelling frameworks in malaria risk mapping
Complex decisions involving key modelling components such as covariates to include, preliminary data preprocessing and diagnostics checks demands advanced statistical knowledge. Extensive computational algorithms and complex spatio-temporal data structures may limit the applicability of these modelling approaches to experts. Furthermore, complex models used to represent malaria heterogeneity may not necessarily represent the truth on the ground. Thus, the statistical uncertainties around model estimates should be carefully examined, and the varying quantities and quality malaria data, that informs modelling approaches accounted for.
The review highlights the prominence and flexibility of geostatistical methods in modelling spatial and spatio-temporal malaria patterns, at policy-relevant units and thresholds.46 Geostatistical methods provide a useful framework for interpolating imperfect data from multiple independent surveys by estimating spatial dependence from the data. At low spatial resolution, the Bayesian geostatistical framework accounts for uncertainty resulting from sparsely sampled point-referenced data by assigning priors that allows ‘borrowing of strength’ from adjacent regions leading to robust estimates and predictions.92 Amidst the current scarcity and imperfections of routine, high resolution and spatially expansive malaria data in many SSA countries, using geostatistical methods with data from multiple independent georeferenced surveys, continues to be important for generating reliable estimates.
Bayesian hierarchical CAR models are useful for modelling spatially correlated areal data by smoothing noisy estimates and leveraging information from adjacent regions. However, choosing an appropriate prior specification for the parameters defining the spatial interaction is inevitable and sometimes challenging. Notably, the spatial dependence among neighbouring regions is accounted for by assuming a CAR process in the random effects. For example, in the Besag York and Mollie/convolution model, location-specific spatial effects are assumed to follow a normal distribution with the mean equal to the average of its neighbours and the variance considered to be inversely proportional to the number of neighbours. In the Leroux et al model, the spatial dependence is based on the weighted average of both the independent random effects and spatially structured random effects.93 94 The intrinsic CAR and Besag, York and Mollie (BYM) were the most frequent global spatial smoothing specifications used in the review; given their easy implementation in a range of softwares. However, caution should be taken to minimise over smoothing—obscuring the underlying geographical patterns. Future modelling studies should compare the impact of using other spatial smoothing priors.
Overall, malaria risk mapping has increased dramatically over the last decades, with novel methods advanced to meet the quest for accurate estimates of malaria burden. Whereas most approaches are built on classical statistical methods, recent advances in computing, availability of geographically referenced data have ushered/propagated new techniques designed to address existing challenges. These approaches include ensemble modelling, neural networks, simulation-based methods and bootstrap models to better capture space-time interactions.
Recommendations for best practices
As malaria landscape diversifies in the next decade, investments in primary data collection at subnational scales, development and continuous application of robust modelling tools will continue to be important priorities in malaria control and elimination efforts. In the era of open data policy and reproducible research, our review reiterates the importance of periodically reviewing, validating and updating malaria maps to accommodate new data sources, improved data quality, enhanced computing power and novel methodological approaches. Variable selection procedures should be data driven and objectively developed to the maximise the predictive accuracy of malaria risk mapping. The spatio-temporal modelling framework should incorporate practical challenges facing control and elimination of malaria in SSA. These challenges are: human migration within and among endemic zones, mapping asymptotic infection reservoirs and accounting for differential immunity within a population.95 96
Strengths and limitations
The review search strategy was exhaustive and transparent, in accordance with the current methodological guidelines and included studies have provided a fair depiction of malaria risk mapping efforts in SSA. The methodological approach of the included studies was diverse, making meta-analysis inappropriate. The review considered only studies published in English and relevant papers published in other languages might have been excluded.
Conclusions
Malaria risk mapping remains an important component for understanding the burden of malaria in SSA. The review has described modelling approaches and examined covariates used in mapping malaria risk in different epidemiological contexts. As malaria transmission continues to decline in SSA, the use of metrics that accurately describes changes in its transmission intensity across space and time will be important for the design and implementation of evidence-based control and elimination measures.
Acknowledgments
The authors thank the College of Health Sciences, systematic review services and library services at the University of KwaZulu-Natal for providing training and resources at the initial phases of the review.
References
Footnotes
Handling editor Alberto L Garcia-Basteiro
Twitter @Pete_M_M
Contributors JNO, BS and RWS conceived and designed the systematic review. JNO, BS and CK conducted the literature search, study selection and data extraction. JNO wrote the first draft of the manuscript with assistance from CK and BS. PMM and RWS revised the draft critically for important intellectual content. All authors read and approved the final version of the manuscript.
Funding JNO acknowledges support from the University of KwaZulu Natal, College of Health Sciences postgraduate scholarship scheme. RWS is supported as a Wellcome Trust Principal Fellow (#103602 and 212176) that also supported PMM. PMM acknowledges support for his PhD under the IDeALs Project part of the DELTAS Africa Initiative (DEL-15-003). The DELTAS Africa Initiative is an independent funding scheme of the African Academy of Sciences (AAS)'s Alliance for Accelerating Excellence in Science in Africa and supported by the New Partnership for Africa's Development Planning and Coordinating Agency with funding from the Wellcome Trust (107769) and the UK government. RWS and PMM are grateful to the support of the Wellcome Trust to the Kenya Major Overseas Programme (203077).
Competing interests None declared.
Patient and public involvement Patients and/or the public were not involved in the design, or conduct, or reporting, or dissemination plans of this research.
Patient consent for publication Not required.
Provenance and peer review Not commissioned; externally peer reviewed.
Data availability statement All data relevant to the study are included in the article or uploaded as online supplemental information. The data supporting conclusions made in this review are available in the detailed reference list.