Article Text

Abstract
Introduction The identification of spatial–temporal clusters of forced migrant mortality is urgently needed to inform preventative policies and humanitarian response. As a first step towards understanding the geography of forced migrant mortality, this study investigates spatial–temporal patterns in death at a global scale.
Methods We used information on the location and dates of forced migrant deaths reported in the International Organization for Migration’s Missing Migrant Project from 2014 to 2018. Kulldorff’s spatial–temporal and seasonal scans were used to detect spatial–temporal and temporal heterogeneity in mortality.
Results A total of 16 314 deaths were reported during the study period. A preponderance of deaths occurred at sea each year (range 26%–54% across 5 years). Twelve spatial–temporal clusters of forced migrant mortality were detected by maximum likelihood testing. Annually, the period of August–October was associated with a 40-percentage-point increase in the risk of mortality, relative to other time periods.
Conclusions Death during forced migration occurs close to national borders and during periods of intense conflict. This evidence may inform the design of policies and targeting of interventions to prevent forced migration-related deaths.
- epidemiology
- health policy
- prevention strategies
- public Health
This is an open access article distributed in accordance with the Creative Commons Attribution Non Commercial (CC BY-NC 4.0) license, which permits others to distribute, remix, adapt, build upon this work non-commercially, and license their derivative works on different terms, provided the original work is properly cited, appropriate credit is given, any changes made indicated, and the use is non-commercial. See: http://creativecommons.org/licenses/by-nc/4.0/.
Statistics from Altmetric.com
Key questions
What is already known?
Forced migrants encounter myriad dangers on their journeys to safer destinations.
Criminalisation of irregular entry, temperature and weather patterns and difficult terrain are known risk factors along migration routes.
What are the new findings?
This is the first analysis of forced migrant mortality at a global scale—highlighting spatial–temporal patterns of risk as forced migrants cross state borders.
Twelve spatial–temporal clusters of forced migrant mortality, in which the observed number of deaths statistically exceeded the annual mean number of deaths per area, were identified.
The period of August–October was associated with a 40-percentage-point increase in the risk of mortality, relative to other time periods.
What do the new findings imply?
Forced migrant deaths do not occur at random but instead are clustered in spatial–temporal patterns.
Clusters of forced migrant mortality occur proximate to borders and intense conflict, which may inform targeted monitoring and prevention activities.
Introduction
The number of forcibly displaced individuals, including refugees, internally displaced persons and asylum seekers, reached a record high of nearly 80 million worldwide at the end of 2019.1 Forced migration—or mobility stemming from conditions precluding a reasonable life2—is expected to continue to increase due to the changing nature of conflict and the compounding effects of climate change.3 4 International human rights law and treaties protect the rights of asylum seekers;5 6 however, there are insufficient global governance mechanisms to enforce state accountability—particularly in border7 and transit states,8 as well as at sea,9 resulting in the unacceptable loss of lives.
The transit phase of forced migration is a period of exceptionally high morbidity10 and mortality.11 12 Place-level risk factors for forced migrant mortality include drivers of migration, such as conflict and climate change, as well as the terrain, temperatures and weather encountered in transit.13 14 Moreover, evidence suggests that the increasing criminalisation of irregular entry has cost many lives as forced migrants seek to move clandestinely, employ smugglers and move along treacherous routes.15–20
The risk of death during forced migration is thus spatially and temporally heterogeneous, and transboundary by nature.21 22 The identification of high-risk geographies and time periods for forced migrant mortality may enable policy-makers to target interventions mitigating place-level risks. Spatial–temporal analyses have been effectively integrated into surveillance and response systems for health outcomes with geographically heterogeneous risk factors such as malaria23 and childhood diarrhoea,24 among other conditions.25 Evidence-informed decision making on immigration and health is inherently political, and data alone do not necessarily lead to better outcomes for forced migrants.24 Nonetheless, deaths in transit are often preventable by interventions such as the humanitarian monitoring of dangerous routes and the deployment of search-and-rescue teams to locate lost or injured individuals.26 Spatial–temporal evidence of clusters of death may be used to drive the political will necessary to enhance the transparency and accountability of global governance relevant to forced migrants.27 28
Understanding spatial–temporal trends in forced migrant mortality is an important first step in the timely response to place-level risk factors and the commensurate allocation of resources. To the best of our knowledge, this is the first study to investigate the recent spatial–temporal dynamics of forced migrant mortality at a global scale.
Methods
Data sources
Forced migrant mortality
Since 2014, the International Organization for Migration has maintained the Missing Migrants Project, the only database that collects information on forced migrant deaths worldwide.29 The database tracks the deaths of forced migrants, including refugees and asylum-seekers, who have died in the process of migration towards an international destination. The Missing Migrants Project is a ‘case-based’ database, meaning that each entry represents a single occurrence in which an individual or group of individuals died during forced migration.29 Deaths occurring in detention facilities and during or after deportation are not included in this database.
The database sources comprise data received from survivors at landing points, data compiled from medical examiners and media and government reports. For each case, the database includes an event identification number, date of reporting (day, month and year), information on the location where forced migrant remains were recovered (ie, geographical coordinates, region and Frontex migration route name), cause of death, a Likert quality rating based on the data source and a link to the primary data source.
The temporal scope of this analysis includes the years 2014–2018. Due to incomplete documentation of forced migrant remains, the number of reported deaths is estimated to represent a mere one-third of all deaths.30 However, at present, this database is the most comprehensive source of information about the global scope of forced migrant mortality. The Missing Migrants Project database is publicly available via a Creative Commons Attribution for Intergovernmental Organisations license, and is indexed on the Centre for Humanitarian Data’s website.31
Administrative boundaries
Shapefiles storing the attribute information of geographic features including administrative boundaries and maritime sovereignties were obtained from Natural Earth.32 Administrative boundaries represent geographic areas of jurisdiction. Under this definition, disputed territories are classified with the administering territory.
Patient and public involvement
The database used in the study was developed with patient and public involvement. We have engaged with the public, including humanitarian operational partners, on the dissemination of the results.
Spatial analysis
The Missing Migrants Project database, containing the latitude and longitude coordinates of forced migrant deaths, was imported into a geographic information system mapping and analysis software (ArcGIS V.10.6)33 to create a map layer displaying the location of deaths as points. The point map layer of forced migrant deaths was spatially joined to the administrative boundaries shapefiles to prepare the data for summary statistics and spatial investigation with SatScan, a free software for the statistical analysis of spatial, temporal and space–time data.34
First, the combined data set was used to describe the occurrence of deaths per country by year, visualised as points within administrative boundaries. The primary analysis included land administrative boundaries, with deaths at sea categorised as ‘open water’.
Second, spatial–temporal autocorrelation, or the distribution of forced migrant deaths in space and time, was analysed using the Kulldorff spatial–temporal scan statistic, available in SatScan.34 The Kulldorff spatial–temporal scan statistic tests for clusters in space and time by determining the independence of each multidimensional point process.35 Specifically, the Kulldorff spatial–temporal scan statistic imposes a cylinder around each point; the base of the cylinder varies across the area being searched, while the height of the cylinder varies across each year of the study period. The estimated number of cases for a given cylinder is compared with the expected value, or the global mean number of cases relative to the cylinder area, using maximum likelihood testing and adjusting for the multiple testing of cluster locations, reported as the likelihood ratio (LR).25 Thus, it is possible for clusters to overlap in the same spatial location in multiple years. The null hypothesis tested by the Kulldorff spatial–temporal scan statistic is a geographically homogeneous distribution of deaths. Rejection of this null hypothesis suggests that the observed patterns of forced migrant fatalities differ from the spatial–temporal distribution in the null model. Output from SatScan, including the coordinates and radii of detected clusters, were uploaded to ArcGIS for visualisation.
Finally, the Kulldorff seasonal scan statistic36 was used to identify time periods (months) with an increased risk of mortality globally. The seasonal scan statistic ignores the year and treats time as a loop, allowing for the detection of recurrent temporal patterns.
Results
A total of 16 314 forced migrant deaths were reported from 1 January 2014 to 31 December 2018. The total number of reported deaths by country and the geographic location of each event corresponding to one or more deaths are presented in figure 1. Because deaths often occurred in large events, some counties have fewer event points and yet are the location of a large total number of deaths.

Countries and locations of forced migrant mortality per year (2014–2018).
The top five locations in which most deaths occurred each year are presented in table 1. For every year in the study period, the greatest proportion of deaths occurred in open water (range 26%–54% across 5 years). The USA was the only country included in the top five locations of forced migrant mortality in all years studied.
Top five locations of forced migrant mortality per year (2014–2018)
Twelve spatial–temporal clusters of forced migrant deaths were identified, often located along irregular migration routes and proximate to national borders (figure 2).
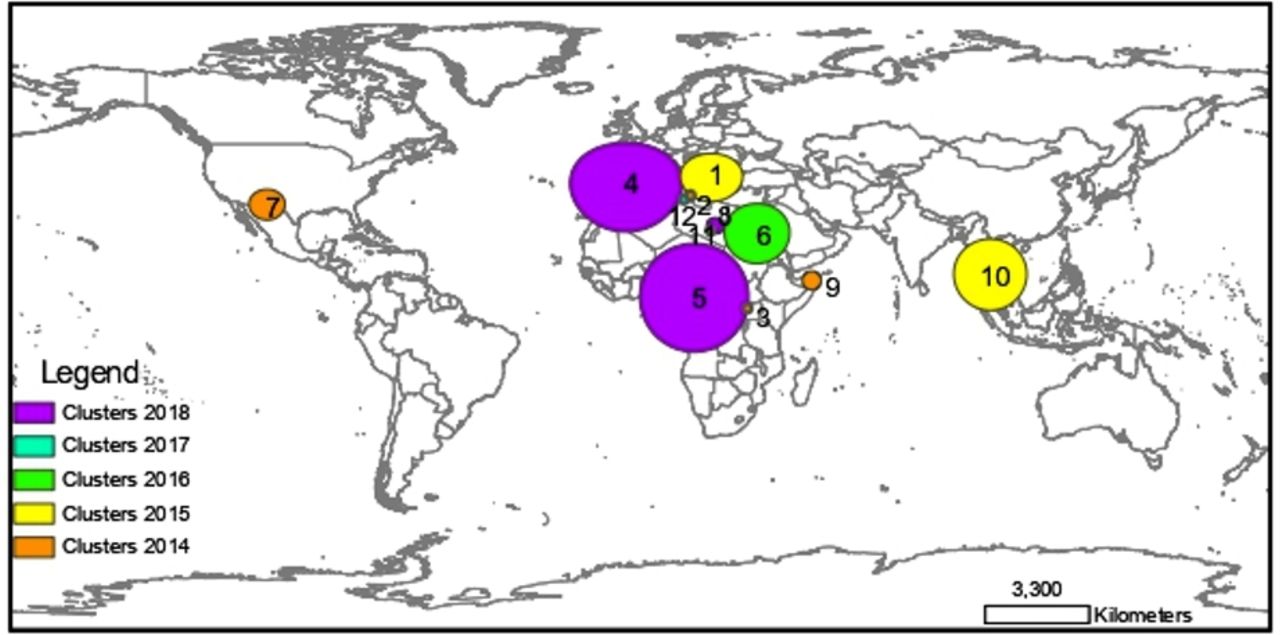
Spatial–temporal clusters of forced migrant mortality, 2014–2018.
These clusters depict the space–time points in which the observed numbers of deaths were statistically higher than expected during the 5-year study period. Details about the clusters are presented in table 2, linked to figure 2 by cluster number and ordered according to the LR.
Spatial–temporal clusters of migrant mortality, 2014–2018
Two clusters, in 2014 and 2016, represent single events with a high number of deaths (and thus, radii of ‘0’). The number of cases represented in each cluster ranges from 134 to 1560 deaths.
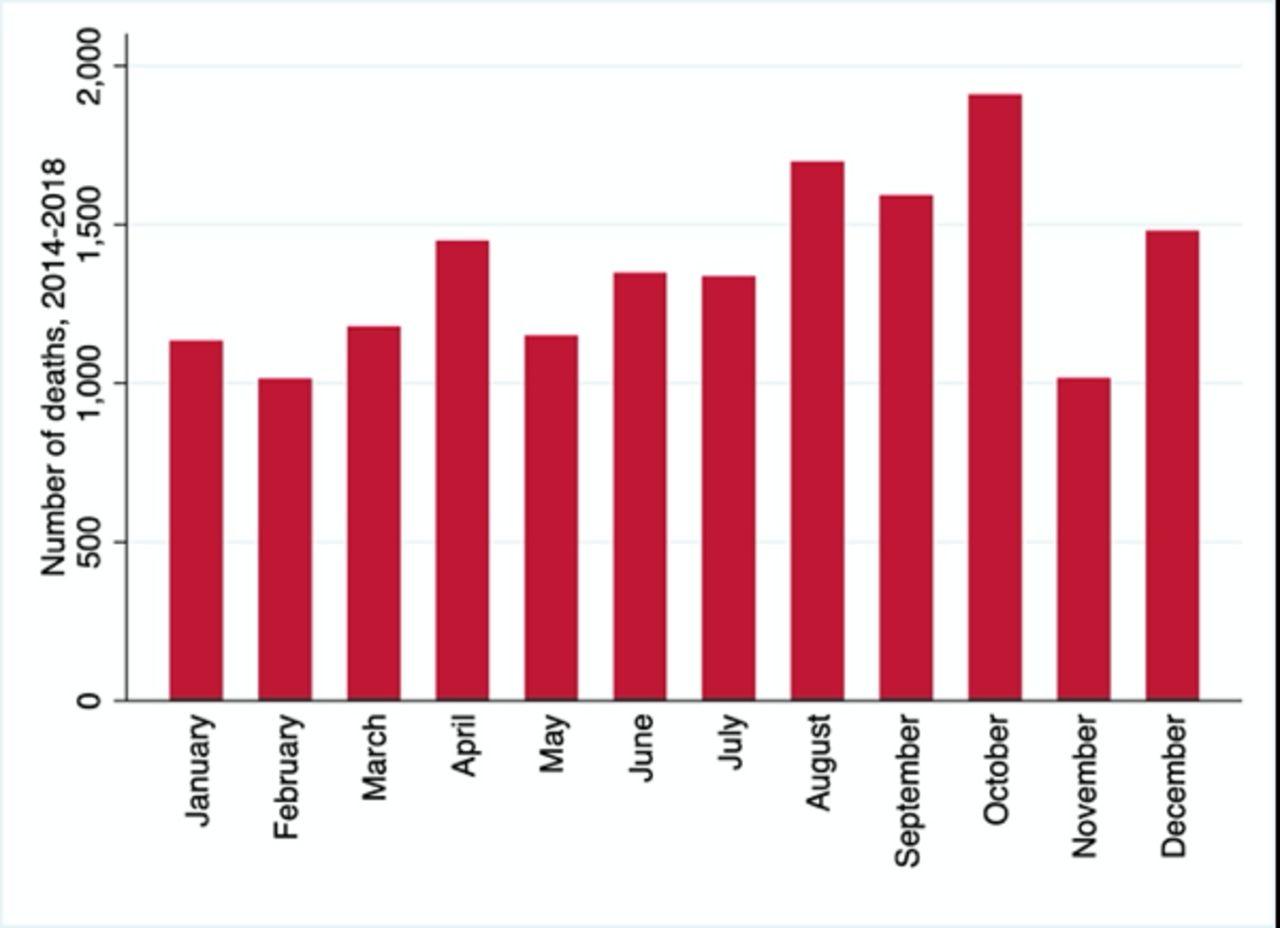
Global temporal trends in absolute deaths are presented in figure 3. Forced migrants experienced a 40-percentage-point increase in the risk of a mortality event relative to the mean temporal risk from 1 August to 31 October (p<0.001).
Total number of forced migrant deaths by month, 2014–2018.
Discussion
In this study, spatial–temporal clusters of forced migrant mortality were identified using Kulldorff’s spatial–temporal statistic. To the best of our knowledge, no other similar study has examined the place and time heterogeneity of forced migrant mortality at a global scale. Between 2014 and 2018, 12 high-risk clusters occurred, in which the number of high counts of observed deaths is unlikely to be by chance. Additionally, most deaths occurred at sea, with the US ranking among the top five land locations of deaths each year, and Libya and Mexico both in the top five locations of deaths for 4 years during the study period. A global temporal trend in forced migrant mortality was also observed, with the greatest risk of death occurring annually from August through October. The presence of spatial–temporal autocorrelation in forced migrant mortality indicates critical hotspots of a humanitarian emergency on a global scale.
In 2014, the clusters appeared at the US–Mexico border (cluster 7), which saw an influx in asylum seekers (particularly women and girls fleeing violence), as well as in Somalia (cluster 9), where Al Shabab attacks may have led to increased attempts at forced migration. There was also a small cluster off the coast of Libya (cluster 2), coinciding with the start of the Libyan war. Finally, an additional cluster capturing a large loss of life in a single event occurred in Lake Albert, at the border of the Democratic Republic of the Congo and Uganda (cluster 3). The cluster over Myanmar in 2015 (cluster 10) is likely a product of the Rohingya crisis, while a cluster also covers the Mediterranean (cluster 1), marking the start of the period of forced migration sometimes referred to as the European Migration Crisis. In 2016, a cluster was observed over Sudan (cluster 6), when a spike in conflict intensity may have led to more attempts at migration resulting in death, in addition to a small cluster in the Kufra District of Libya (cluster 11). A small cluster off the coast of Libya and Tunisia was identified in 2017 (cluster 12). In 2018, large clusters were observed in central Africa, north through Chad, as well as western Europe, the Mediterranean and Morocco (clusters 4, 5 and 8, respectively).
Of note, the spatial–temporal clusters did not overlap. Instead, each cluster appears to correspond to geographical areas and times experiencing heightened conflict and known increases in forced migration. Better data on the numbers and routes of forced migrants are needed to disentangle whether clusters indicate true increases in mortality risk or increases in forced migrants along particular routes.
There are several possible explanations for the observed increase in the annual risk of death from August to October. First, the peak could be explained by an increase in attempts at forced migration during those months. Second, the temporal trend may reflect increasingly hazardous migration routes at that time of the year. The majority of reported deaths occurred in the Tropics, Subtropics and Southern Temperate zones, which experience warmer temperatures during this time period. Previous studies have demonstrated that climate factors significantly affect seasonal forced migrant mortality at the US–Mexico border, with more cases observed during periods of high temperature.15 This exploratory analysis highlights the importance of investigating seasonality as a driver of forced migrant mortality in future research.
This retrospective analysis demonstrates the feasibility of applying the Kulldorff spatial–temporal scan statistic to case-based migrant death data. This method could be applied in real-time to identify clusters (and changes in cluster locations) of forced migrant mortality, ultimately allowing for the direction of resources for prevention of mortality. Additionally, the observed spatial–temporal heterogeneity implies that factors increasing the risk of forced migrant mortality vary over space and time. Most obviously, this includes national immigration policy, which is often not enforced consistently until a migrant is ashore. Improved individual-level data, such as the identification of the deceased, combined with structural-level data comprising immigration policies such as that synthesised by MIGREUOPE,37 may identify risk factors for forced migrant mortality in addition to upholding international legal obligations.38–41
Limitations
The major strength of this study is that it is the first statistical analysis of the clustering of forced migrant mortality on a global scale. This study has some limitations. First, the analysis is subject to information bias, as reports on the cases of forced migrant deaths are incomplete. We hypothesise that observations are not missing at random—for example, events of an individual death may be less likely to be detected compared with events including multiple deaths due to scale. Nonetheless, the Missing Migrants Project database represents the most complete documentation of mortality among forced migrants in transit, a marginalised population with little available data.42 Second, we do not have information on the total number of forced migrants and their routes, and thus we are not able to assess the relative magnitude of the reported deaths and to calculate mortality rates. Finally, this analysis did not attempt to identify local risk factors, such as intergovernmental and national immigration policies both at land and at sea, which are expected to affect the degree to which forced migrant routes are hazardous.
Implications for policy and practice
Findings presented in this paper may be of use to organisations leading the response to the increasing number of forced migrants worldwide in several ways: (1) the identification of clusters of forced migrant deaths can be used to estimate the effects of events, such as flares in conflict and immigration policy, on forced migrant mortality, (2) prevention efforts, such as border monitoring for safety, may be most effective during the season identified as having the highest occurrence of mortality and finally (3) these results may provide a foundation for prospective monitoring of forced migrant mortality, including advocacy for improved data including reporting on age, gender and country of origin.43 Results of this study may inform retrospective analyses examining the local ‘push’ and ‘pull’ factors associated with the observed clusters of forced migrant mortality to further tailor interventions to the local risk environment.
Conclusions
Forced migrant deaths do not occur at random but instead are characterised by spatial, temporal and spatial–temporal patterns. Hazardous seas and border terrain, as well as proximity to conflict, increase the risk of mortality along the routes of forced migrants. Spatial–temporal analysis in prospective evaluations of real-time, case-based data may identify locations where forced migrant mortality is clustering, thus improving monitoring and prevention activities.
Acknowledgments
We thank Dr Jonathan Chipman and the faculty of the Department of Geography at Dartmouth College who offered valuable comments on this manuscript. We are grateful to the William H. Neukom Institute of Computational Science, Dartmouth College, for supporting this research.
References
Footnotes
Handling editor Valery Ridde
Twitter @daninpoole, @marciacastrorj
Contributors DNP conceptualised the study, and designed and conducted the analyses with additional input from MCC. All authors contributed to the interpretation of results. DNP drafted the full manuscript; all authors edited the manuscript. All authors approved the final version of the manuscript.
Funding The authors have not declared a specific grant for this research from any funding agency in the public, commercial or not-for-profit sectors.
Disclaimer The content of this publication is solely the responsibility of the authors.
Competing interests None declared.
Patient and public involvement Patients and/or the public were involved in the design, or conduct, or reporting or dissemination plans of this research. Refer to the Methods section for further details.
Patient consent for publication Not required.
Provenance and peer review Not commissioned; externally peer reviewed.
Data availability statement Data are available in a public, open access repository. The data that support the findings of this study are openly available from the International Organization for Migration’s Missing Migrants Project,https://missingmigrants.iom.int/