Article Text

Abstract
Introduction Progress towards effective service coverage and financial protection—the two dimensions of Universal Health Coverage (UHC)—has been limited in Kenya in the last decade. The government of Kenya has embarked on a highly ambitious reform programme currently being piloted in four Kenyan counties and aiming at national rollout by 2022. This study provides an updated assessment of the performance of the Kenyan health system in terms of financial protection allowing to monitor trends over time. In light of the UHC initiative, the study provides a baseline to assess the impact of the UHC pilot programme and inform scale-up plans. It also investigates household characteristics associated with catastrophic payments.
Methods Using data from the Kenya Household Health Expenditure and Utilization Survey (KHHEUS) 2018, we investigated the incidence and intensity of catastrophic and impoverishing health expenditure. We used a logistic regression analysis to assess households’ characteristics associated with the probability of incurring catastrophic health expenditures.
Results The results show that the incidence of catastrophic payments is more severe for the poorest households and in the rural areas and mainly due to outpatient services. Results for the impoverishing effect suggest that after accounting for out-of-pocket(OOP) payments, the proportion of poor people increases by 2.2 percentage points in both rural and urban areas. Thus, between 1 and 1.1 million individuals are pushed into poverty due to OOP payments. Among the characteristics associated with the probability of incurring OOP expenditures, socioeconomic conditions, the presence of elderly and of people affected by chronic conditions showed significant results.
Conclusion Kenya is still lagging behind in terms of protecting its citizens against financial risks associated with ill health and healthcare seeking behaviour. More effort is needed to protect the most vulnerable population groups from the high costs of illness.
- health systems
- public health
- KAP survey
This is an open access article distributed in accordance with the Creative Commons Attribution Non Commercial (CC BY-NC 4.0) license, which permits others to distribute, remix, adapt, build upon this work non-commercially, and license their derivative works on different terms, provided the original work is properly cited, appropriate credit is given, any changes made indicated, and the use is non-commercial. See: http://creativecommons.org/licenses/by-nc/4.0/.
Statistics from Altmetric.com
Summary box
What is already known?
The government of Kenya has embarked on a highly ambitious reform programme that aims to provide access to higher levels health facilities free of charge. The first phase of the Universal Health Coverage (UHC) agenda is currently being piloted in four Kenyan counties and national rollout is planned by 2022.
What are the new findings?
The incidence of catastrophic payments is more severe for the poorest households and in the rural areas and outpatient services are the main driver of catastrophic payments.
Socioeconomic conditions, the presence of elderly in the household and of people affected by chronic conditions are key characteristics associated with the probability of incurring OOP expenditures.
What do the new findings imply?
Through the removal of user fees, the ongoing UHC agenda is expected to increase access to inpatient services and this may lead to a raising number of people experiencing catastrophic expenditure as well as higher poverty due to the high costs of inpatient care.
Consequently, it is important that efforts to expand access to care are accompanied with interventions to protect citizens against catastrophic expenditure.
Background
Universal Health Coverage (UHC) refers to a situation where all people can obtain needed health services at a good level of quality without suffering undue financial hardship.1–3 When healthcare systems fail to financially protect care seekers, entire households can be pushed or trapped into poverty or experience catastrophic expenditure due to payments required to receive needed health services. While this is a fundamental requirement of UHC, guaranteeing financial protection has proven to be a particularly daunting challenge across most countries but especially so in resource constrained settings where prepayment mechanism are not well developed.4 A recent study conducted across 133 countries found that in 2010 more than 808 million people incurred catastrophic health expenditure5 and 122 million people were pushed into poverty.6 Between 2000 and 2010 the incidence of catastrophic health expenditure increased from 9.7 per cent to 11.7 per cent, proving the lack of progress on financial protection. While health service coverage has been increasing as investments in UHC are being scaled up, the financing mechanisms have not been effective in equally improving on financial protection. Recent evidence showed that countries with a higher percentage of total health expenditure prepaid through taxes or mandatory contributions perform better in terms of financial protection than those relying on voluntary premiums and contribution.5 6
Despite significant progress towards achieving UHC in many low-income and middle-income countries, substantial challenges remain in terms of access to quality healthcare and lack of financial protection.7 8 This is also the case in Kenya, where sustained efforts and policy interventions have led to limited progress towards UHC. In the last decade, the government of Kenya has also identified UHC as a critical policy area in the Vision 2030 long-term development plan. The same goals are echoed in the Constitution of Kenya (2010) and the Kenya Health Policy 2014–2030.9 In the same spirit, a series of health financing policies reducing, waiving or removing user fees for selected healthcare services have been implemented in Kenya since the 1980s.10–12 Noteworthy reforms implemented by the National Hospital Insurance Fund (NHIF) in the last decade include: the introduction of the Civil Servants Scheme for formal sector government workers and their dependents, the expansion of the basic benefit package for NHIF members, the increase of the NHIF inpatient reimbursement rate, and the introduction of a Health Insurance Subsidy for the poor.13
However, recent data suggest that progress towards the two dimensions of UHC–effective service coverage and financial protection–has been limited. Over a 10-year period from 2003 to 2013 the combined UHC indicator increased slowly from 44 per cent to 52 per cent.14 During the same period, the incidence of catastrophic health expenditure seems to have declined but it remains significantly high. While estimates of catastrophic health expenditures in Kenya are sensitive to the methodology used,15 all studies attest to the risk of becoming poor (or poorer, for families already poor) as a result of health expenses. Using data from 2007, the level of catastrophic health expenditure was found to range between 9.8 per cent16 and 14.8 per cent17 of the households, depending on different methodological choices. The most recent analysis from 2013 estimated that the percentage of households that incurred catastrophic health expenditures was 4.5 per cent,18 suggesting that more intense efforts are needed in order to protect Kenyans against financial hardship from health expenditure. All the results reported refer to indicators computed using direct healthcare payments as numerator and 40% of non-food expenditures as threshold. As in many other African countries, Kenya’s efforts to increase the percentage of people covered through voluntary contributions have had a limited impact. Recent estimates show health insurance coverage has increased from 10 per cent in 2007 to 20 per cent in 2018, a positive although insufficiently accelerated trend.19
In a radical shift from this piecemeal approach to health system improvement, in 2018 the Kenyan Government has embarked on a highly ambitious reform programme (the Big 4 Action Plan), committing to expand UHC to the entire Kenyan population by 2022.20 The new reform started in December 2018 and is currently being piloted in four counties—Kisumu (Kenya’s third largest county), Nyeri (second richest county with a GDP per capita of $1503), Machakos (10th richest with a GDP per capita of $913), and Isiolo (one of the poorest counties with a poverty incidence of about two-thirds of the population). The reform foresees the elimination of user fees at higher levels of the health sector (health facilities level IV and V) in an effort to further increase access to care and reduce medical out-of-pocket expenses for Kenyan households by half before full implementation in 2022.
On this backdrop, our analysis sets out to provide an updated assessment of the performance of the Kenyan health sector in terms of financial protection. This manuscript focuses on assessing impoverishing and catastrophic health expenditure in Kenya using data collected after the abolition of user fees in health centres and dispensaries and the increased coverage of NHIF. In this manuscript we assess the catastrophic effects of OOP healthcare expenditure using two different consumption thresholds and we compute the impoverishment effects due to OOP healthcare expenditure for Kenya as a whole and for the four selected counties where the pilot UHC programme is being implemented. Finally, we also investigate household characteristics associated with catastrophic payments. This study provides two important contributions: first, it allows to continuously monitor trends in financial protection in Kenya, and second, it provides a baseline to assess the impact of the UHC pilot programme and inform scale-up plans.
Methods
Data source
We use data from the fourth KHHEUS collected by the Kenya National Bureau of Statistics in April and May 2018. The dataset contains sociodemographic, economic and health related information at the individual and household level. The survey includes questions on utilisation of inpatient care (over the last 12 months) and outpatient care (over the last 4 weeks), health insurance coverage, and a detailed description of households’ expenditures. Previous KHHEUS surveys were conducted in 2003, 2007 and 2013. The survey used a two-stages sampling approach. In the first stage 1500 clusters were selected, and in the second stage 25 households for each cluster. Therefore, it includes 37 500 households and it is designed to be representative both at national and county level.21
Patient and public involvement statement
Patients were not directly involved in this study. Only secondary data were used for the analyses.
Methods
We estimate the incidence and intensity of catastrophic expenditure and investigate the implications for poverty using well-established methodologies described by Wagstaff and van Doorslaer,22 Xu et al23 and O'Donnell et al.24
The definition of OOP used to compute all indicators is the sum of transport costs to reach the health facility, user fees and any other direct payments made by individuals of the same household to the healthcare providers, net of any reimbursements from the insurance or subsidy from the government. We considered only the cash payments not reimbursed by any health insurance scheme. In online supplementary material 1 we reported the same indicators computed in the main text but using a different definition of OOP, namely considering only direct payments as nominator (excluding transport costs). Nevertheless, the inclusion or exclusion of transport costs does not show any remarkable difference.
Supplemental material
Measuring the incidence and intensity of catastrophic healthcare expenditure
We first measure the incidence of OOP payments defined as the ratio between the healthcare expenditures and the total (or non-food) expenditure of the household. We then estimate the catastrophic headcount (HC) which represents the percentage of people whose OOP payments are higher than a selected threshold. In alignment with the World Bank approach, we consider two poverty thresholds and compare the results: 10 per cent of total expenditure and 40 per cent of non-food expenditures (defined also as ‘consumption expenditure’). This indicator is a very rough measure of catastrophic expenditure, and unable to give information on the intensity of the OOP expenditure. To overcome this limitation, we compute the catastrophic payment overshoot (O) which measures the amount by which OOP payments of the household exceed the threshold of reference. We then adjust the catastrophic HC and catastrophic payment overshoot (O) indicators for differences in socioeconomic status to reflect the fact that opportunity costs of catastrophic health expenditures are higher for a poor household compared with a rich one. The method used to reflect the difference in opportunity costs consists in multiplying the payment overshoot (O) and the HC index by the complement of the respective concentration index (CI).22 In our analysis we apply the Erreygers correction to the CI to account for the fact that the variable of interest is binary and avoid biased estimates.25 26
Measuring the impoverishing effects of health care expenditures
We compute standard indices measuring impoverishment, that is, the poverty HC, the poverty gap and the normalised poverty gap22. The poverty HC indicates the percentage of people below the poverty line. We considered the Kenyan national poverty line of Kenya shillings (Ksh) 3252 (US$32.5) in rural areas and of Ksh 5995 (US$59.9) in urban areas.21 The poverty gap measures the magnitude of the individual deficit and is computed as the difference between the poverty line and the individual income. We used total household expenditures as a proxy for household income. Given that KHHEUS database is set at the household level, to obtain a proxy for individual income we correct the household income using the Anzagi-Bernard equivalence scale.27 This scale assigns a value of unity to people aged 15 years and above, a weight of 0.65 to children aged 5–14 and 0.24 to children 0–4 years.21
Finally, the normalised prepayment poverty gap, defined as the ratio between the poverty gap and the poverty line, allows for cross-country comparison.
We calculate the same indicators for the prehealth and posthealth payment income and compute the measures of poverty impact of OOP payments as the difference between the prepayment and postpayment indicators. To express poverty indicators at the individual level, we rescale the results at household level using a weight obtained multiplying the sample weight by the household size.24
All the indicators are disaggregated by type of service (outpatient and inpatient), as well as by urban/rural areas and income quintiles to better take into account the heterogeneity effects.
Measuring the determinants of catastrophic healthcare expenditures
To assess what household characteristics are associated with the probability of incurring catastrophic expenditures, we carry out a multilevel logistic regression analysis where the dependent variable is a dichotomous variable indicating whether the household experienced catastrophic health expenditures. We included the cluster as second level of the model and the household as first level. We consider both definitions of thresholds: OOP payments over 10 per cent of the total expenditure budget and over 40 per cent of non-food expenditure.
The explanatory variables of the model, similar to related literature,18 28 29 include a set of characteristics of the head of the household (age, gender, level of education, marital status, employment status), and a set of characteristics of the household, including the presence of at least one member enrolled into a health insurance scheme, total consumption expenditure in quintiles, household size, presence of chronic illness in the household, area of residence (urban/rural), presence of elderly people (aged 60 and more). The empirical analyses were performed in Stata V.14.
Results
Out-of-pocket payments
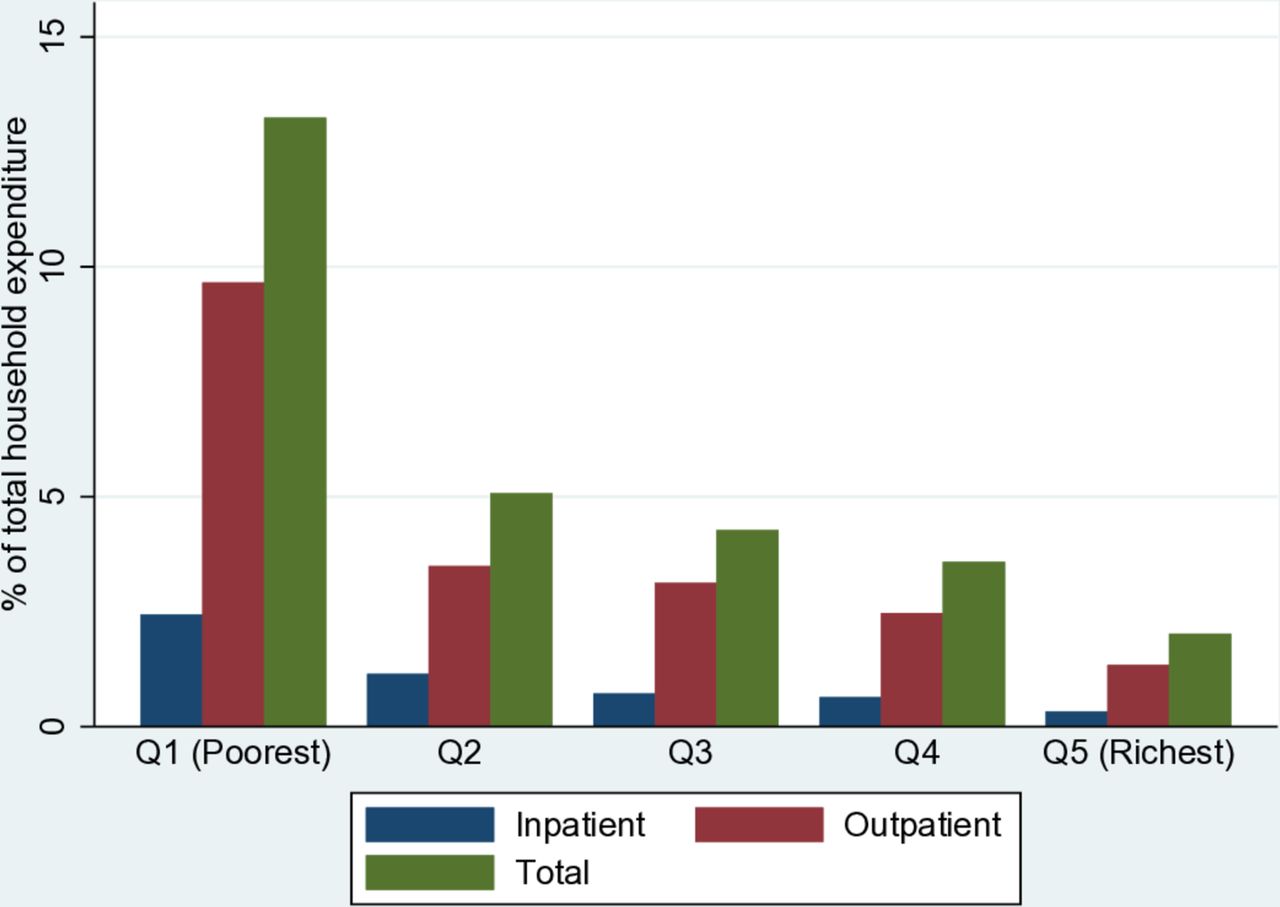
Table 1 outlines the average OOP expenditures broken down by expenditure quintiles and residential area. The average OOP payments was Ksh 5613 for outpatient treatments, Ksh 1492 for inpatient treatments and Ksh 7990 for both types of treatment. Among the subsample of healthcare seekers the average expenditure was Ksh 15 409 for outpatient treatment, Ksh 16 463 for inpatient treatment and Ksh 17 807 for both types of treatment. On average, among this subsample, the higher the total expenditure quintile, the more households spent for health services. When the overall sample is considered, OOP payments are on average higher for those belonging to the richer and richest quintiles. In urban areas the average OOP health expenditure is 30–40 per cent higher than in rural areas. Figure 1 shows that the economic burden of OOP payments is inversely proportional to the economic status of the households. In particular the burden seems very high for the poorest, who spend on average between 10 and 15 per cent of their budget for healthcare.
Mean annual OOP payments, by income quintiles and residential area, Kenya

Mean OOP payments as a share of total household expenditure by income quintiles.
Catastrophic healthcare payments
Table 2 shows the estimates of catastrophic expenditures measured by the catastrophic HC index and the catastrophic payment overshoot (O) for outpatient, inpatient and total OOP expenditures disaggregated by expenditure quintiles and location (urban and rural areas). The total weighted catastrophic HC is 10.7 when we consider the 10 per cent threshold, meaning that 10.7 percentage of the population incurs catastrophic health payments. As expected this percentage is lower (7.1%) if we consider the more restrictive 40 per cent of non-food expenditure threshold. The incidence of catastrophic payments is more severe for the poorest households rather than wealthier ones and in the rural areas, compared with the urban areas. This finding holds true for all outpatient, inpatient and total OOP expenditures, but it is stronger for the concentration of outpatient expenditures. The values of the CI of catastrophic expenditures confirm the inequality between rich and poor households: CI_E increases with the threshold (−0.06 referred to 10% expenditure threshold and −0.10 referred to 40% expenditure threshold), meaning greater inequalities between poorest and richest for higher thresholds.
Poverty headcount (HC) index and catastrophic payment overshoot (O), Kenya
All the concentration indices are negative, suggesting that catastrophic expenditures are concentrated among the poor.
The overshoot index (ie, the extent to which household health payments exceed the threshold) is positive for all categories considered. On average, OOP health expenditure for all households is 5.5 per cent higher than the threshold (based on 10% of the household expenditures threshold). Similarly, the corresponding value for the 40 per cent non-food expenditures is 22.1 per cent. These values drop to 3.8 per cent and 14.9 per cent when only outpatient OOP are considered and 1 per cent and 3.4 per cent when only impatient are considered.
The overshoot index largely differs by expenditure quintiles, especially for outpatient treatments: the poorest pay 30.9 per cent more than the 40 per cent threshold, whereas the richest only pay 0.5 per cent more. This difference is smaller for OOP of inpatient treatments where the index is equal to 0.1 for the poor and 5.1 for the rich.
Table 3 shows results for the four selected counties. When looking at the total OOP payments, the proportion of people experiencing catastrophic payments in Isiolo (9.5% and 7.2% in the first and second model, respectively) is comparable to the national average. Kisumu reports the highest percentage of people experiencing catastrophic payments (19.6% and 14.5% in the first and second model, respectively), while Machakos reports the lowest percentage (7.6% and 5.2% in the first and second model, respectively). Nyeri reports values slightly higher than the national average (16% and 10.2% in the first and second model, respectively). The highest value in Machakos is driven by outpatient visits while Nyeri reports the highest values of catastrophic payments due to inpatient treatments. On average, Machakos (1.8% and 7.2% in the first and second model), and Isiolo (3.8% and 8.4%) show a lower overshoot index while Kisumu (7.4% and 28.6%) and Nyeri (11.9% and 24.5%) record the highest values for the same index.
Poverty headcount (HC) index and catastrophic payment overshoot (O), Kisumu, Machakos, Isiolo and Nyeri districts
Impoverishing effect of out-of-pocket expenditure
Table 4 shows results for the impoverishment effect. Before making any health-related payments, 46.9 per cent of individuals were already living below the national poverty line in the rural areas and 41.2 per cent in the urban areas. After accounting for OOP payments, the poverty head count increased by 2.2 percentage points in both rural and urban areas. Therefore, our estimates suggest that between 1 and 1.1 million individuals were pushed into poverty due to OOP payments.
Poverty head count and poverty gap before and after OOP payments, Kenya
Before accounting for OOP payments, the monthly poverty gap, that is, the average deficit to reach the poverty line, was Khs 1306 in rural areas and Khs 2557 in urban areas. After accounting for OOP payments, the average deficit increased by Khs 124 in rural areas and Khs 113 in urban areas.
Table 5 reports the same indicators computed for the four counties. Remarkable differences for the urban and rural areas are evident in all the four counties analysed. Kisumu shows poverty levels for the rural areas (48.6%) in line with the national average (46.9%), and definitely higher levels for the urban areas (65.4% compared with an average of 41.9%). The poverty HC net of health payments increased by 4.3 percentage points in rural areas and only 1.3 percentage points in urban areas. In Machakos the disparities were even more noteworthy: 22.9 per cent of individuals in rural areas lived under the poverty line and 51.9 per cent in urban areas, with an increase of 0.8 and 4.3 percentage points after accounting for health payments, in both areas, respectively. Nyeri also showed substantial heterogeneity between rural and urban areas, but in the opposite direction, with poverty levels in urban areas almost three times higher than in rural ones. The increase in poverty after health payments remained the same in both areas; 2.8 and 2.9 percentage points. Finally, Isiolo showed the highest level of poverty in rural areas (54.2% before and 57.4% after health payments) and a lower level (48.5% before and 50.6% after health payments) in the urban areas.
Poverty head count and poverty gap before and after OOP payments, Kisumu, Machakos, Isiolo and Nyeri districts
Figure 2 is a Pen’s Parade graphical representation of the impoverishing effect due to the OOP payments. Both rural and urban areas are represented, respectively on the right and on the left side. The horizontal axis represents households ranked according to their total expenditure before any healthcare related payments. The graph shows households’ distribution according to their expenditures pre-OOP (curve line) and post-OOP healthcare payments (vertical lines) as multiple of the poverty line. The horizontal lines represent the poverty line. When the curve line lies under the poverty line, the household is already below it before considering any OOP payments. On the contrary, any time that the curve line lies above the poverty line and the respective vertical line encounters the poverty line, the household is pushed into poverty due to the OOP payments. The figure shows that, especially in rural areas, many households were pushed into poverty also at the right tail of the ranking, suggesting that impoverishment is an issue not only for the poorest but also for the high-middle income population.

Effect of OOP expenditures on household consumption distribution in urban and rural areas. PL, poverty line.
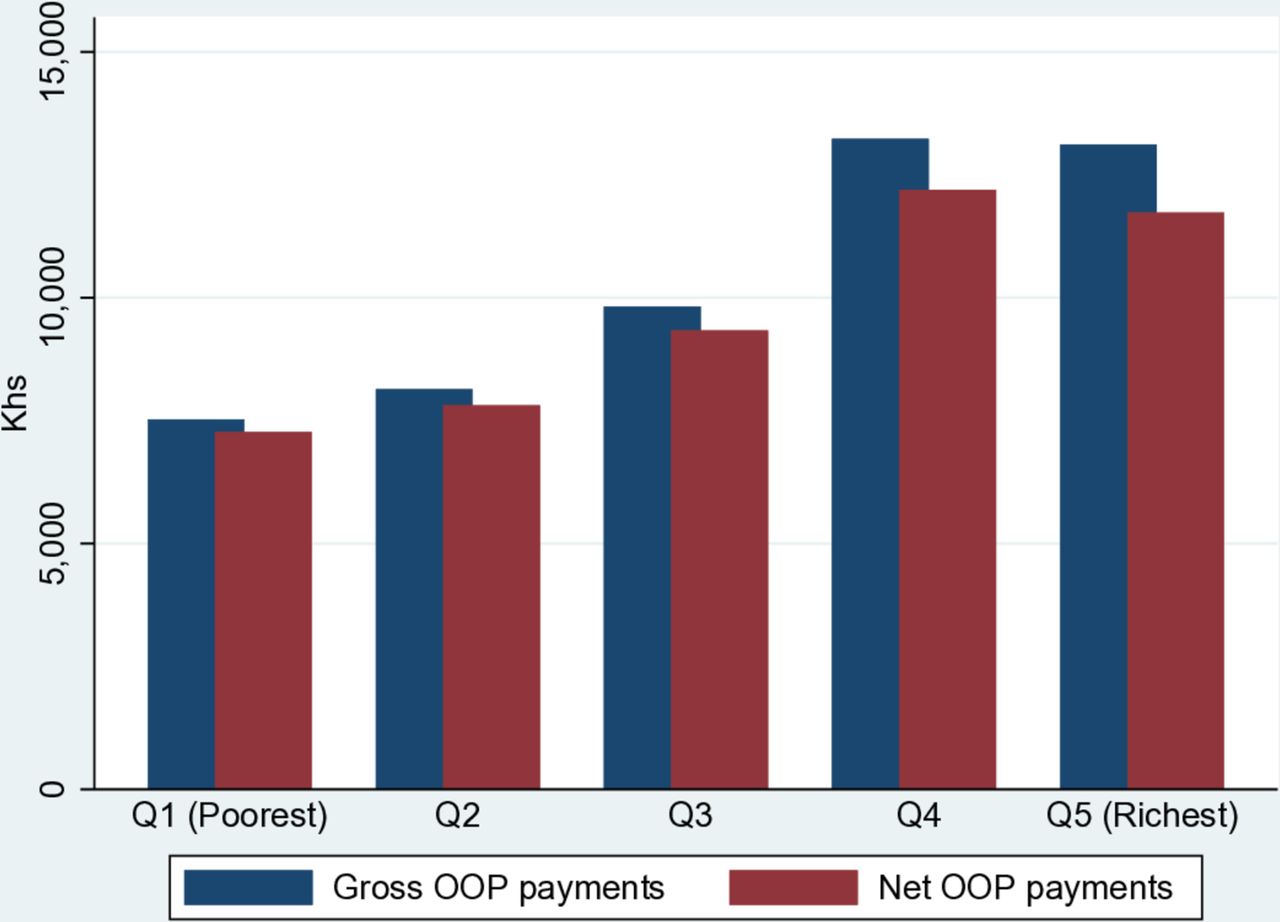
As an additional check we estimated the extent to which health insurance and subsidies reduce catastrophic payments, that is, the financial protection effects of health insurance and subsidies. Figure 3 shows gross and net OOP payments, where the difference between the two is that the latter includes only cash payments made by households, while the former also includes the disbursements paid by the health insurance or reimbursed through subsidies. The difference between the two indicators can be attributed to the financial protection effect of health insurance and subsidy policy. The figure suggests that health insurance protected the richer more than for the poor. Indirectly, it also shows that the absolute value of OOP payments was on average higher for richer households.
Gross and net (of health insurance reimbursements and subsidies) OOP expenditures (in Khs).
Measuring the determinants of catastrophic health care expenditures
Table 6 reveals what household characteristics are associated with the probability of incurring catastrophic expenditures for health. Results suggest that the characteristics of the head of the household were generally not significantly correlated with the probability of incurring catastrophic expenditure, with the only exception of education. Age was not associated with OOP payments, while the effect of the sex of the head of the household is less clear. A female head was positively correlated with the probability of incurring catastrophic expenditure for the indicator referring to 10% of total budget (OR=1.1) but slightly negatively correlated with the indicator referring to 40% of non-food expenditure (OR=0.9).
Probability of incurring catastrophic healthcare expenditures
Among the households’ characteristics, the presence of one or more members suffering from chronic diseases (OR=2.4) and the presence of one or more elderly people in the household (OR=1.5) were positively associated with the probability of incurring catastrophic expenditure. The estimates show also an income gradient: the richer the household, the less likely it was to incur catastrophic payments. Similarly, the bigger the household, the lower the probability to incur catastrophic payments. The presence of at least one member in the household covered by health insurance as well as living in an urban area (OR=1.1 for both variables) were slightly positively correlated with catastrophic payments, but the correlation was significant only for the indicator referring to 10% of total budget.
Discussion
Using a 40 per cent non-food expenditure threshold, we found that 7.1 per cent of the Kenyan households incurred catastrophic health payments in 2018. When 10 per cent of total consumption is used as threshold, the percentage of households that incurred catastrophic payments increased to 10.7 per cent. Due to different methodological choices, it is not possible to directly compare our results with those from previous studies. Yet, some considerations on general trends can be made.
Studies based on previous waves of the KHHEUS survey and using the 40 per cent non-food expenditure as threshold estimated the level of catastrophic health expenditure at 14.8 per cent17 and 9.8 per cent in 200716 and 6.6 per cent in 2013.18 These estimates seem to suggest that while financial protection improved between 2007 and 2013, over the period 2013–2018 the trend has halted. A similar finding arises in terms of the number of people pushed into poverty which decreased from 1.5 million people in 200717 to less than half million people in 2013,18 and increased again to 1 million in 2018. This emphasises a negative trend in terms of progress in financial health protection, which is also confirmed looking at the share of the population pushed into poverty: about 4% for 2007, 1% for 2013 and 2% for 2018.
This finding could be explained by the fact that the removal of user fees at health centres and dispensaries enacted in 2013 gave access to care to people who were previously not seeking care. By doing so, more people experienced health expenditure related to transport, drugs, and higher level of care when referral was needed.
The additional reforms undertaken between 2013 and 2018 (eg, coverage of outpatient treatments by NHIF initiated in 2015) did not have a meaningful impact in terms of financial protection, likely due to the small percentage of population covered by the health insurance and health profile of its members.
In our analysis we found evidence of continued disparities between poor and rich. Figure 1 showed a regressive pattern in terms of the share of OOP on total budget, and all the indicators of OOP and impoverishment remarked this disparity. It is notable that the overshoot indicator for outpatient visits indicated that the poorest households exceeded the catastrophic threshold by 30 per cent, while the richer ones by less than 1 per cent. Moreover, figure 2 shows that many people were further pushed below the poverty line. This is particularly worrisome since health payments can trigger a poverty trap mechanism: rather than helping the worst-off to exit their poverty condition, the health system is indirectly anchoring them to it. This phenomenon is even exacerbated by the fact that poor people are generally the ones more in need of care.
Indicators reported in table 2 also show large differences among outpatient and inpatient services. Both the poverty HC and overshoot indicators for outpatient services were about three times higher than for inpatient services. As many as 5 per cent of the households who used outpatient services experienced catastrophic expenditures (exceeding the 40% non-food expenditure threshold by 14.9%) compared with 1.4 per cent of those who used inpatient services (and exceeded the threshold by 3.4%). This result suggests outpatient treatments are the primary cause of catastrophic payments and impoverishment. A plausible explanation for this finding is that poorer people, discouraged by user fees at higher level of care, choose not to seek care.15 Data from the same survey indeed show that the percentage of sick people not seeking care increased from 13 per cent in 2013 to 28 per cent in 2018, with a higher proportion in rural areas. Also, self-medication increased from 30.7 per cent in 2013 to 45.2 per cent in 2018.19
Our results also highlighted disparities between urban and rural areas, the latter scoring overall higher values of catastrophic payments and impoverishment indicators. This is in line with previous results17 and can be traced back to a higher concentration of poorer households in rural areas (in absolute values).
The study also showed large heterogeneity across counties. The association between higher average income and lower catastrophic expenditure levels held true also at the county level. Nyeri, the second richest county, had the lowest level of catastrophic health expenditure and impoverishment indicators, while Isiolo, one of the poorest counties, showed high values of the same indicators.
Based on these findings, some hypothesis can be made regarding the expected impact of the UHC initiative on catastrophic payments and impoverishment indicators. We expect limited impact on the richer counties (eg, Nyeri) and more marked reductions in poverty levels in middle (eg, Machakos) or middle-poor counties (eg, Kisumu), where a larger number of households are currently pushed into poverty by health expenditure. We also expect an impact on the poorest counties (eg, Nyeri), but smaller than middle-rich counties, due to the large proportion of household not seeking care and therefore not included in the impoverishment indicators. On the other hand, the positive impact of an extended UHC might be mitigated since patients now affording healthcare services might incur higher OOP payments, such as transport and drugs related costs (especially for the outpatient services).
The results from the regression showed that among the demographic characteristics of the head of the household, only education was significantly and negatively correlated with the probability of incurring catastrophic health payments. Among the household’ characteristics, the presence of one or more people suffering from chronic diseases, and the presence of one or more elderly people in the household, were positively associated with the probability of incurring catastrophic expenditure. Intuitively, more need for healthcare translates into higher probability of incurring catastrophic payments. The results also showed that the richer the household, the less likely it is that they incur catastrophic payments. Similarly, the bigger the household, the lower was the probability to incur catastrophic payments. This result might seem counterintuitive and differs from previous results for Kenya18 but is confirmed by similar findings for Peru28 and Ghana.29 The results also suggested that living in urban areas was positively correlated with the probability of incurring catastrophic payments (but statistically significant only for the indicator referring to 10% of total budget). This confirms that, when controlling for income, there is a higher proportion of sick people not seeking care in rural areas, probably due to barriers to access care.
Finally, a particularly noteworthy result is that the presence of at least one member in the household covered by health insurance was positively correlated with catastrophic payments (but statistically significant only for the indicator referring to 10% of total budget), confirming previous evidence that health insurance coverage is not positively associated with financial protection.5 30
Overall, our results indicate that interventions implemented so far to secure financial risk protection are not sufficient. OOP expenditures are the most regressive source of healthcare financing,3 therefore additional investments are needed to ensure a progressive healthcare financing system. Potential interventions to improve financial risk protection include more elaborated targeting approaches of people in need (eg, poor, chronic patients) and the inclusion of additional drugs in the benefit package. However, additional evidence is needed to better disentangle the causes of OOP payments and thus identify programme that can effectively reduce the risk of catastrophic spending.
This study presents some limitations. First, by their definition, the indicators computed capture the effects of illness and healthcare use on poverty only for those households whose members seek care. While it is safe to assume that household are at higher risk of poverty if their members fall ill but do not seek care, we cannot estimate the magnitude of this effect. Second, we calculated yearly expenditures for outpatient services by extrapolating the expenses incurred over the 4 weeks prior to the time of the interview to the entire year, relying on the assumption that they are homogeneous. In settings where seasonal fluctuations in healthcare expenditure can be expected, for example, due to meteorological conditions or cyclical economic activity patterns, this assumption could not hold true. The KHHEUS was conducted during the rainy season (April to May) a time preceding the harvest (and the relative earnings) and possibly associated with an increased prevalence of malaria and other common diseases often translating in higher healthcare needs.31 Finally, opportunity costs of sick people, such as lost earnings, are not included. Yet, the risk of poverty might be undervalued if income lost during illness, such as limitations in labour participation, are not included.
Conclusion
Kenya is still lagging behind in terms of protecting its citizens against financial risks associated with ill health and healthcare seeking behaviour. As our results show, 7.1 per cent of the Kenyan households incurred catastrophic health payments in 2018. While the percentage of households being financially affected by health payments has been decreasing since 2003, the health system reforms implemented over the last 5 years (2013–2018) did not succeed in preventing households from experiencing catastrophic and impoverishing health expenditures. If Kenya is to achieve UHC by 2022, different interventions are needed to protect the most vulnerable population groups—both in terms of socioeconomic characteristics and health status—from costs of illness. As previous evidence has shown, expanding health insurance may enhance access to care but often fails to protect people from financial hardship related to healthcare. The recently launched UHC initiative aims at increasing access to inpatient care by removing user fees at hospitals. By providing county level results, this study set up the baseline to monitor changes in financial protection in the four UHC pilot counties and in subsequent scale up counties.
Acknowledgments
The authors are grateful to the Ministry of Health, Government of Kenya and the Kenya National Bureau of Statistics for facilitating access to the data.
Footnotes
Handling editor Valery Ridde
Contributors All authors are responsible for the conceptualisation and design of the study. PS carried out the data analysis and wrote all manuscript drafts. LDG and SI provided critical reviews of the data analysis and all manuscript drafts. JC provided overall guidance to the study and critical reviews of the data analysis and all manuscript drafts. All authors read and approved the final manuscript.
Funding This study was supported by the World Bank. The World Bank (through the Kenya Health Sector Support Project) and the WHO provided funding for the 2018 Kenya Household Health Expenditure and Utilisation Survey.
Disclaimer The findings, interpretations, and conclusions expressed in this paper are entirely those of the authors. They do not necessarily represent the views of the International Bank for Reconstruction and Development/World Bank and its affiliated organisations, or those of the Executive Directors if the World Bank or the governments they represent.
Competing interests None declared.
Patient consent for publication Not required.
Provenance and peer review Not commissioned; externally peer reviewed.
Data availability statement Data may be obtained from a third party and are not publicly available.