Article Text

Abstract
Introduction Although deaths due to chronic kidney disease (CKD) have doubled over the past two decades, few data exist to inform screening strategies for early detection of CKD in low-income and middle-income countries.
Methods Using data from three population-based surveys in India, we developed a prediction model to identify a target population that could benefit from further CKD testing, after an initial screening implemented during home health visits. Using data from one urban survey (n=8698), we applied stepwise logistic regression to test three models: one comprised of demographics, self-reported medical history, anthropometry and point-of-care (urine dipstick or capillary glucose) tests; one with demographics and self-reported medical history and one with anthropometry and point-of-care tests. The ‘gold-standard’ definition of CKD was an estimated glomerular filtration rate <60 mL/min/1.73 m2 or urine albumin-to-creatinine ratio ≥30 mg/g. Models were internally validated via bootstrap. The most parsimonious model with comparable performance was externally validated on distinct urban (n=5365) and rural (n=6173) Indian cohorts.
Results A model with age, sex, waist circumference, body mass index and urine dipstick had a c-statistic of 0.76 (95% CI 0.75 to 0.78) for predicting need for further CKD testing, with external validation c-statistics of 0.74 and 0.70 in the urban and rural cohorts, respectively. At a probability cut-point of 0.09, sensitivity was 71% (95% CI 68% to 74%) and specificity was 70% (95% CI 69% to 71%). The model captured 71% of persons with CKD and 90% of persons at highest risk of complications from untreated CKD (ie, CKD stage 3A2 and above).
Conclusion A point-of-care CKD screening strategy using three simple measures can accurately identify high-risk persons who require confirmatory kidney function testing.
- screening
- epidemiology
- community-based survey
Data availability statement
No additional data are available.
This is an open access article distributed in accordance with the Creative Commons Attribution Non Commercial (CC BY-NC 4.0) license, which permits others to distribute, remix, adapt, build upon this work non-commercially, and license their derivative works on different terms, provided the original work is properly cited, appropriate credit is given, any changes made indicated, and the use is non-commercial. See: http://creativecommons.org/licenses/by-nc/4.0/.
Statistics from Altmetric.com
Key questions
What is already known?
Chronic kidney disease (CKD) has become one of the leading causes of death worldwide, with low-income and middle-income countries (LMICs) disproportionately affected.
Expert groups recommend targeted screening for CKD over a population-wide approach, as the latter is not cost-effective.
There are scarce data surrounding implementation of CKD screening strategies in LMICs.
What are the new findings?
A prediction model for presence of CKD that is built on non-invasive measures can detect over 70% of persons with CKD in urban India while reducing the number of people requiring additional serum and urine testing.
Using this screening strategy, the majority of persons at highest risk for CKD complications and progression can be successfully detected and referred for preventive treatment.
Key questions
What do the new findings imply?
By allowing early detection and management, this straightforward CKD screening strategy could potentially reduce the number of people in resource-limited settings who progress to require costly renal replacement therapy.
Implementation of this strategy within pre-existing community outreach programmes in LMICs could facilitate appropriate medical referrals and eliminate the need for restructuring of primary healthcare delivery in these settings.
Introduction
Chronic kidney disease (CKD) is emerging as a health issue of significance across the globe and is one of the top 20 causes of death worldwide.1 Much of the rise in CKD-attributable deaths has occurred in low-income and middle-income countries (LMICs).2 3 Few data exist to inform screening strategies for early detection and management of CKD in LMICs, where risk factors for CKD may differ from those in high-income countries.4
Expert groups recommend a targeted, rather than a population-wide, screening approach to detect persons with CKD,5 6 as multiple studies suggest that population-based CKD screening is not cost effective.7 8 Targeted screening strategies developed for LMICs must be implemented in settings where primary care health services are often under-resourced and/or are built within the framework of community outreach rather than in-clinic consultations. Community health-worker facilitated ‘all comers’ screening programmes for diabetes and hypertension have been variably instituted in parts of India, Brazil and Uganda,9–11 but few CKD screening strategies exist to facilitate appropriate referrals for confirmatory testing.12 13
We developed and externally validated a screening strategy to identify persons most likely to benefit from kidney function testing using three large population-based urban and rural cohorts in India. Our goal was to efficiently identify individuals at highest risk for CKD and to reduce the pool of people requiring referral to primary or secondary health systems for CKD testing, while still allowing early detection and management of CKD.
Methods
Study population
We used cross-sectional survey data from three separate cohorts to develop and externally validate a risk prediction equation to identify persons for referral for CKD testing. We obtained data from three distinct cohorts of adults. Two (urban) cohorts are representative of Delhi and Chennai, from 2010 to 2012 (Center for cArdiometabolic Risk Reduction in South Asia study, CARRS-I) and 2015 (CARRS-II). The design and methodology of the original CARRS study is described in detail elsewhere.14 Both CARRS cohorts consist of urban residents by design. The third cohort was derived from rural sites within UDAY, a population-based intervention study for diabetes and hypertension with a pre-post evaluation design.15 We established a development sample of persons at risk for CKD using cross-sectional CARRS-II data from Delhi and Chennai. The model developed in CARRS-II was externally validated in both Delhi CARRS-I data (urban validation set) and UDAY (rural validation set). The CARRS and UDAY studies received approval for human subjects research from the Ethics Committees of the Public Health Foundation of India; the CARRS studies were additionally reviewed at All India Institute of Medical Sciences (Delhi), Madras Diabetes Research Foundation (Chennai) and Emory University.
For all three datasets, we excluded persons missing both serum creatinine and urine albumin-to-creatinine ratio (ACR) data, as we used these measurements to create a gold standard definition of CKD (figure 1, CARRS-II).16 In addition, we excluded persons who were missing either serum creatinine or ACR, as long as the availability of one did not already qualify them as having CKD. We hypothesised that urine dipstick results would be important correlates of CKD risk, and in CARRS-I, this testing was performed solely in Delhi. We thus obtained a final sample size of 8698 in CARRS-II (development set), 4065 in Delhi CARRS-I (urban validation set, online supplementary figure 1A) and 4940 in UDAY (rural validation set, online supplementary figure 1B).
Supplemental material
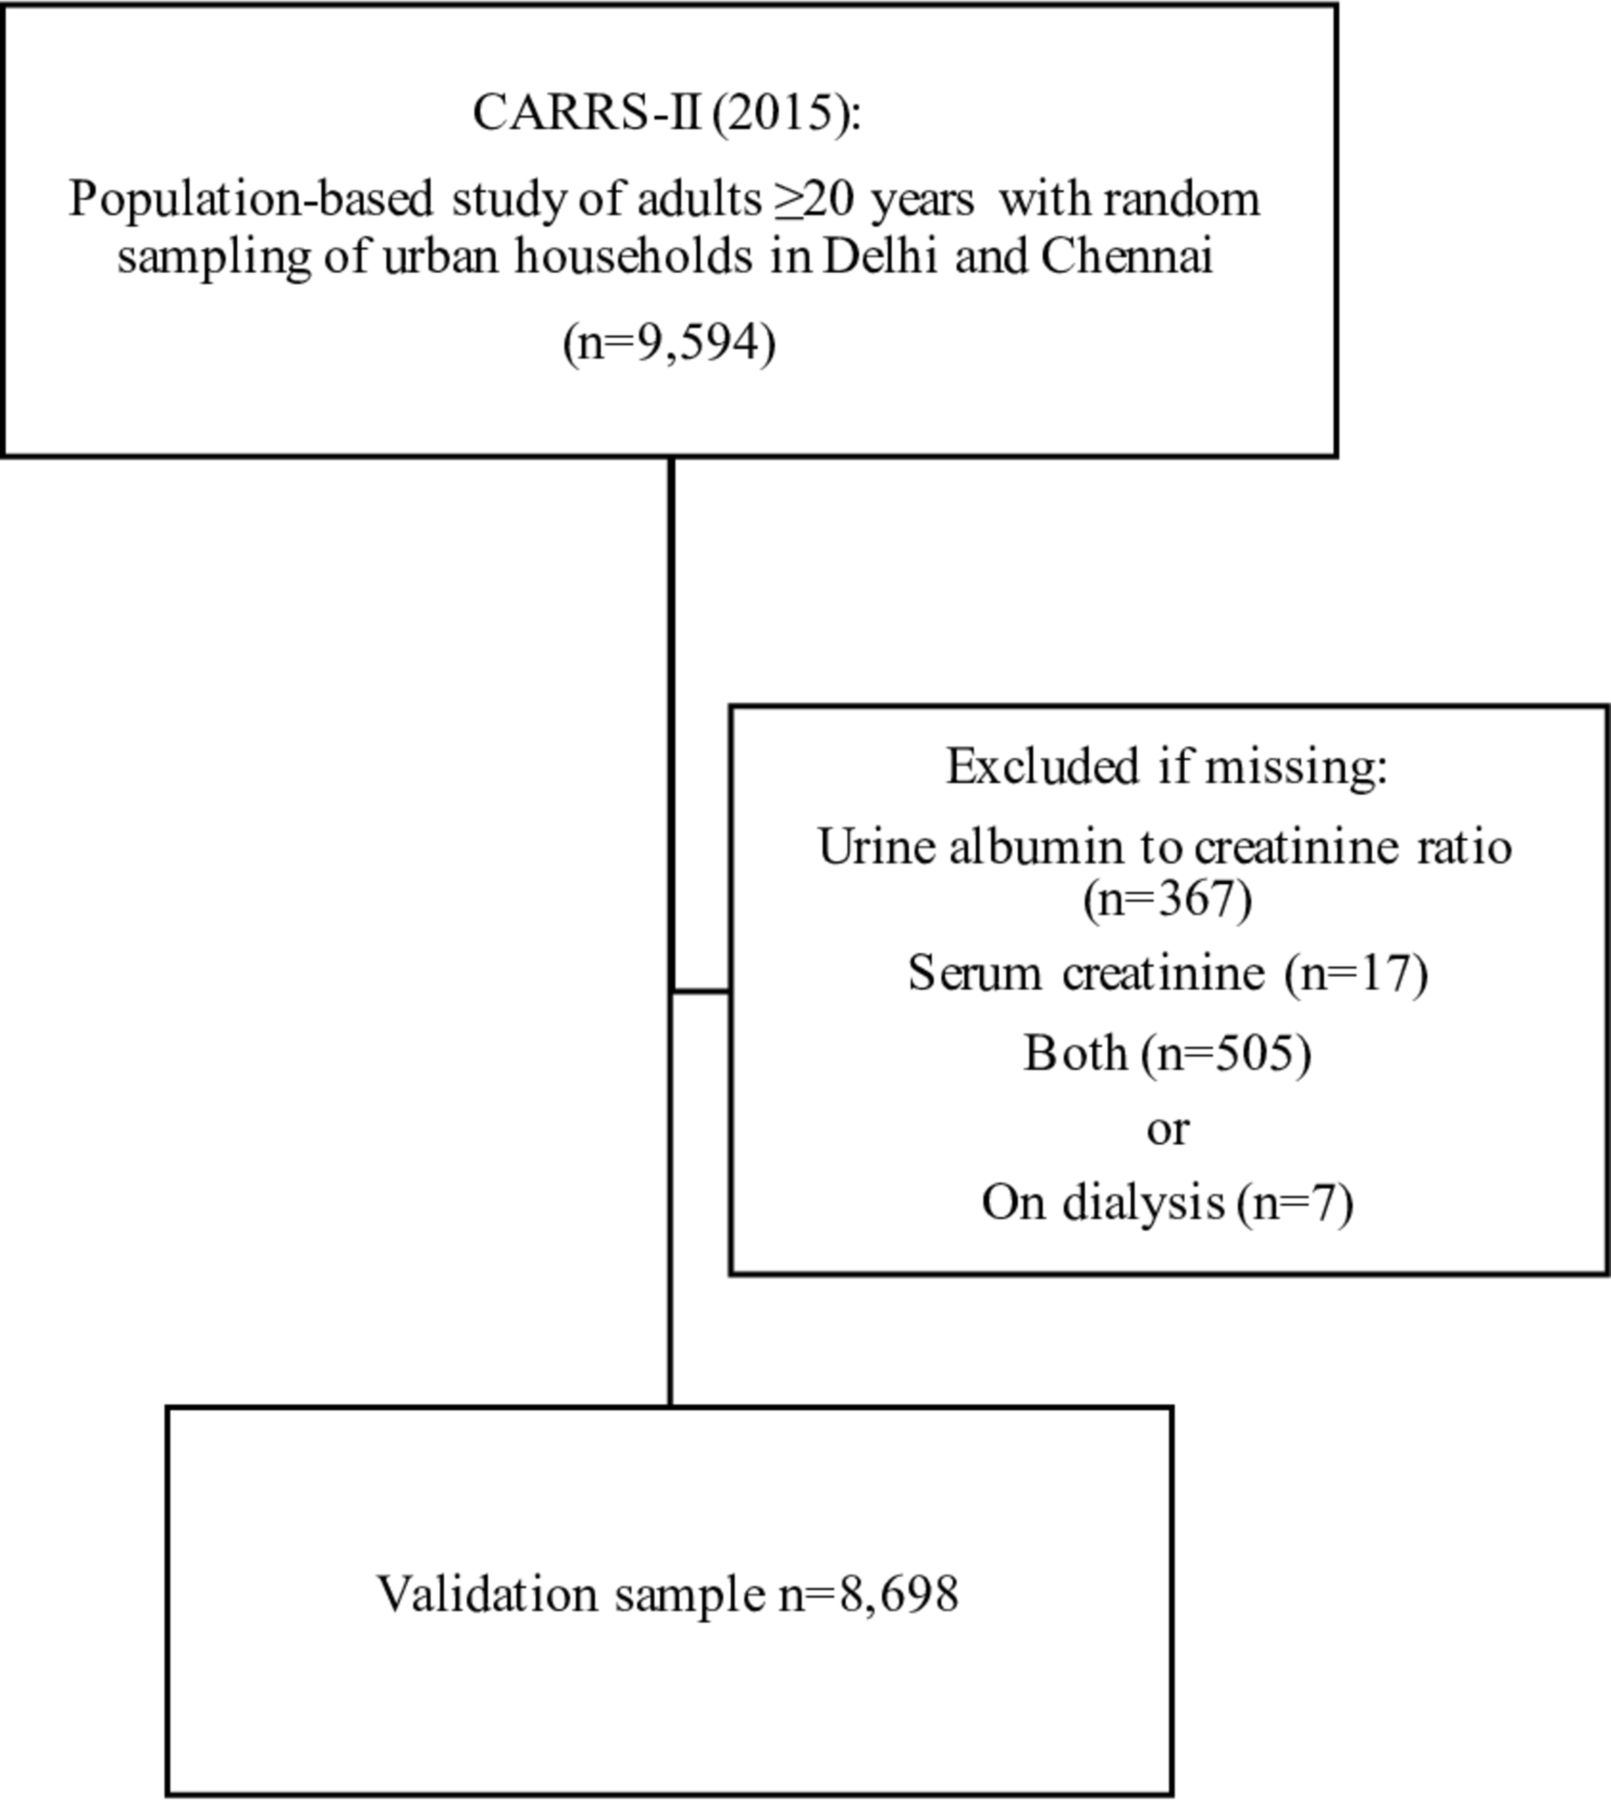
Flowchart of analysis sample from CARRS-II: we excluded persons on dialysis and those with missing urine or serum creatinine data, as long as the availability of one did not already qualify them as having CKD. Thus, we included a person meeting criteria for CKD based on an available serum creatinine, even if he or she were missing urine data to determine urine ACR. Conversely, if a person’s serum creatinine did not meet CKD criteria and he or she had missing urine data, he or she was excluded. ACR, albumin-to-creatinine ratio; CARRS-II, Center for cArdiometabolic Risk Reduction in South Asia study 2015; CKD, chronic kidney disease.
Definition of CKD
In our ‘gold standard’ definition of CKD, a person was classified as having CKD if they had either of the following:16
Estimated glomerular filtration rate (eGFR) <60 mL/min/1.73 m2.
ACR ≥30 mg/g.
The CARRS-I, CARRS-II and UDAY studies used an IDMS-calibrated kinetic Jaffe method to measure serum and urine creatinine and an immunoturbidimetric assay to measure urine albumin at a central RIQAS certified laboratory at Public Health Foundation of India. As recommended by the Kidney Disease Improving Global Outcomes (KDIGO) guidelines, we used the CKD-EPI equation to estimate eGFR.16 We opted not to use the modified CKD-EPI equation developed by Jessani et al in a Pakistani population,17 as it is not widely adopted in clinical practice and has comparable performance in persons with an eGFR <90 mL/min/1.73 m2; further, its association with outcomes is as yet uncertain.
Potential predictors of prevalent CKD
From the complete set of over 500 covariates available in CARRS-II, we selected 30 clinically relevant predictors that could be easily assessed during a community health worker home visit via self-reported medical history, anthropometry and point-of-care laboratory tests (eg, urine dipstick and capillary blood glucose). We used variables in their continuous form where available (eg, systolic blood pressure or fasting blood glucose) and categorised variables based on clinically relevant cut-offs when appropriate (eg, urine dipstick albumin negative or trace and ≥1+).
We prespecified three groups of potential predictors to be tested in the modelling: (1) all 30 predictors (ie, demographic, self-reported medical history, anthropometry and point-of-care testing), (2) only demographic and self-reported medical history (n for predictors=23) and (3) only anthropometry and point-of-care testing (n=8). While blood glucose is often feasible at the point-of-care, its use necessitates fasting and additional supplies; we therefore tested Model 3 with and without fasting glucose to determine its added utility.
We also examined model performance in detecting different stages of CKD: moderately increased albuminuria (ie, ACR ≥30 mg/g and ≤300 mg/g), severely increased albuminuria (ie, ACR >300 mg/g), reduced eGFR <60 mL/min/1.73 m2 without albuminuria and both reduced eGFR and albuminuria ≥30 mg/g. These stages represent increasing risk for complications from untreated CKD, with persons who have both reduced eGFR and albuminuria being at ‘very high risk’ for complications, including progression to end-stage kidney disease.18
Statistical analysis
Model development: We fit a logistic regression model by starting with the prespecified variable pool shown in table 1 for each of the three models, including clinically relevant interaction terms. We used a step-down selection procedure based on the Akaike information criterion to select the final predictors. For all continuous variables, we used cubic spline terms with knots placed at fixed quantiles of the predictor's marginal distribution.19 Since our goal was to establish a ‘high-risk’ pool for referral for further blood and urine testing, we identified a predictive probability cut-off that maximised sensitivity while minimising false positives. We therefore compared model predictive ability across probability cut-offs in which the sum of sensitivity and specificity was maximised (Youden index) but with the restriction that sensitivity was always greater than specificity.20 We checked the model discrimination ability by calculating the concordance statistic (c-statistic) and checked model calibration by plotting the calibration slope.
Characteristics of persons with and without CKD in a community-based survey from India (CARRS-II)*
Model validation: We internally validated Models 1 through 3 using bootstrap. The bootstrap procedure is used to perform internal validation of each predictive model and involves taking multiple samples (of the same size) from the original data with replacement. These samples are used to compute a measure of optimism that is an estimate of the bias due to overfitting. The model performance index such as the concordance, or c-statistic, that is computed from the model developed on the original data can then be adjusted by subtracting this optimism to provide a validated index.19 21 This method validates the entire process, including variable selection, but as opposed to cross-validation, another method of internal validation, it uses the full data set for model development.19 Given that this internal validation process is based on the original data and not on a completely different dataset, the computed statistics will be more optimistic of model performance than those derived from external validation with a different dataset. Thus, we also performed external validation using two other datasets.
To identify a model for external validation, we chose models with the best discrimination ability and calibration slope (a calibration slope significantly below 1 reflects substantial model overfitting). If models’ internal validation results were comparable, we selected the most parsimonious model for external validation using the Delhi CARRS-I and rural UDAY analytic samples. In sensitivity analyses, we used Random Forest as an alternative to logistic regression. We used SAS V.9.4 (SAS Institute, Cary, North Carolina) and R (V.3.5.1), particularly R package rms (V.51–2) and boot to perform statistical analyses.22–26
Patient and public involvement
Patients and the public were not involved in the design, conduct or reporting of this study.
Results
The unadjusted prevalence of CKD in the CARRS-II development set was 11%. Moderately increased albuminuria (ie, ACR ≥30 mg/g and ≤300 mg/g) was most common (69% of those with CKD), followed by reduced eGFR <60 mL/min/1.73 m2 without albuminuria (11%), severely increased albuminuria (ie, ACR >300 mg/g) (11%) and both reduced eGFR and albuminuria ≥30 mg/g (8%).
Table 1 describes persons with and without CKD in the CARRS-II development set. Persons with CKD were older, had attained fewer years of education, were more likely to be unemployed and were more likely to report alcohol or tobacco use. Further, they were substantially more likely to report a diagnosis of several chronic diseases, including diabetes, high blood pressure, stroke, peripheral vascular disease and heart disease (76% with at least one of the queried chronic diseases in persons with CKD vs 53% in persons without CKD). Anthropometry revealed higher Quetelet’s body mass index, waist circumference and blood pressure in persons with CKD. Of persons with CKD, 9% and 23% had urine dipsticks positive for protein and glucose, respectively.
Model performance in the development cohort
Step-down selection resulted in 20 correlates for Model 1, including an interaction term between Quetelet’s body mass index and waist circumference. Model 1 had an internally validated c-statistic of 0.78 and a calibration slope of 0.96 (table 2). Relying only on self-reported measures (Model 2) resulted in the lowest validated c-statistic (0.73). Model 3—which relied only on measured variables—had comparable performance with and without fasting plasma glucose (sensitivity 71%, 95% CI 68% to 74% and validated c-statistic 0.76 for Model 3a; sensitivity 71%, 95% CI 68% to 74% and validated c-statistic 0.77 for Model 3b). The models developed via Random Forest performed similarly (online supplementary table 1).
Logistic regression models to predict prevalent CKD
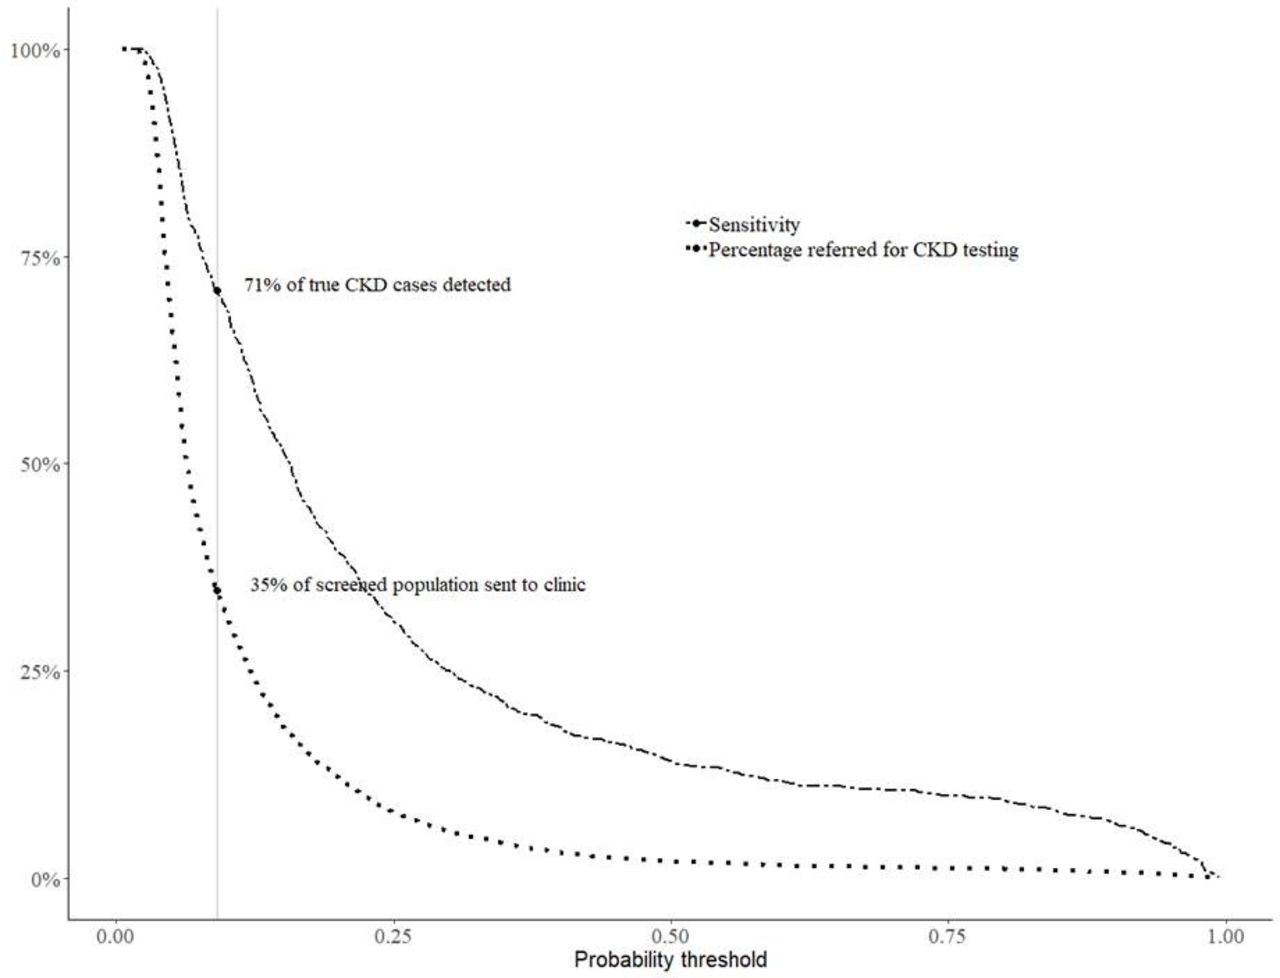
Figure 2 shows the percentage of true CKD cases that could be detected (ie, sensitivity) along with the percentage of screened persons referred for further kidney function testing at different probability thresholds for Model 3a. When using a threshold that maximises sensitivity and minimises number needed to test (threshold 0.09), the model would refer 35% of screened persons for further kidney function testing, resulting in 71% of true CKD cases being captured within the referred population.

Percentage of true CKD cases detected (sensitivity) and overall percentage of screened population referred for further CKD testing with Model 3a: the optimal threshold for maximisation of sensitivity and specificity, where sensitivity exceeded specificity, was at 0.09 (vertical grey line). At this probability threshold using Model 3a, 35% of the screened population would be referred to a clinic for serum creatinine and urine albumin-to-creatinine ratio testing, where we expect to detect 71% of true CKD cases. Selecting a different probability threshold would result in a different number of persons requiring referral and a different sensitivity. Policy makers could chose the optimal threshold based on capacity for screening and desired sensitivity. CKD, chronic kidney disease.
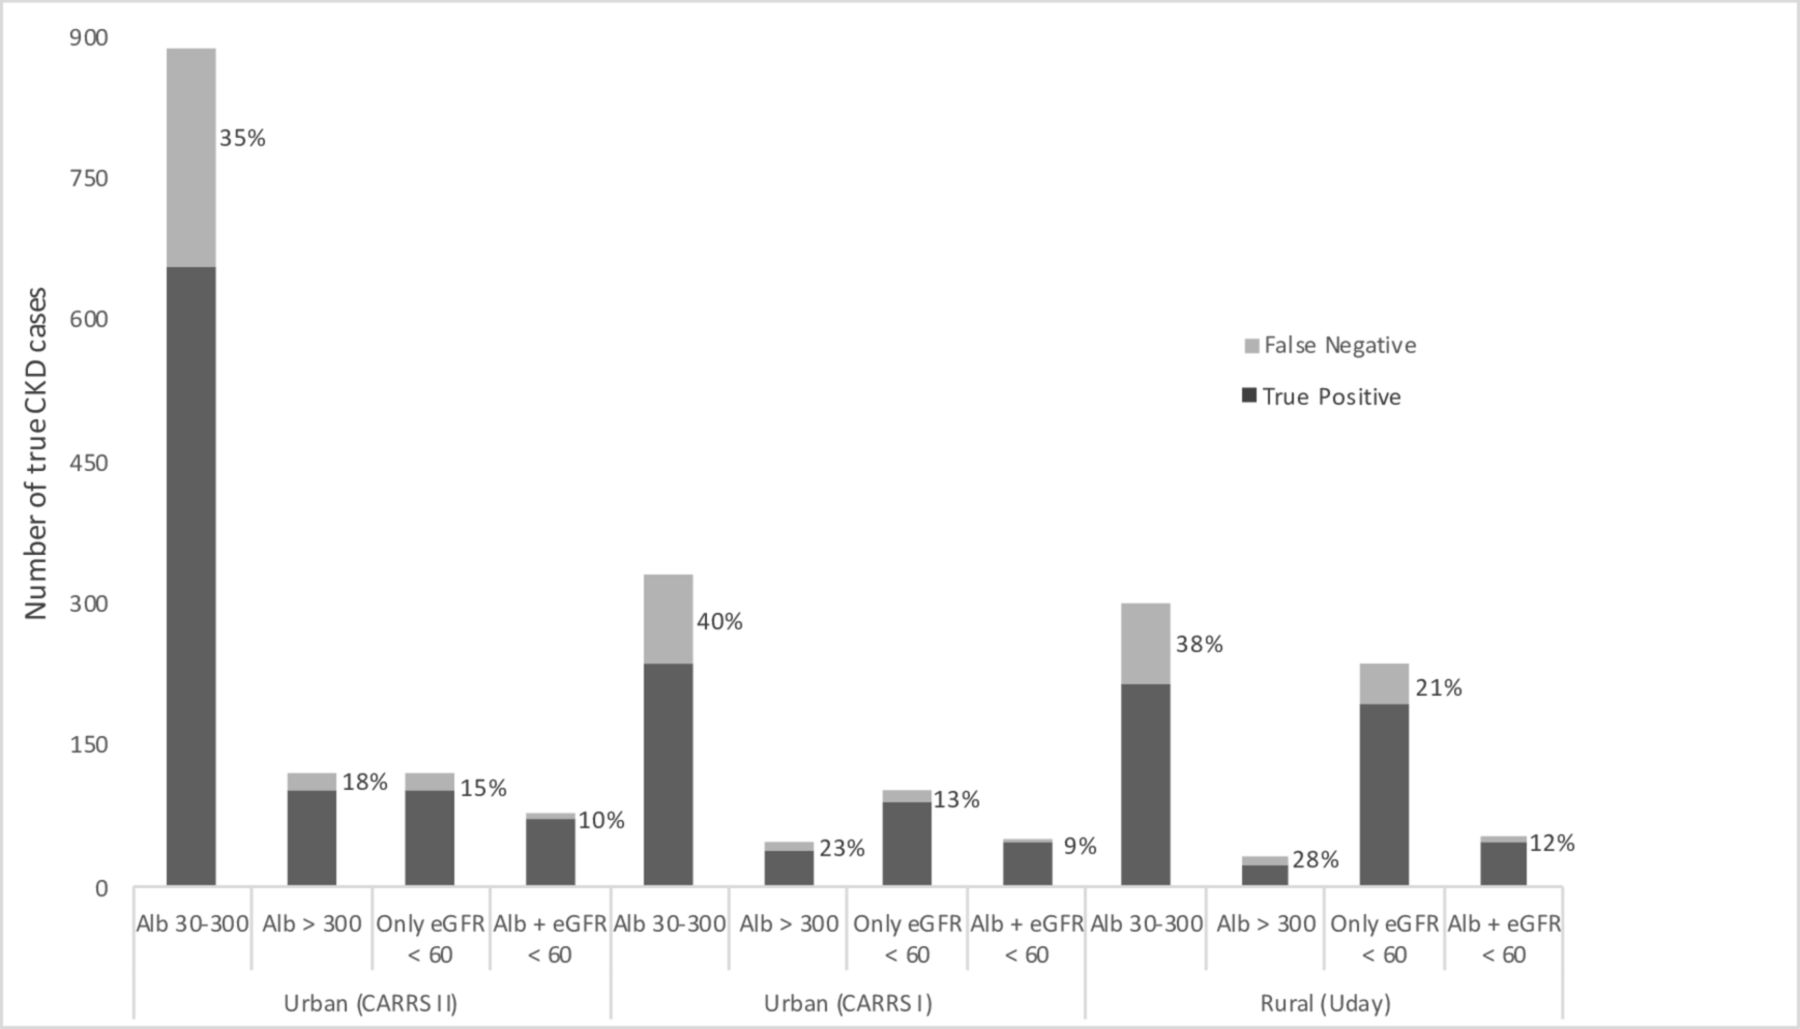
When applied to the CARRS-II development set, our model missed more persons with CKD who were: age <45 than persons with age >65 (61% vs 0%), unskilled than were professional (38% vs 27%) and who self-reported kidney stone than had diabetes or hypertension (48% vs 9% and 14%, respectively) (online supplementary table 2). Overall and across the strata, the model was more likely to miss persons with albuminuria alone compared with persons who had eGFR <60 mL/min/1.73 m2 and albuminuria (ie, KDIGO CKD stage 3A2 or above) (35% vs 10%). Figure 3 describes the CKD stages in the urban and rural datasets, in persons with CKD and those not captured by the model application; in both settings, persons with KDIGO CKD stage 3A2 or above were least likely to be missed.
Stages of CKD with model false negatives (%) in the urban and rural cohorts. The total bar height reflects the number of true CKD cases in each group. The percentage of model FN is shown in light grey. χ² p<0.001 for within-cohort differences in FN proportions across CKD stages. There was no significant difference in the proportions of model FN across cohorts. Alb, albuminuria; CKD, chronic kidney disease; eGFR, estimated glomerular filtration rate; FN, false negatives.
Model performance in the external validation cohorts
Since Model 3 without fasting plasma glucose (Model 3a) was the most parsimonious and required the least amount of individual measurements, we selected this model for external validation. The validation c-statistics in the urban CARRS-I and rural UDAY datasets were 0.74 and 0.70, respectively (table 2).
Discussion
Early detection of CKD that enables intensive clinical management to delay its progression relies on development of appropriate screening strategies that account for region-specific risk factor profiles. To create a model for such an approach, we used population-based data from India and found that measurement of three clinical parameters (body mass index, waist circumference and blood pressure) and point-of-care urine dipstick testing could identify persons to refer for confirmatory kidney disease testing. With 71% sensitivity and 95% negative predictive value, application of our model would reduce numbers of people needing CKD testing in comparison with an ‘all-comers’ approach. Thus, if incorporated within a community health worker-led screening strategy for other chronic diseases, this ‘two-step’ strategy could be an effective, feasible method for integrating CKD screening.
No consistent consensus exists in high-resource settings regarding screening recommendations for CKD. For example, the US Preventive Services Task Force does not state a clear position for or against population-based CKD screening, citing insufficient evidence,27 and the American College of Physicians recommends against screening asymptomatic adults.6 On the other hand, both Australian College of General Practitioners and UK National Institute for Health and Care Excellence recommend screening patients with a broad range of risk factors, including diabetes, hypertension, acute kidney injury, cardiovascular disease, or prostatic hypertrophy.28 29 Nephrology expert groups, such as KDIGO, encourage a similar approach, identifying persons with cardiovascular disease, diabetes and/or hypertension as high priority for screening and recommending consideration of persons who are older, have metabolic syndrome, or have a history of tobacco use.30 Implementation of this latter, targeted-screening strategy assumes regular interaction with a primary care system and its success hinges on careful ascertainment of a broad range of risk factors with a reliable association with CKD in the screened population. Even when primary care physicians attempt targeted screening, data suggest that they may miss components (eg, urine testing) or fail to refer based on a modest rise in serum creatinine.31 32
In low-resource settings, where patients do not have opportunities for consistent primary care interactions, the likelihood that a person with asymptomatic CKD is referred for testing on the basis of comorbidities or an incidentally drawn serum creatinine is substantially lower than in higher resource settings. Thus, a formal strategy to identify persons at risk for CKD may have high clinical value. There is recent momentum to task-shift to community health workers tooled with point-of-care screening strategies.33 In India, the government has developed an operational guideline for community health worker-facilitated screening for hypertension, diabetes and common cancers.34 Using this CKD screening strategy within such a context, in an Indian population where about 11% of persons have evidence of CKD on single time point testing and the cost of the more sensitive urine ACR testing is roughly 10-times the cost of a urine dipstick, our approach would have 60% lower screening costs than population-wide screening (out of 100 people, 35 would be required to obtain further blood and urine testing). Successful implementation of such an approach could identify a vast majority (90%) of patients at high risk for progression (ie, those with albuminuria and eGFR <60 mL/min/1.73 m2, classified as stage 3A2 or above)16 35 in a resource-limited setting where treatment for end-stage kidney disease is scarce and costly.2 Emerging treatments, such as sodium-glucose co-transporter 2 inhibitors, that potentially reduce the risk of progression of diabetic and non-diabetic CKD beyond that achieved by ACE inhibitors could further magnify the benefit for earlier CKD detection in LMICs.36 37
Though approaches to CKD screening have been studied in high-income settings,38 data from LMICs is sparse. Thakkinstian et al evaluated a strategy similar to ours in Thailand;13 they used community-based, cross-sectional data to develop a prediction score for presence of CKD from a pool of laboratory and physical exam measurements as well as self-reported medical history and medication use. Their final model included four predictors (age, diabetes, hypertension and self-reported history of kidney stones) and performed well internally (validated c-statistic 0.74) and in a South African cohort.39 Although our proposed model involves seven components rather than four, it does not require a medication review or a fasting serum glucose test to identify presence of diabetes, the latter of which can increase cost and complicate logistics. Other prediction models for prevalent or incidence CKD have been performed in high-income settings38 and have often required serum fasting glucose to define diabetes and/or travel to a clinic for assessment.40 41 Further, some of these studies restricted the definition of CKD to an eGFR of <60 mL/min/1.73 m2 and failed to include albuminuria,38 which is a sign of risk for progressive disease.42
Our model had slightly lower discrimination in the rural setting. Experts hypothesise that CKD in persons from rural areas may be more likely associated with non-traditional risk factors, such as occult infection or environmental exposures.43 We tested a roster of available non-traditional factors, including occupation as an unskilled labourer, water source and cooking fuel (as a measure of household air pollution); none added substantially to model discrimination. Our model also had lower sensitivity in younger age groups and in those with a kidney stone compared with persons with diabetes or hypertension. However, the false negative rate was 25% or lower for high-risk16 35 CKD across all strata.
Our study has additional limitations. We defined CKD using data from a single time point rather than repeated measures, which are recommended by expert groups to establish a CKD diagnosis.16 We do not have information on some non-traditional risk factors for CKD such as recurrent or chronic infection and low birth weight, although self-report of these purported risk factors is unlikely to be accurate. Last, we do not yet have outcome data to allow us to determine the long-term cost-effectiveness and health effects of our approach.
Nonetheless, our proposed region-specific model for India has acceptable discrimination and calibration, and unlike a majority of published studies,38 has been validated externally in an urban and rural setting using standardised and validated laboratory assays and data gathered at home visits using consistent protocols. We performed sensitivity analyses using alternate statistical methods and found consistent results. We selected our variable pool from large-scale population-based surveys that sought to capture sociodemographic non-communicable risk factors specific to the Indian population. Our strategy is straightforward, requires a limited number of measurements and does not necessitate a formal clinician visit for initial evaluation. As opposed to indiscriminate screening strategies, our two-step approach could potentially reduce healthcare system costs, including those associated with infrastructural needs.
In summary, we built a simple point-of-care screening strategy for likelihood of CKD in urban India, one that could be rapidly integrated into community health worker visits and enable accurate and earlier detection of CKD.
Data availability statement
No additional data are available.
Acknowledgments
We would like to thank the research and field staff involved in the development and execution of the CARRS-I, CARRS-II and UDAY studies, without which this analysis would not have been possible. The CARRS-I and CARRS-II studies are coordinated by CoE-CARRS (Centre of Excellence–Centre for Cardio-metabolic Risk Reduction in South Asia) at the Public Health Foundation of India, and UDAY is a collaboration between Public Health Foundation of India and Population Services International and Project HOPE.
References
Supplementary materials
Supplementary Data
This web only file has been produced by the BMJ Publishing Group from an electronic file supplied by the author(s) and has not been edited for content.
Footnotes
Handling editor Sanne Peters
Contributors CB, DK, MMR and SA were responsible for study design, data analysis and interpretation and manuscript development and revision. JH, YZ, NSV and RS were responsible for data analysis and manuscript revision. RG, PJ, SM, VM, MA, SP, KMN, NT and DP participated in data interpretation and manuscript revision.
Funding CB was supported by the National Institutes of Health (NIH) Fogarty Global Health Equity Scholar, grant number R25TW9338. SA was supported by National Institute of Diabetes and Digestive and Kidney Diseases (NIDDK) of the NIH, grant number 5K23DK101826. The CARRS-I and CARRS-II studies were supported by National Heart, Lung, and Blood Institute of the NIH, Department of Health and Human Services (Contract No. HHSN268200900026C) and United Health Group (Minneapolis, MN, USA). UDAY was supported by an educational grant under the Lilly NCD Partnership Programme.
Disclaimer The funding sources had no role in the study design, data collection and analysis, data interpretation, writing of the manuscript, or decision to submit the manuscript for publication.
Competing interests None declared.
Provenance and peer review Not commissioned; externally peer reviewed.