Article Text

Abstract
Background The major shifts in the global burden of disease over the past decades are well documented, but how these shifts have affected global inequalities in health remains an underexplored topic. We applied comprehensive inequality measures to data from the Global Burden of Disease (GBD) study.
Methods Between-country relative inequality was measured by the population-weighted Gini Index, between-country absolute inequality was calculated using the population-weighted Slope Inequality Index (SII). Both were applied to country-level GBD data on age-standardised disability-adjusted life years.
Findings Absolute global health inequality measured by the SII fell notably between 1990 (0.68) and 2017 (0.42), mainly driven by a decrease of disease burden due to communicable, maternal, neonatal and nutritional diseases (CMNN). By contrast, relative inequality remained essentially unchanged from 0.21 to 0.19 (1990–2017), with a peak of 0.23 (2000–2008). The main driver for the increase of relative inequality 1990–2008 was the HIV epidemic in Sub-Saharan Africa. Relative inequality increased 1990–2017 within each of the three main cause groups: CMNNs; non-communicable diseases (NCDs); and injuries.
Conclusions Despite considerable reductions in disease burden in 1990–2017 and absolute health inequality between countries, absolute and relative international health inequality remain high. The limited reduction of relative inequality has been largely due to shifts in disease burden from CMNNs and injuries to NCDs. If progress in the reduction of health inequalities is to be sustained beyond the global epidemiological transition, the fight against CMNNs and injuries must be joined by increased efforts for NCDs.
- health policy
- epidemiology
- indices of health and disease and standardisation of rates
- infections, diseases, disorders, injuries
This is an open access article distributed in accordance with the Creative Commons Attribution Non Commercial (CC BY-NC 4.0) license, which permits others to distribute, remix, adapt, build upon this work non-commercially, and license their derivative works on different terms, provided the original work is properly cited, appropriate credit is given, any changes made indicated, and the use is non-commercial. See: http://creativecommons.org/licenses/by-nc/4.0/.
Statistics from Altmetric.com
- health policy
- epidemiology
- indices of health and disease and standardisation of rates
- infections, diseases, disorders, injuries
Key questions
What is already known?
The Global Burden of Disease study estimates changes in disease burden for specific diseases, disease groups or risk factors for more than two decades from 1990 to 2017.
Indices to estimate relative and absolute inequality such as the Gini Index and the Slope Inequality Index have been used in the context of health, so far however have been applied only to national or sub-national data for disease specific analysis.
How changes in disease burden affects between-country global health inequality, however, remains a matter of debate.
What are the new findings?
Applying the Gini Index (for relative inequality) and Slope Inequality Index (for absolute inequality) to diseases and disease groups allows a deeper understanding of the extent, structure and evolution of global health inequality.
Absolute between-country inequality of all causes of disease decreased between 1990 and 2017, while relative inequality remained stable.
On a more granular level, our data can also help to assess areas of concern, such as disease groups for which inequality has increased in recent years, and can highlight achievements, where progress has been made towards a reduction of global health inequality.
What do the new findings imply?
If progress in the reduction of health inequality between nations is to be sustained beyond the global epidemiological transition, the fight against communicable disease and injuries must therefore continue and be joined by increased efforts for NCDs.
Introduction
Major shifts have taken place in the global burden of disease over the past 25 years. In the literature, disagreement exists on how these shifts have affected health inequality on a global level.1–5 Here, we apply two univariate measures of inequality—the Gini Index (for relative inequality), and the Slope Inequality Index (SII; for absolute inequality)—to age-standardised country-level disease burden data from the Global Burden of Disease (GBD) study, to quantify changes in global between-country inequality in disease burden from 1990 to 2017.6
The Gini Index and SII are widely used to measure inequality in the distribution of economic resources such as income or wealth.7 8 To our knowledge, in the context of health, these measures have previously been applied only to national or sub-national data, within disease-specific analyses, and to mortality and life expectancy data.9–13
By applying them, for the first time, to disease burden data measured in disability-adjusted life years (DALYs) for all disease groups and across all countries, we arrive at estimates for overall global health inequality that have not previously been available.
With this study we aim to identify and add evidence on the key drivers of global health inequality. Health inequality has been defined by Braveman as a ‘difference in health or in the most important influences on health that could potentially be shaped by policies; it is a difference in which disadvantaged social groups […] systematically experience worse health or greater health risks than more advantaged social groups’.14
In this analysis, we aim to add to the evidence on how major epidemiological events such as the HIV epidemic, war and natural disasters are affecting those differences in health, and how the relative health status of advantaged and disadvantaged countries has changed over time. Quantifying global health inequality can help to assess progress, or the lack thereof, and help to identify challenges and opportunities for reducing global health inequalities.
Methods
A range of statistical methods can be employed to analyse disparities in the distribution of health, such as life expectancy, disease burden, treatments and research efforts.9 15–17 We used the population-weighted Gini Index to measure relative health inequality, and the population-weighted SII to measure absolute inequality. We calculated these indices for country-level disease burden data measured in age-standardised DALYs per capita, as provided by the GBD study, for every year in the time period 1990 to 2017.6 18
The DALY is a composite measure for population health, calculated by summing years of life lost to premature death and years of healthy life lost due to disability.6 Years of life lost to premature death are calculated based on a theoretical life expectancy of 86 years. Years of healthy life lost due to disability are calculated by multiplying the number of years lived with a specific health condition with the respective disability weight which is a factor ranging from 0 to 1, representing the severity of the disability associated with this condition. DALYs are generally considered the best available measure for overall population health.6
As our focus is health inequality due to differences in health systems, risk factors and socioeconomic factors, we used age-standardised DALYs to minimise confounding by differences in the age structures of different populations. Age-standardised DALYs, adjust country-level disease burden for the country’s population age structure by weighting disease burden in each age category to fit a ‘standard population’ (the GBD study designs its own standard population).6 We calculated the population of the countries in each year from the number of deaths in a country and the relative death rate across all ages.
We used GBD disease classification of level 1 cause groups—communicable, maternal, neonatal and nutritional diseases (CMNNs), non-communicable diseases (NCDs) and injuries—and the 21 level 2 cause groups. For some level 2 disease groups, we moved to a more granular level of classification in order to increase clarity. For example, instead of assessing the level 2 classification ‘A.1 HIV/AIDS and sexually transmitted infections’, we considered the two level 3 categories it consists of, namely ‘A.1.1. HIV/AIDS’ and ‘A.1.2. sexually transmitted diseases excluding HIV’.
The Gini Index is derived from the Lorenz curve, which plots for each country the cumulative share of the global disease burden against the cumulative share of the world population, ordered by ascending DALY rate. The Gini Index is calculated as twice the area bounded by the Lorenz curve and a theoretical egalitarian distribution, represented as the function y=x (online supplementary appendix, figures 1 and 2). When applied to the DALY rate, the Gini Index expresses the average relative difference in the disease burden between any two of the 195 countries included in the dataset. It can range from 0 in total equality, where all countries exhibit the same disease burden per capita, to 1 in total inequality, with all disease burden concentrated in a single country.9 We used the population-weighted Gini Index to account for the heterogeneity of countries with respect to population size. Without weighting for population size, countries with a small population would influence the value of the Gini Index as much as countries with a large population.19
Supplemental material
The derivation of the SII is based on the Pen’s Parade. The Pen’s Parade is derived from ranking all countries by their DALY rate from highest to lowest, with their share of the world’s population as the width of a ‘step’ on the horizontal axis. The SII is the coefficient (slope) of the linear regression of this Pen’s Parade (online supplementary appendix, figures 3 and 4), and can be interpreted as a measure for the average absolute difference in DALY rates between countries.20
The Gini Index and the SII are univariate measures of inequality which capture the disparity in the distribution of one specific resource—in our case health. Bivariate measures of inequality, by contrast, capture how two different resources—(eg, income and health) are related to each other.21 We focus on univariate measures of inequality, as we aim to capture inequality of health per se, rather than the relationship between health and other resources.
In order to capture the uncertainty in the underlying data set, we additionally calculated the upper and lower uncertainty bound based on the 95% CI in the GBD data. For each country in each year, we chose the value within the 95% CI closest to the global population-weighted median for the low-inequality scenario (lower bound), and the value within the 95% CI furthest from the median in the high inequality scenario (upper bound). Thereby, the bounds express the highest and lowest value the inequality indicators can reach based on the 95% CI in the GBD data.
All calculations were conducted in R V.3.5.0, using the ineq package V.0.2–13.22 23
Patient and public involvement statement
No patients or the general public were involved in the analysis.
Results
The change in Gini Index and the SII for all-cause, CMNN, NCD and injuries for DALY rates between 1990 and 2017 are visualised in figures 1 and 2 . Table 1 summarises the respective numbers. The graphical representation of the distribution of the disease burden (measured as age-standardised DALY rate per 100 000) is shown as population boxplots in the online supplementary appendix, figures 5 and 6.

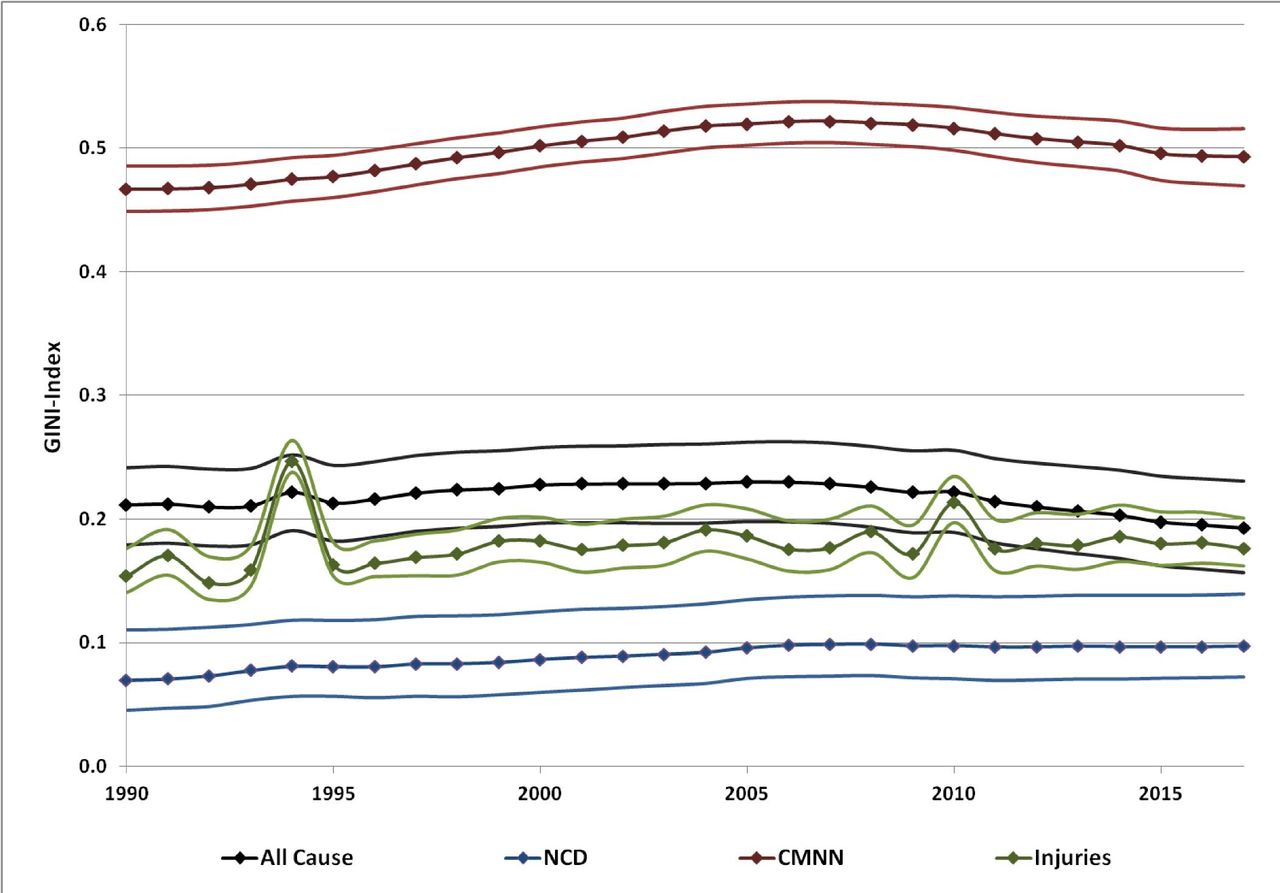
Gini Index for all-cause and level 1 cause group DALY rates.The Gini Index was highest for CMNNs and lowest for NCDs. For both all-cause DALY rate and CMNNs, Gini increased until 2006/2007, and decreased subsequently until 2017. For injuries, peaks can be seen in 1994 due to the genocide in Rwanda and in 2010 due to the earthquake in Haiti. CMNN, communicable, maternal, neonatal and nutritional diseases; DALY, disability-adjusted life years lost; NCD, non-communicable diseases.

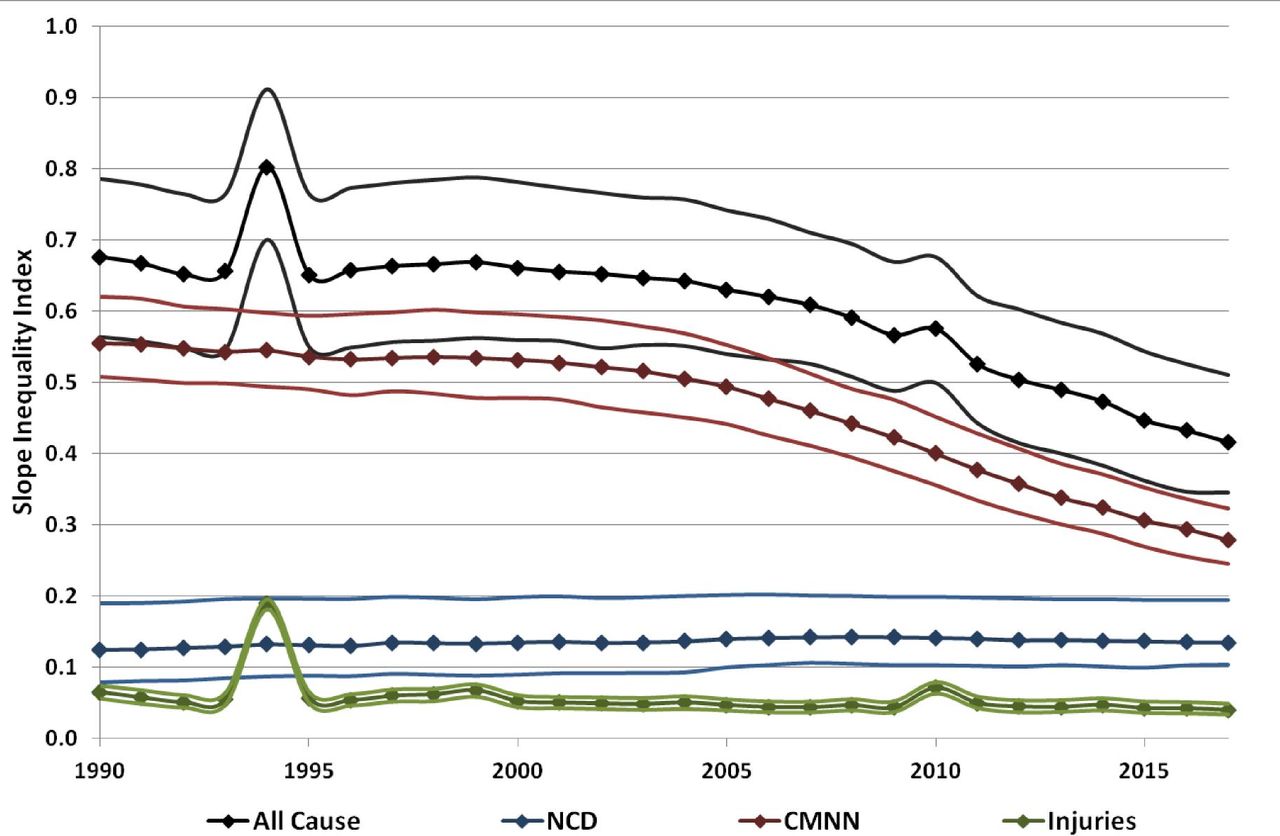
Slope Inequality Index for all-cause and level 1 cause group DALY rates. SII was highest for all-cause DALYs than for any of the individual level 1 cause groups and decreased between 1990 and 2017. Similarly for CMNN, SII decreased following the same trend as seen for all-cause DALY SII. The SII for NCDs showed a slight increase whereas for injuries a slight decrease was marked. For injuries, peaks can be seen in 1994 due to the genocide in Rwanda and in 2010 due to the earthquake in Haiti. CMNN, communicable, maternal, neonatal and nutritional diseases; DALY, disability-adjusted life years lost; NCD, non-communicable diseases.
Gini Index and SII for all-cause DALYs, CMNNs, NCDs and injuries between 1990 and 2017
The Gini Index for all-cause DALY rate increased between 1990 (0.21 (0.18 to 0.24)) and 2008 (0.23 (0.19 to 0.26)), followed by a decrease starting in 2009 to 0.19 (0.16 to 0.23) in 2017 (figure 1). Relative inequality in the injuries and NCD cause groups was much lower than in the CMNN cause group. The Gini Index for CMNN increased from 0.47 (0.45 to 0.49) in 1990 to 0.52 (0.50 to 0.53) in 2010, followed by a decline to 0.49 (0.47 to 0.52) by 2017. The Gini Index increased steadily for NCDs between 1990 (0.07 (0.05 to 0.11)) and 2017 (0.10 (0.07 to 0.14)), and for injuries (0.15 (0.14 to 0.18) to 0.18 (0.16 to 0.20)). For injuries, local peaks can be seen in 1994 due to the genocide in Rwanda and in 2010 due to the earthquake in Haiti (figures 1 and 2).
The development of the Gini Index for the more granular level 2 disease groups for 1990 and 2017 is shown in figure 3. Unlike the overall trend in CMNN, HIV/AIDS and nutritional deficiencies showed a substantial decrease in Gini Index. For NCDs, a decrease in Gini Index was solely observed for chronic respiratory disease and neoplasms.
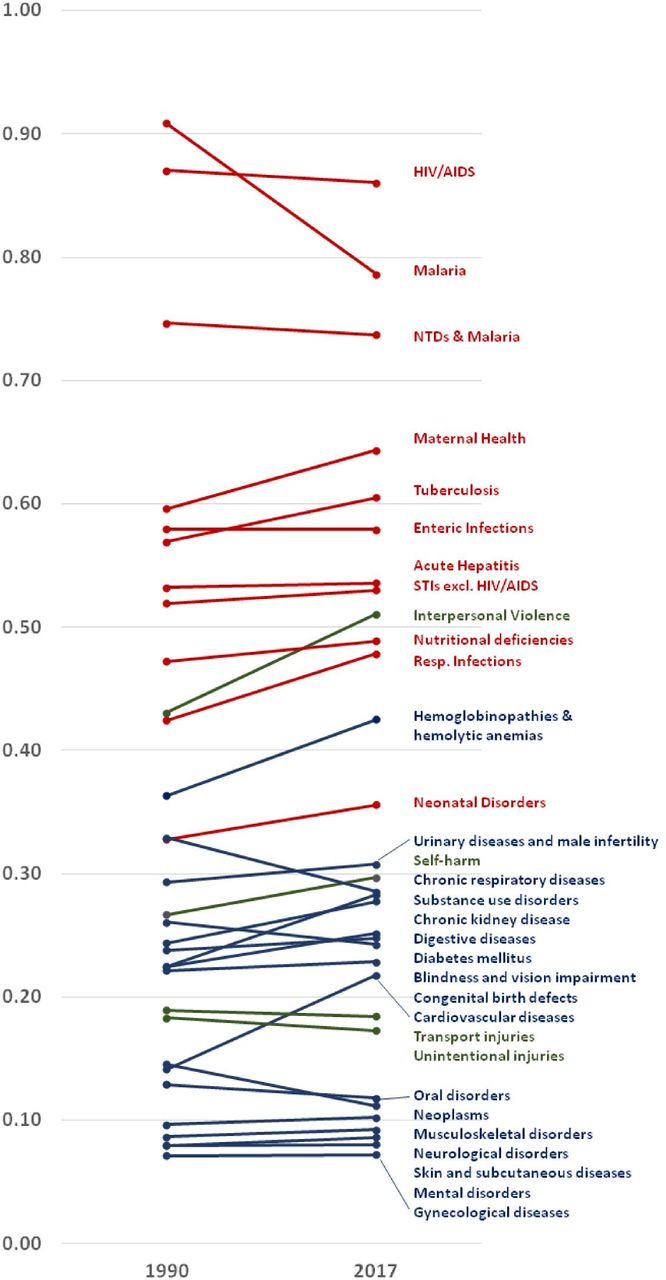
Changes in Gini Index for level 2, and selected level 3 disease groups between 1990 and 2017. Unlike HIV/AIDS and malaria, chronic respiratory diseases, enteric infections and neoplasms, the Gini Index of the subgroups followed the general trend of increasing relative inequality. STI, sexually transmitted infection, NTD, neglected tropical diseases.
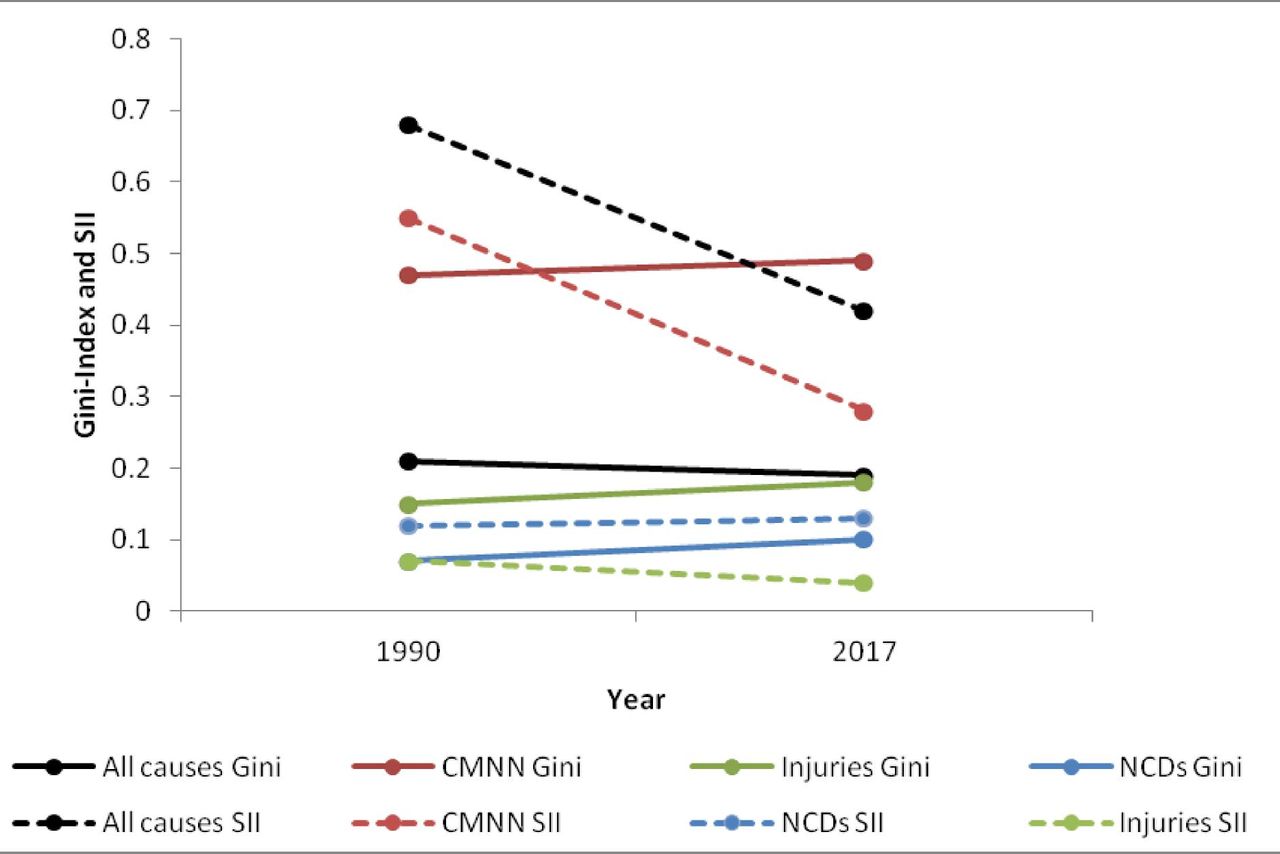
Trends in Gini and SII between 1990 and 2017 for all causes, CMNNs, injuries and NCDs. Subgroup analysis reveals an increase in relative inequality and a decrease for absolute inequality for CMNNs and injuries between 1990 and 2017. CMNN, communicable, maternal, neonatal and nutritional diseases; NCD, non-communicable diseases; SII, Slope Inequality Index.
In contrast, absolute inequality, as measured by the SII, was higher for all-cause DALYs than for any of the individual level 1 cause groups, reflecting the higher absolute between-country differences in all-cause DALY rates than in DALY rates for individual disease groups (figure 2). The SII decreased markedly for all-cause DALY rates from 0.68 (0.56 to 0.79) in 1990 to 0.42 (0.35 to 0.51) in 2017. For the CMNN cause group, similarly, SII decreased from 0.55 (0.51 to 0.62) to 0.28 (0.24 to 0.32), following a very similar curve to the all-cause DALY SII. While the SII for NCDs remained essentially unchanged (from 0.12 (0.08 to 0.19) to 0.13 (0.10 to 0.19)), the SII for injuries fell significantly (from 0.07 (0.06 to 0.07) to 0.04 (0.03 to 0.05)). Excluding outliers from the dataset (Rwanda 1993 and 1994, Haiti 2010) showed that the SII in all-cause DALYs and injuries followed the general trend of the respective curves, explaining the severe effect of these humanitarian disasters on absolute inequality of all-cause DALYs.
Discussion
Despite global age-standardised DALY rates steadily decreasing both for all-cause disease burden and for level 1 cause groups (table 1), absolute inequality in disease burden remains high. In countries with the lowest burden of disease per capita, less than 20% of the potential healthy lifetime of individuals was lost to ill health in 2017, whereas more than 70% of potential healthy lifetime was lost in countries with the highest burden of disease per capita (online supplementary appendix, figure 3). The SII of 0.42 (0.35 to 0.51) for all-cause DALYs in 2017 can be interpreted as meaning that for every decile one moves down in global population ranked by increasing health burden, on average an additional 4% of healthy life time is lost.
Relative global health inequality, measured by the Gini Index, is also high. The Gini Index for disease burden was lower in 2017 (0.19 (0.16 to 0.23)) than in the peak period between 2000 and 2008 (0.23 (0.19 to 0.26)) as well lower than in 1990 (0.21 (0.18 to 0.24)), representing a progress of 2% towards equality on the scale of total inequality to total equality, over 27 years. Moreover, the small magnitude of this change casts doubt on the overall plausibility that a relevant reduction in relative inequality has occurred: in economics, a threshold of 3% (the ‘Atkinson salience criterion’) has been used to determine the significance of temporal changes in the Gini Index for economic resources such as income24 25 which the observed changes in Gini Index for all-cause DALYs did not exceed. As a point of comparison, inequality in healthy lifetime is nearly as high as income inequality among individuals in Organization for Economic Cooperation and Development (OECD) countries (Gini Index 0.32 in 20148) but lower than income inequality globally (Gini Index 0.65 in 201326).
Relative and absolute inequality have exhibited diverging trends (figures 1 and 2). While the Gini Index did not change significantly from 1990 (0.21 (0.18 to 0.24)) to 2000–2008 (0.23 (0.20 to 0.26)) to 2009–2017 (0.19 (0.16 to 0.23)), absolute inequality fell slowly between 1990 and around 2006 (0.68 (0.56 to 0.79) to 0.62 (0.53 to 0.73)) subsequently decreasing more rapidly until 2017 to an SII of 0.42 (0.53 to 0.51). Absolute inequality fell faster and more pronouncedly than relative inequality.
We observed decreasing absolute inequality with essentially unchanged relative inequality. Arithmetically, this combination occurs when the disease burden decreases at similar rates in countries with high and low baseline burdens, resulting in unchanged relative inequality, but falling absolute inequality.27 Braveman’s ethical framework does not specifically distinguish how absolute versus relative inequality metrics reflect on health (in)equity. However, the depicted decrease in absolute inequality may represent a ‘levelling up’ in Braveman’s ethical framework, while the lack of reduction in relative inequality may reflect Braveman’s caution that pursuing equity requires ‘reducing unfair disparities as well as meeting acceptable standards’.28
Cause group sub-analyses
Absolute and relative inequality is highest for CMNNs, and lowest for NCDs and injuries (table 1).
Considering the Gini indices for individual cause groups shows that despite the marginal decrease in Gini Index for all-cause DALYs, discussed above, relative inequality has risen in each of the three ‘level 1’ cause groups individually (figures 3 and 4). In contrast, absolute inequality decreased markedly for CMNNs (SII 0.55 (0.51 to 0.62) in 1990 to 0.28 (0.24 to 0.32) in 2017), and less markedly for injuries (SII 0.07 (0.06 to 0.07) in 1990 to 0.04 (0.03 to 0.05) in 2017), but increased for NCDs (SII 0.12 (0.08 to 0.19) in 1990 to 0.13 (0.10 to 0.19) in 2017) (figure 4).
The finding of a reduction in all-cause relative inequality 1990–2017 (figures 3 and 4) despite increases in the relative inequality for each individual level 1 subgroup (NCDs, CMNNs and injuries) may be explained by the fact that CMNNs have greater relative inequality across years, and 9% of global all-cause DALYs have shifted from this group to NCDs which had a lower baseline inequality level (table 1 and figure 4). This suggests that the decrease in overall, all-cause relative health inequality seen between 1990 and 2017 was driven mainly by a global shift of the disease burden from CMNNs and injuries to NCDs, and not by declining relative inequality for either CMNNs, injuries or NCDs. What derives from this interpretation is that as NCDs take an increasing proportion of the global burden of disease, the slight decrease observed for all-cause relative inequality over the past 25 years may stall or reverse unless ways are found to tackle inequality in the distribution of NCDs.
Analysis of inequality trends on the level of the more detailed level 2 cause groups of the GBD study revealed substantial heterogeneity within the three major level 1 cause groups (figure 3). For NCDs, relative inequality has decreased for some level 2 cause groups, such as chronic respiratory disease and neoplasms, but this has been offset by an increase in inequality for others, most markedly cardiovascular disease. In certain disease groups, further disaggregation is necessary to discern relevant trends: For example, within the group of urogenital, blood and endocrine disorders, relative inequality has increased markedly for diabetes, while it has decreased for most haematological disorders (data not shown).
The marginal rise in relative inequality for NCDs may be interpreted as follows. While for some NCDs, raw incidence figures are higher in high-income than in middle-income and low-income countries, this is not the case when using age-standardised DALY rates, as we do in our analysis: when adjustments for the different age structures of populations are made, the disease burden per capita caused by NCDs is higher in low-income and middle-income countries than in high-income countries (online supplementary appendix, figure 7). While all income groups have seen reducing age-standardised NCD DALY rates, progress is more pronounced in high-income countries than in low-income and middle-income countries (online supplementary appendix, figure 7). This implies that the epidemiological transition does not necessarily have an equalising effect on the global NCD burden. To the contrary, the persistent absolute and relative inequality in the distribution of NCDs across the globe disadvantages the same countries which are also more generally deprived. Further reductions in DALY rates for CMNN and Injuries would be expected to eventually manifest in lower relative inequality (Gini values) for these groups—despite rises from 1990 to 2017 (table 1, figure 1)—if and when the rate of decrease in the highest-burden countries equals or exceeds that in lower-burden countries.27
Policy implications
As discussed above, the marginal decline in Gini Index since 1990 has been largely driven by shifts between major disease groups and decreases in absolute inequality have been largely driven by a decrease of the average global DALY rate. In contrast, there have not been significant declines in relative inequality for the three major cause groups considered individually.
For NCDs, absolute and relative inequality levels have been stagnant at the global level, and have increased for the cardiovascular disease and diabetes subgroups. As NCDs represent a growing proportion of the global burden of disease, global health inequality will increasingly be determined by inequality in NCDs.
In high-income countries, progress in the prevention and control of NCDs has been made both through preventive efforts such as effective tobacco control policies, increased intake of essential nutrients and increasing leisure-time physical activity and through easily scalable medical interventions, such as treatment of hypertension, dyslipidaemia and hyperglycaemia.29 Such efforts in the prevention and control of NCDs must be scaled up, strengthened and adapted to the specific needs of low-income and middle-income countries if overall progress in the reduction of cross-country health inequality is to be sustained beyond the global epidemiological transition.29 30 Furthermore, increased efforts have to be made in tackling risk the NCD risk factors of household and ambient air pollution, which are of particular high relevance in low and middle income countries.18 31 32 However, significant research and funding gaps exist for NCD programme implementation in low- and middle-income countries.33 34 NCDs received less than 2% of development assistance for health in 2016 (authors’ own calculation, using data reported by the Institute for Health Metrics and Evaluation).35 While data on domestic NCD funding is scarce, in 2013, 50% of countries did not have a national NCD policy with a budget for implementation.36 The WHO has argued that the cost of inaction exceeds the cost of action in economic terms, and that a basic basket of public health interventions is cost-effective and affordable for all countries—costing less than US$0.20 per person per year in low-income countries, and US$0.50 in middle-income countries.37 38
At the same time, in order to reduce inequality, efforts to reduce CMNN burden must at minimum sustain the rate of decrease seen over the last 27 years. Political commitment continues to be key: for example, funding for the global response to HIV/AIDS will need to increase by about a third in the coming years in order to stem the epidemic by 2030.39
Limitations
Since we use country-level disease burden data, our analysis does not capture within-country inequality which can be substantial17 40: for example, one study using height of children as an anthropometric indicator of general health found that between-country inequality comprises 26%, and within-country inequality 74% of total global health inequality.17
While DALYs are a widely used measure of general health status, their calculation relies on a number of methodological assumptions and value judgements which are subject to debate.6 41 Similarly, while the GBD study is generally considered the most comprehensive and reliable source for global DALY data, there are limitations to its data, such as unreliable and missing data, in particular for low-income and middle-income countries.6
There are a number of inherent limitations to the Gini Index and the SII. They are univariate measures of inequality, implying that they provide no information on correlations of disparities in health with other social indicators.14 Moreover, the Gini Index and the SII do not demonstrate transfer sensitivity, meaning that changes at the upper end of the distribution are given the same weight as changes at the lower end of the distribution.6 The Gini Index in particular is sensitive to the number of observations affected by a change which can make it disproportionately sensitive to changes around the median (where the number of observations is generally higher), meaning that the effect of changes in the DALY burden of countries most deprived in health terms may be under-weighted.7
Lastly, there are limitations to our comparison of least-healthy to most-healthy, rather than a comparison based on wealth. As Braveman notes: ‘abandoning the comparison between social strata in favour of a comparison with the healthiest runs the risk [of removing] distributive justice issues from consideration and hence from the policy agenda’.14
Conclusions
Despite considerable progress in reducing disease burden and absolute inter-country inequality over the past 25 years, absolute inequality in health across countries remains high and relative inequality in age-standardised all-cause DALY-rates has decreased only marginally since 1990. The reduction in absolute global inter-country health inequality during the past 25 years has been largely a resulst of a decrease in the total global disease burden, rather than of changes to the distribution of the disease burden across countries. Minor reductions in relative global inter-country health inequality observed since 2008 have been driven by a global shift from communicable diseases to NCDs and injuries, while inequality has remained stable or risen for these three cause groups considered separately. If progress in the reduction of health inequality between nations is to be sustained beyond the global epidemiological transition, the fight against communicable disease and injuries must therefore continue and be joined by increased efforts for NCDs.
References
Footnotes
Handling editor Seye Abimbola
Contributors FS and PvP conceived the idea for the paper. JMS and FS did the calculations. FS, DG, PvP and JMS interpreted the data and wrote the paper. All authors have read the final manuscript and agreed to its publication.
Funding The authors have not declared a specific grant for this research from any funding agency in the public, commercial or not-for-profit sectors.
Competing interests None declared.
Patient consent for publication Not Required
Provenance and peer review Not commissioned; externally peer reviewed.
Data availability statement All data relevant to the study are included in the article or uploaded as supplementary information.