Article Text

Abstract
Background This study proposes a framework to address conceptual concerns with the standard indicator of unmet need for contraception. We define new point prevalence measures of current status (CS) unmet need and CS unmet demand, by linking contraceptive behaviours to pregnancy exposure and to women’s future contraceptive intentions. We explore the difference between standard and CS unmet need and estimate the proportion of women with CS unmet demand, who may be more likely to adopt contraception.
Methods We use Demographic and Health Survey data from 46 low-income and middle-income countries released between 2010 and 2018. We assess differences in women’s classification between standard and CS unmet need indicators and estimate the percentage of women with CS unmet demand for contraception, defined as the percentage of women with CS unmet need who intend to use contraception in the future.
Findings We find substantial country-level differences between standard and CS estimates of unmet need, ranging from −8.3% points in Niger to +11.1% points in Nepal. The average predictive value of the standard measure across the 46 countries for identifying prevalent cases of unmet need is 53%. Regardless of indicator (standard or CS), only half of women with unmet need intend to use contraception.
Interpretation The results of this study suggest that the standard measure of unmet need has low predictive value in identifying women with current unmet need. Thus, the standard indicator does not reflect a prevalence estimate of unmet need.
- unmet need for family planning
- demographic and health surveys
- contraceptive intentions
- contraceptive behaviors
This is an open access article distributed in accordance with the Creative Commons Attribution Non Commercial (CC BY-NC 4.0) license, which permits others to distribute, remix, adapt, build upon this work non-commercially, and license their derivative works on different terms, provided the original work is properly cited, appropriate credit is given, any changes made indicated, and the use is non-commercial. See: http://creativecommons.org/licenses/by-nc/4.0/.
Statistics from Altmetric.com
- unmet need for family planning
- demographic and health surveys
- contraceptive intentions
- contraceptive behaviors
Key questions
What is already known?
Unmet need for contraception is related to high levels of unwanted fertility in low-income and middle-income countries and therefore provides a benchmark for family planning programs.
The algorithm for the standard indicator for unmet need is complex and does not reflect the percentage of women at risk of unintended pregnancy who are not using contraception at any given time.
What are the new findings?
The standard indicator deviates from a point prevalence estimate (differences range from – 8% points to +11% points according to country) and has little predictive value in identifying women with current unmet need for contraception.
Only half of women who have current unmet need for contraception intend to use contraception in the future, suggesting that lack of demand substantially contributes to unmet need.
What do the new findings imply?
A point prevalence measure of unmet need can inform family planning programme about the number of women with unmet need at a particular point in time and place.
A complementary measure of unmet demand for contraception is helpful in identifying women at risk of unintended pregnancy who are ‘interested and willing’ to use contraception, who represent a target population in need of contraceptive services.
Introduction
Unmet need for contraception is an essential metric for monitoring reproductive health policy and programming. It is also used as a building block for estimating the proportion of women whose need for family planning is satisfied by modern methods, an indicator (3.7.1) to measure progress towards the Sustainable Development Goal number 3.1 2 A primary goal for meeting women’s or couples’ need for contraception is to prevent unintentional pregnancies, which directly affect maternal morbidity and mortality.3 A series of studies has shown substantial progress towards reducing the global proportion of women with unmet need in the last two decades.4 5 Such reductions by the use of contraception are estimated to have averted 38 maternal deaths for every 100 000 women of reproductive age in 2008.6 Projections indicate that complete elimination of global unmet need comprising an estimated 214 million women in 2017 would prevent another 29% of maternal deaths.7
Projections of contraceptive unmet need, however, are clouded with uncertainty due to conceptual and methodological weaknesses in measurement. Peterson and colleagues reported a 14% point difference in two global estimates of unmet need,8 evaluated at 26% of women of reproductive age by Darroch and Singh5 and 12% by Alkema and colleagues.4 These differences contribute to substantial variation in estimates of the number of women with unmet need, ranging from 134 million to 222 million, which draws attention to the different specifications of the measure.8
While the concept is simple: non-use of contraception among women who could become pregnant without wanting to do so, the construct is complex as the standard measure of unmet need does not represent a point prevalence.9 10 Specifically, the definition considers some women who are not currently at risk of becoming pregnant as having an unmet need for contraception. These include pregnant women whose pregnancy was unintended as well as some women who have had no sexual activity for an extended period of time. This latter concern is reflected in studies reporting that the most common reason for unmet need is that women indicate they do not need contraception because they are not sexually active.11 As shown by Bradley and Casterline, the exclusion of these women substantially reduces the estimate of unmet need.10 In the other direction, a few women who may have an unmet need are not captured in the standard definition. This is the case of postpartum amenorrhoeic women who will ovulate before their menses return, especially if they are not breastfeeding.12 In the existing definition, postpartum amenorrhoeic women are classified as having no need for contraception in the 24 months postdelivery unless their last birth was unintended.13 Various authors have challenged this classification,14 arguing that all women in the postpartum period have a need for contraception, regardless of pregnancy risk15 or that postpartum women have a need for contraception unless they are otherwise protected by postpartum abstinence or practicing the lactation amenorrhoea method (LAM).16 Comparing a 6-month with a 24-month postpartum cut-off, Bradley and Casterline noted that the standard unmet need algorithm is ‘highly sensitive to the choice of duration of postpartum amenorrhoea’.10 Using a current status (CS) measure of unmet need over the full 24 months postpartum period, which accounts for LAM and abstinence, Rossier and colleagues found lower estimates of unmet need than the standard retrospective measure (27% vs 32%).14 Further restrictions to sexually active and non-amenorrhoeic postpartum women, yield even lower estimates.17
In addition to its deviation from a point prevalence measure, the most important critique of the standard measure of unmet need is its inability to distinguish fertility intentions from contraceptive motivations.9 The assumption underlying the construct is that exposure to unintended pregnancy due to contraceptive non-use equates to an unfulfilled demand for contraception that can be addressed by improving knowledge and access. This assumption fails to recognise that contraceptive motivation may not align with fertility intentions. A number of demographers have formalised the distinction by differentiating readiness to use contraception from willingness to use, although they generally refer to willingness as attitudes towards contraception rather than intentions to use.18 19 The few studies assessing contraceptive intentions show that a sizeable proportion of women classified as having unmet need indicate that they have no intention of using contraception in the future20 and while little attention has been given to contraceptive intentions as opposed to pregnancy intentions, existing prospective studies suggest a high predictive value of contraceptive intentions on subsequent use.21 22 For instance, using Demographic and Health Survey (DHS) panel data from Morocco, Curtis and Westoff showed that 76% of women who intended to use contraception within the next 12 months reported subsequent use, versus 30% of women who did not intend future use.22 This transition from intention to use can be understood using Prochaska and DiClemente’s transtheoretical model of change, which posits that behavioural change occurs through different stages, moving from precontemplation, to contemplation and preparation, to action and maintenance.23
Building on previous research exploring departures of the standard demographic unmet need indicator from a point prevalence estimator,10 17 the current study seeks to comprehensively address some of these methodological challenges by proposing a new point prevalence measure of unmet need for contraception (CS unmet need) and by developing a point prevalent measure of unmet demand for contraception (CS unmet demand). CS unmet need aims to identify non-contraceptive users who are at risk of unintended pregnancy at the time of the survey. CS unmet demand is intended to distinguish women at risk who are ‘interested but unwilling’ to use contraception from those who are ‘interested and willing’.
Methods
We propose a framework to guide the construction of our new indicator of CS unmet need for contraception by identifying non-users of contraception at risk of unintended pregnancy at the time of the survey. The shift in paradigm from the standard definition (which cumulates unmet need going back as far as 2 years and 9 months for postpartum amenorrhoeic women whose last birth was unintended, 9 months for women whose current pregnancy is unintended and current unmet need among women who have not been pregnant in the last 2 years13) to CS unmet need is illustrated by the differences between figure 1A and B. Particular points of divergence are the linkages between pregnancy intentions, pregnancy exposure (based on sexual activity, pregnancy and fecundity status) and contraceptive behaviour. Specifically, the standard measure first distinguishes contraceptive users and non-users and further classifies contraceptive non-users as having an unmet need if (a) they have a current unintended pregnancy (b) are postpartum amenorrhoeic and had an unintended birth in the last 2 years or (b) are not otherwise infecund and are not trying to have a birth in the next 2 years (figure 1A). We alternatively propose anchoring our algorithm on the basis of ‘pregnancy risk exposure’, rather than on ‘contraceptive use’ to prevent classifying women who are currently not exposed to the risk of unintended pregnancy as having unmet need for contraception. Based on the definition used in population-based studies conducted in the USA and Europe,24 25 women exposed to the risk of unintended pregnancy are fecund, sexually active in the last 3 months, non-pregnant and not trying to conceive in the next 12 months (table 1). Among these women, we classify non-contraceptive users as having current unmet need for contraception (figure 1B). In addition to pregnancy exposure and contraceptive behaviour, we consider women’s motivations to use contraception in the measure of CS unmet demand, which is a subset of women with CS unmet need who intend to use contraception in the future.

(A) Unmet need using standard algorithm. (B) Unmet need using current status algorithm. FP, family planning; LAM, lactation amenorrhoea method.
Description of standard unmet need, current status (CS) unmet need and CS unmet demand
Study population
This secondary analysis uses DHS data collected among women aged 15–49 years who are asked questions about their sociodemographic characteristics, contraceptive and reproductive histories, their future intentions to use contraception, their breastfeeding practices and fertility preferences. A total of 46 surveys are included in the analysis (see table 2) corresponding to the latest DHS round in each country released between 2010 and 2018 for which information on sexual activity among unmarried women was collected. We used data sets based on VI and VII versions of the DHS questionnaire, which contain detailed information about feeding practices necessary for LAM classification. As analyses are conducted on deidentified publicly available data (https://dhsprogram.com), this research is IRB-exempt by the Johns Hopkins Institutional Review Board.
Estimates of unmet need (percent of women) by standard definition vs proposed current status (CS) unmet need definition for 46 recent DHS surveys, by region and country
Patient and public involvement
As stated above, this study is a secondary data analysis using deidentified publicly available data. Patients were therefore not involved in this research.
Measures
We consider the two indicators of unmet need described above: our CS measure and the standard estimate.12 The construction of these measures follows the algorithms presented in figure 1A,B. Both indicators rely on the same information with a few exceptions: intendedness of current or a pregnancy in the recent past are only considered in the standard definition while infant nutrition during breastfeeding is used only in the CS definition to establish de facto LAM.16 Women are classified as de facto LAM if they are postpartum amenorrhoeic between 2 months and 6 months post-delivery and are exclusively breastfeeding (with the exception of water). This stringent definition may underestimate de facto LAM, but leads to minimal difference, given the small percentage of women in this group in any country (mean=0.8%, range 0% to 3.7%). The CS algorithm also explicitly reclassifies a small minority of women (0.2%) as having unmet need if they have an unknown pregnancy risk status (missing information on time since last sex or pregnancy intention). Sensitivity analysis is conducted to estimate CS unmet need if these women are instead reclassified as having no unmet need. Measures of infecundity and contraceptive use are based on DHS indicators that have previously been described.13 We consider sexual exposure extending 3 months prior to the survey as used in other measures of pregnancy risk in the USA and Europe.24 25 Finally, we consider a need for contraception if women want to delay a birth for 12 months or more, using a median time to conception of 3 months.26 We also conduct sensitivity analysis restricting our definition of unmet need to a more narrow period of sexual exposure (sexual activity in the last month rather than in the last 3 months) in order to more closely align pregnancy exposure with contraceptive behaviours. This period of sexual exposure is included in the standard measure for unmarried women, but it is not included in the standard measure for married women who are assumed to have regular sexual intercourse.13 The programme code for computing CS unmet need and US unmet demand are provided in the online supplementary appendix.
Supplemental material
We assess differences in women’s classification between standard and CS definitions by constructing a four-category indicator as follows: 1=woman classified by both algorithms as having no unmet need, 2=woman classified by both algorithms as having unmet need; 3=woman classified as having unmet need by standard but not by CS, 4=woman classified as having unmet need by CS but not by the standard measure.
We divide women with CS unmet need into two groups based on their contraceptive intentions: women with CS unmet demand (CS unmet need and intention to use contraception in the future) and women with CS unmet need and no demand (CS unmet need and no intention to use contraception). Unmet need status (CS and standard), the four-category classification described above, CS unmet demand and CS unmet need with no demand are tallied across women from each survey to produce country-level estimates of these indicators. We also average values across countries in a given region. A detailed description of the numerators and denominators of each measure is provided in table 1.
Analysis
We first compare standard and CS indicators using unweighted data, which directly reflects the difference in measurement between the two indicators, and then estimated these differences using weighted data (weights provided by ICF-International), to assess how the differences in measurement affected country-level estimates of unmet need. We regress the difference between standard and CS indicators against country total fertility rates (TFR) to evaluate if the difference between standard and CS estimates changes as a function of fertility levels. We also plot the two indicators of unmet need (standard and CS) to evaluate if these measures differ by subgroup of women (age, marital status, parity, area of residence and education). The differences between standard and CS unmet demand mirror the differences described between standard and CS unmet need, so we focus our analysis on CS unmet demand, in order to examine contraceptive intentions among women who have a current risk of unintended pregnancy. All analyses were conducted using Stata V.15.1.27
Results
CS unmet need for contraception
The average percentage of women with unmet need across the 46 countries using the standard indicator is 16.4%, while the CS indicator yields lower estimates, with an average of 13.8% of women identified as having CS unmet need. The difference ranges from – 8.3% points in Niger to +11.1% points in Nepal (table 2). Sexual inactivity, pregnancy and infecundity contribute 44.4%, 29.5% and 15.9% of the cases reclassified from unmet need using the standard definition to no CS unmet need, respectively (table 3). Pregnancy is a less common reason for such reclassification in Europe and Asia, while infecundity is a more common reason in Asia, Latin America and Europe and the absence of sexual activity is the most common reason in West Africa. Conversely, non-use of contraception among women who had sexual intercourse in the last 3 months and who intended their next birth within a 13–24 month timeframe, or among postpartum amenorrhoeic women who delivered more than 2 months ago and had resumed sexual activity contributed 34.6% and 47.4%, respectively, of the cases reclassified from having no unmet need using the standard definition to having unmet using the CS definition (table 4). The women in postpartum amenorrhoea who were reclassified as having CS unmet need were on average 10 months postpartum.
Percent distribution of women (15–49) by reason for not being at risk of unintended pregnancy among women classified as having unmet need based on standard definition but not based on CS definition, by region
Percent distribution of women (15–49) by reason for having CS unmet need but no unmet need using the standard definition, by region
CS unmet need remains virtually unchanged (13.6%) if women with missing information on sexual activity in the last 3 months or on future pregnancy intentions in the next 12 months are reclassified as having no current unmet need (not shown). When restricting the CS unmet need definition to women with more recent sexual exposure (sexual activity in the last month), the CS unmet need estimate falls to 12.7% widening the gap with the standard indicator.
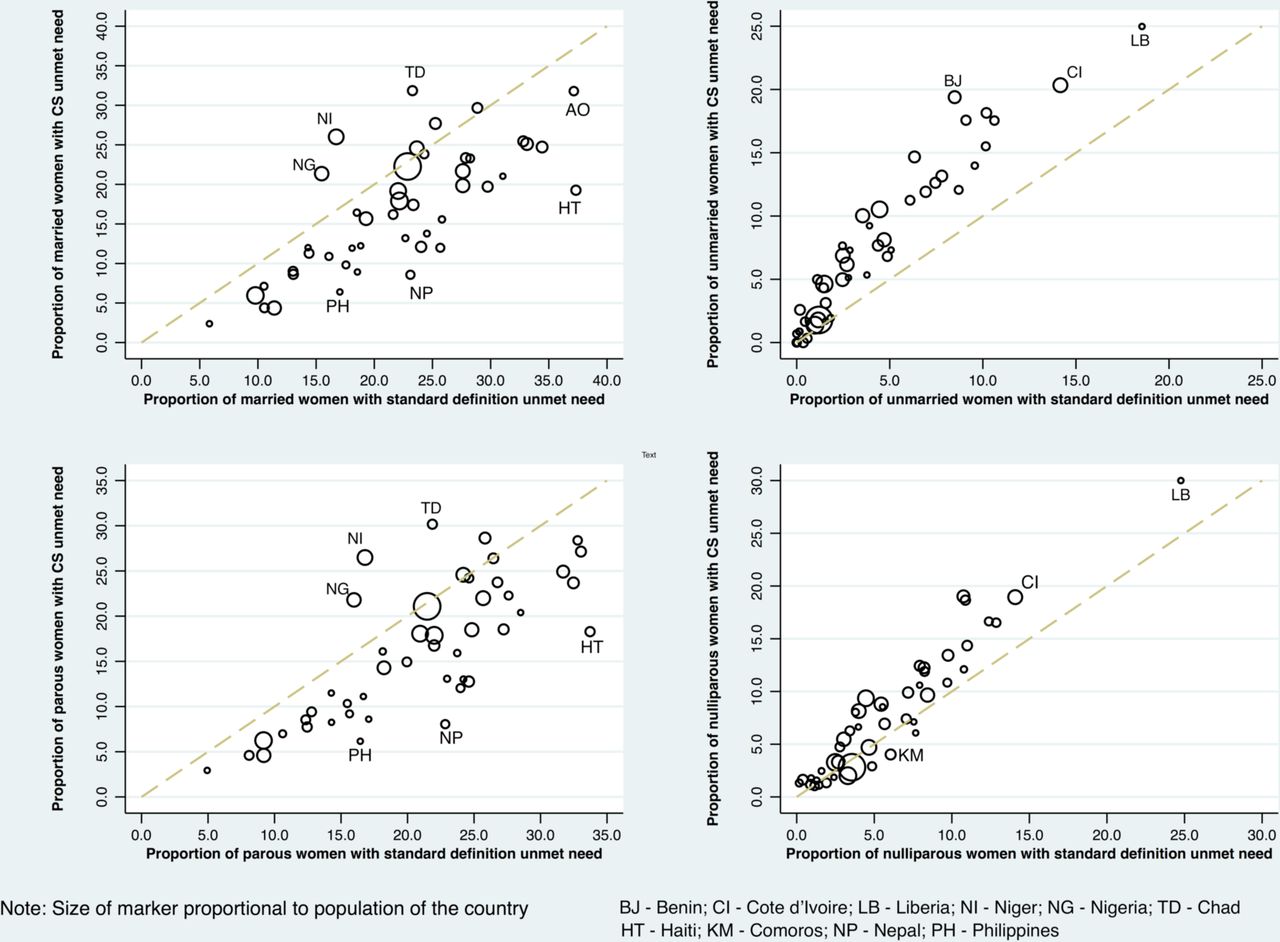
The difference between standard and CS indicators changes from positive to negative values as total fertility increases (ß=−0.96 95% CI (−1.65 to 0.26)) (figure 2). Specifically, the standard indicator is more likely to be higher than the CS indicator in low fertility settings but is typically lower than CS unmet need in high fertility settings. In addition, the examination of average differences between standard and CS indicators by subgroup of women shows differential variation by marital status (average of +5.2% points for married women and of −3.6% points for unmarried women), and by parity (average of +4.6% points for parous vs −2.1% points for nulliparous) (figure 3). The standard unmet need estimate is systematically above the CS estimate for both rural women (average of +3.1% points) and urban women (+2.1% points). No such patterns are observed according to women’s age (<25=>25), or education (below or higher than median years of education) (not shown).
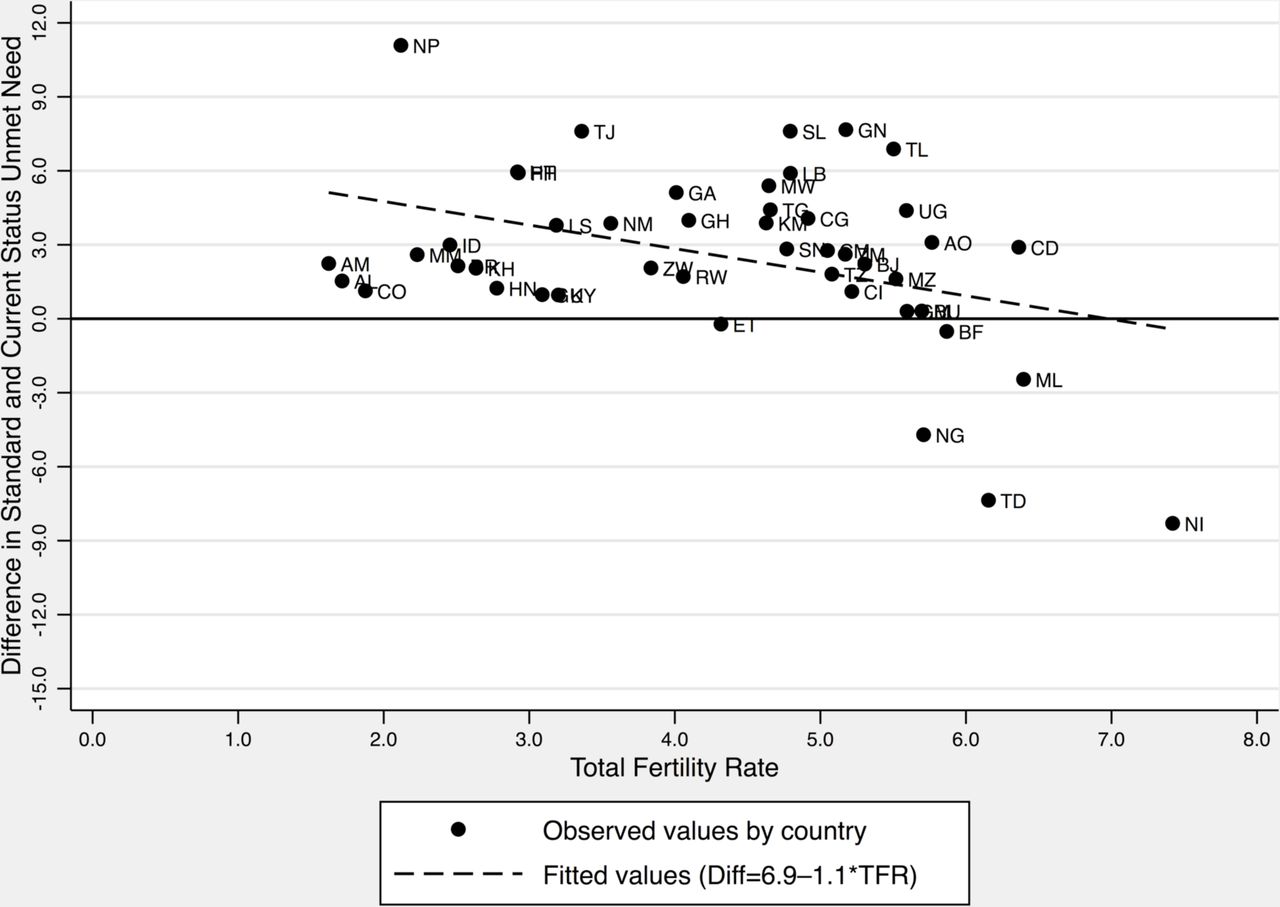
Percentage difference between Standard and Current Unmet need by total country fertility rate in 46 DHS surveys. The country abbreviations are described in table 2.

Percentage of women classified with unmet need by CS definition and by standard definition bymarital status and parity in 46 DHS surveys.
At the individual level, the average percentage agreement between standard and CS indicators is 87.7%, with both indicators classifying 78.7% of women as having no unmet need and 9.0% as having unmet need (table 2). An average of 7.4% of women across the 46 countries are classified as having unmet need by standard but not by CS indicators, while an average of 4.9% are classified as having CS unmet need but no need by the standard definition. The percentage of women identified as having unmet need using the standard definition but no unmet need using the CS definition ranges from 2.9% in Albania to 12.6% in Guinea (table 2). The percentage of women classified as having unmet need using the CS definition, but no unmet need using the standard definition varies from 0.9% in the Philippines to 13.3% in Niger (table 2). The average positive predictive value of the standard indicator for identifying women with a current unmet need for contraception at the time of the survey is 53.1%, ranging from 32.0% in Nepal to 74.1% in Albania (last column of table 2), and was positively associated with TFR (p<0.006) (not shown).
CS unmet demand for contraception
On average across 46 countries, 37.0% of women are at risk of unintended pregnancy, of which 23.1% of women are using contraception, 6.7% are not using contraception but intend to use it in the future (CS unmet demand), and 7.2% are not using contraception and have no intention to use it in the future (CS unmet need and no demand for contraception) (table 5). At the country level, the percentage of women with CS unmet demand varies from 1.5% in Albania to 13.5% in Burkina Faso (table 5). The percentage of women who have CS unmet need and no demand ranges from 0.6% of women in Colombia to 19.4% in Chad. In a number of high fertility countries, especially in Western and Central Africa, such as Benin, Gambia, Guinea, Mali, Niger, Angola or Chad, the percentage of women with CS unmet need and no demand is higher than both the percentage of women with CS unmet demand and the percentage of women at risk who are using contraception (table 5).
Percentage distribution of women in 46 DHS surveys by unintended pregnancy risk exposure, contraceptive use and intention to use contraception in the future, by region
Discussion
This study addresses some methodological concerns related to the construction of the standard unmet need measure by proposing a new measure of current status unmet need. We also recommend incorporating information on women’s future contraceptive intentions as a proxy for assessing contraceptive readiness for women with unmet need. These new measures provide greater predictive utility in identifying women at immediate risk of unintended pregnancy and women in such conditions who are likely to respond positively to family planning interventions. This is particularly important if we are interested in understanding factors associated with unmet need at the individual level to inform contraceptive programming.
In line with studies conducted in the USA and Europe,24 25 our proposed framework reconsiders the standard definition with respect to women in three specific situations: being pregnant, having no sexual activity in the past 3 months and being postpartum. Pregnant women and women who have not had recent sexual intercourse have no immediate need for contraception as their risk of becoming pregnant is currently nil. On the contrary, postpartum women who are 2 months postdelivery or more, and are not exclusively breastfeeding14 are at potential risk of ovulating at any time and therefore enter the at-risk group when they resume sexual activity.12 In so doing, we expand on previous work, which has tested some of these assumptions separately,10 17 by offering a comprehensive understanding of the ways in which the standard indicator violates the common definition of a prevalence measure of unmet need for family planning described as ‘the percentage of women who want to stop or delay childbearing but who are not using any method of contraception to prevent pregnancy’.4 The use of the CS prevalence measure avoids policy-makers’ and the media’s misinterpretation of the standard unmet need measure as an estimate of the women currently in need of contraception, which it is not.
For the 46 countries studied here, we found that the standard unmet need measure overestimates current unmet need on average by 2.6% but with wide variability between countries. As shown in figure 2, the standard measure tends to overestimate for countries with lower TFR but underestimates for countries with higher TFRs. The 46 country surveys included in this study were not a random nor a representative sample of countries, but are recent surveys that had the information needed for estimation of current unmet need for all women. It should be noted that the DHS surveys are mostly done in low-income countries with only a few middle-income countries included. Thus, if one wished to extrapolate to all low and middle income countries, it is likely that there would be more countries in which the standard measure yields an overestimate. The United Nations Population Division has estimated standard unmet need for every country of the world using Bayesian methods which utilise data for neighbouring or similar countries when data for a given country are missing.4 We recommend that a similar exercise be conducted using the CS unmet need measure in order to evaluate the global prevalence of satisfied demand for contraception, in complement to the UN sustainable goal indicator, which uses the traditional measure of unmet need as part of its’ denominator (satisfied demand for contraception is defined as the percentage of women using contraception among women in need of contraception including contraceptive users and women with unmet need).2 In addition, the difference between the standard and point prevalence estimate varies systematically according to women’s marital status and parity, which highlights the types of women classified differently by the standard definition and our CS definition of unmet need.
Individual-level differences in classification of unmet need between the standard and CS indicators are greater than aggregate level differences, with an average of 12.3% of woman-level discordance. Approximately three quarters (73.9%) of women classified as having standard unmet need but no CS unmet need are either pregnant at the time of the survey or had no sexual activity in the past 3 months. Providing these women with contraception immediately will not contribute to a reduction in unwanted pregnancy since they are not susceptible to pregnancy. The low positive predictive value of the standard indicator also raises concerns for studies that use this indicator as an individual indicator to assess determinants of women’s unmet need.11 20 In addition, as the positive predictive value of the standard estimate varies by level of total fertility, comparative analyses of factors contributing to unmet need across countries at various stages of the demographic transition are potentially biased.
The current analysis also accounts for the growing concern related to pregnancy risk in the postpartum period. On average, 4.9% of women are classified as having current unmet need but have no need for contraception according to the standard definition. This proportion rises to 13% in high fertility countries, such as Niger or Chad. These women are between 2 and 24 months postpartum (on average 10 months), sexually active and are not using LAM or other methods. While the risk of pregnancy among postpartum amenorrhoeic women is low in the first year following a birth,28 the risk is not null as evidenced by a significant proportion of births with short interpregnancy intervals (https://statcompiler.com/en/). The lack of consideration for these women’s postpartum contraceptive needs in the standard definition does not reflect WHO recommendations for postpartum contraception29 to ensure healthy interbirth intervals and reduce associated maternal30 and perinatal morbidity and mortality.31
Regardless of which indicator is used (standard or CS), only half of women with unmet need indicate that they intend to use contraception in the future, which resonates with qualitative studies showing that unfavourable attitudes towards contraception remain a significant barrier to use in some societies.32 Integrating women’s motivation to use contraception in relation to unmet need allows evaluation of the extent to which unmet need is a manifestation of a lack of demand for contraception versus a lack of access. According to the transtheoritical framework, an average of 7.2% of women in our study who are at immediate risk of unintended pregnancy are in the precontemplation stage of using contraception (no intention to use), 6.9% are in the contemplation or preparation stage (intention to use) and 23.1% of women have taken action by using contraception. These percentages vary substantially by country with a high percentage of women in the precontemplation phase in Western and Central African countries. Programme providing contraceptive services may have little traction in reducing unmet need in such contexts, calling for complementary educational and normative interventions to generate contraceptive demand among women and couples who seek to control their fertility. Additional measures of contraceptive demand, specifying preferred timeframe for contraceptive uptake and analysis of reasons for unmet need according to women’s contraceptive intentions are needed to tailor family planning programme to meet women’s and couples’ needs at different stages of behavioural change from the precontemplation to action and maintenance.33
We acknowledge certain limitations of this analysis. The construction of the CS estimate requires information on sexual activity and pregnancy intentions for which data may be missing, may not accurately capture women’s fertility intentions or may be prone to recall bias or social desirability bias especially among women not in union.34 Additionally, given the sensitivity of discussing sexual activity, there could be variation in the percent of missing data, across and within countries. However, sensitivity analyses do not indicate substantial differences in the CS estimate when we reclassify the very small percentage of women who do not report time since last sexual intercourse and the very small percentage of women with unknown pregnancy intention status. Operationalising the guidelines for de facto LAM from survey data is also a challenge, and may result in underestimation of pregnancy prevention as ovulation inhibition is based on frequency and duration of suckling as well as on time interval since delivery.35 More generally, while we believe that the CS measure more accurately captures women’s current need for contraception than the standard definition by selecting women who are exposed to the risk of unintended pregnancy, we also acknowledge the variation in levels of exposure among women classified as having CS unmet need. Indeed, the risk of pregnancy among postpartum amenorrhoeic women or among women with infrequent sexual activity is low.
The study has a number of strengths. The main strength of the CS estimator is that it estimates the percentage of women with a current unmet need for contraception. In line with this, the CS measures has no bias related to reports of pregnancy intentions for a past pregnancy.13 We use population-based surveys to estimate the effect of measurement discrepancies across countries at different stages of the fertility transition showing how standard unmet need may over or underestimate current unmet need based on a country’s stage in the transition.
Conclusion
The standard construct of unmet need does not accurately reflect the actual percentage of women in need of contraception at a given time. In high fertility countries, the use of those estimates leads to underestimation of the resources that are needed to meet women’s and couple’s postpartum contraceptive needs while in low fertility settings current unmet need is overestimated. The CS measure of unmet need described here is recommended for use by researchers and policy-makers as it is a true point prevalence measure that is easy to interpret. Future reports should also consider the percentage of women with unmet demand for contraception, as an indicator for family planning programmes. Women who are at immediate risk of unintended pregnancy and who intend to use contraception are indeed a priority group for family planning service delivery while educational and normative interventions are more relevant for women at risk who have no stated intention to use contraception.
References
Footnotes
Handling editor Sanni Yaya
Contributors CM, MS and SB designed the study, conducted the analysis and wrote the paper. SH provided conceptual and analytical guidance and participated in writing the manuscript.
Funding The authors have not declared a specific grant for this research from any funding agency in the public, commercial or not-for-profit sectors.
Competing interests None declared.
Patient and public involvement statement Patients were not involved in this research.
Patient consent for publication Not required.
Provenance and peer review Not commissioned; externally peer reviewed.
Data availability statement Data are available in a public, open access repository.