Article Text

Abstract
Introduction Suboptimal quality of paediatric care has been reported in resource-limited settings, but little evidence exists on interventions to improve it in such settings. This study aimed at testing supportive supervision (SS) for improving health status of malnourished children, quality of case management, overall quality of care, and the absolute number of children enrolled in the nutritional services.
Methods This was a cluster randomised trial conducted in Arua district. Six health centres (HCs) with the highest volume of work were randomised to either SS or no intervention. SS was delivered by to HCs staff (phase 1), and later extended to community health workers (CHWs) (phase 2). The primary outcome was the cure rate, measured at children level. Quality of case management was assessed by six pre-defined indicators. Quality of care was assessed using the national Nutrition Service Delivery Assessment (NSDA) tool. Access to care was estimated with the number of children accessing HC nutritional services.
Results Overall, 737 children were enrolled. In the intervention arm, the cure rate (83.8% vs 44.9%, risk ratio (RR)=1.91, 95% CI: 1.56–2.34, p=0.001), quality of care as scored by NSDA (RR=1.57, 95% CI: 1.01–2.44, p=0.035) and correctness in complementary treatment (RR=1.52, 95% CI: 1.40–1.67, p=0.001) were significantly higher compared with control. With the extension of SS to CHWs (phase 2), there was a significant 38.6% more children accessing care in the intervention HCs (RR=1.26, 95% CI: 1.11–1.44, p=0.001) compared with control.
Conclusion SS significantly improved the cure rate of malnourished children, and the overall quality of care, SS to CHWs significantly increased the crude number of children enrolled in the nutritional services. More studies should confirm these results, and evaluate the cost-effectiveness of SS.
- supportive supervision
- malnutrition
- children under 5 years
- quality of care
- randomised controlled trial
This is an open access article distributed in accordance with the Creative Commons Attribution Non Commercial (CC BY-NC 4.0) license, which permits others to distribute, remix, adapt, build upon this work non-commercially, and license their derivative works on different terms, provided the original work is properly cited, appropriate credit is given, any changes made indicated, and the use is non-commercial. See: http://creativecommons.org/licenses/by-nc/4.0/.
Statistics from Altmetric.com
Key questions
What is already known?
Under-nutrition is a major cause of morbidity and mortality in children under 5 years especially in low- and middle-income countries (LMICs).
Quality of care delivered to malnourished children has been reported as substandard in several LMICs.
Supportive supervision (SS) has been suggested as a promising intervention to improve quality of paediatric care, but there is very limited evidence of its impact on health outcomes and in children with malnutrition.
What are the new findings?
This study shows that SS was an effective intervention to improve the overall cure rate and quality of care, quality of case management and access to care of malnourished children, at outpatient level, in a setting with very low resources.
What do the new findings imply?
These findings contribute to the growing body of evidence from other studies in similar settings that suggest SS as a possible effective intervention to improve quality of paediatric healthcare and the health status of children.
INTRODUCTION
Under-nutrition is a major cause of morbidity and mortality in children under 5 years.1 According to recent global estimates, 52 million children are wasted and 17 million are severely wasted and approximately 26.9% of these cases occur in sub-Saharan Africa.2 In Uganda, national estimates indicate that 3.6% of children suffer from moderate acute malnutrition (MAM) while 1.3% have severe acute malnutrition (SAM).3 However, in the humanitarian settings of the West Nile region, currently hosting refuges from South Sudan and DR Congo,4 5 the prevalence of MAM and SAM in children is significantly higher, having being estimated at 10.4% and 5.6%, respectively.6 This is far above the target identified by the World Health Assembly (WHA), which adopted the goal of reducing and maintaining the prevalence of wasting in children to under 5% by year 2025.7 8
In Uganda, under-nutrition is recognised as a condition of public health importance.6 9 The latest National Development Plan10 and in the Nutrition Action Plan for multi-sectoral support11 have set national targets that are a crucial part of the national strategy for becoming a middle-income country by 2040.12 Such targets include achieving the WHA goal, and ending all forms of malnutrition by 2030. To operationalise the strategy, the Integrated Management of Acute Malnutrition (IMAM) guidelines have been developed by the Ministry of Health, in line with the WHO recommendations, detailing the management of children with both SAM and MAM and including recommendations for screening and follow-up at community level.9 13 Training and essential equipment are provided, with the support of development partners.14 15
However, several studies have shown that developing guidelines, providing training and basic equipment per se do not actually ensure that care is delivered according to the standards.16–20 Previous assessments of the quality of nutritional service in low- and middle-income countries (LMICs) have highlighted that poor adherence to guidelines and poor quality of care are common findings.17 18 21 22 Supportive supervision (SS) has been suggested as a promising intervention for achieving higher adherence to guidelines and better quality of care in LMICs such as South Africa, India and Bangladesh.23–25 SS is a process that promotes quality at all levels of the health system by strengthening the relationships within that system, with an emphasis on identifying and solving problems and contributing to the optimisation of the allocation of resources, promotion of high standards, teamwork and better communication.26 There is currently limited evidence of the impact of SS on health outcomes, and in particular for children with malnutrition.27 This study tested the hypothesis that SS delivered to staff at health centre (HC) level and to community health workers (CHWs) may improve the quality, number of enrolled children and outcomes of outpatient care among malnourished children. Given that the intervention could only be delivered at the health facility level and not the individual patient level and to minimise study contamination, a cluster randomised design was chosen.
Methods
Study design
This was a cluster randomised control trial (RCT), with HCs as the unit of randomisation. The manuscript is reported according to the Consolidated Standards of Reporting Trials statement (CONSORT)28 (see online supplementary material 1 for the CONSORT checklist). Online supplementary appendix 1 details study timelines and activities. Patients were enrolled in the period between February 2017 and February 2018. The study protocol was registered in ClinicalTrials.gov (NCT03044548).
Supplemental material
Supplemental material
Study setting
The study was conducted in Arua district, in the West Nile region of Uganda. According to the 2014 national census, Arua has an estimated population of 808 745 residents. By May 2017, the district also hosted 174 396 refugees from South Sudan and Democratic Republic of Congo.4 The prevalence of MAM and SAM in children has been estimated at 10.4% and 5.6%, respectively.3 Out of 79 facilities located in Arua District, 50 (63.3%) provide nutritional care. Most of HC only treat few children. Recent assessments of the quality of care delivered in the district to malnourished children at HC level highlighted substandard quality and poor health outcomes, with an average cure rate of 52.9%, which was far below the SPHERE standards of 75%.22
Selection of health facilities and randomisation
Health facilities were selected based on their volume of work: the six HCs with the highest reported number of children accessing the nutrition services—according to the official 2016 Health Managment Information System (HMIS) data29—were included in the study. After stratification by characteristics (online supplementary appendix 2)—such as HC level, setting (urban vs rural), number of staff assigned to the nutritional unit—the study team randomly allocated HCs by blind extraction (‘urn randomisation’30) to either SS or standard care (no intervention). HC staff and CHW were aware of the allocation group while patients were blinded.
Patient and public involvement statement
The patients parents/guardians were interviewed during the baseline assessment of the project22 and some of the information derived was used during the design and implementation of the study intervention. Additionally, the patient views of the intervention were taken into account and documented as a part of a study video that was uploaded on the website link (https://www.youtube.com/watch?v=6DYdc9ofpBc&t=145s). Once the trial results have been published, the HCs and patients will be informed of the study findings through dissemination meetings that will be conducted in collaboration with our implementing partners, CUAMM Doctors with Africa. We are also planning to develop study dissemination material such as a policy brief written in non-specialist language to be shared with all stakeholders including the patients.
Study participants
The primary outcome (cure rate) was measured at patient’s level, among children accessing the nutritional services in the HCs involved in the study. Children fulfilling all the following criteria were included: diagnosis of SAM or MAM according to the national criteria9; aged between 6 and 59 months; a documented HIV status as per the national HIV guidelines.31 Exclusion criteria were those with any of the following: guardians refusing participation or unable to adhere to study procedures.
Sample size
The sample size was calculated by taking into account a fixed number of clusters (six HCs), the intra-cluster correlation coefficient (ICC) resulting from the baseline data (online supplementary appendix 3), the expected control event rate, the expected effects, and the level of significance and power of the study.32 An estimated sample size of 716 children was calculated based on the assumptions that in the intervention HCs, the mean cure rate would have been 85% compared with 45% in the control HCs, with an ICC of 0.2, a power of 80%, an alpha of 5%.
Intervention
The intervention consisted of SS, delivered at a high frequency and specific to the nutritional services. SS was delivered by a team of two trained local staff (a local nutritionist, recruited by the study and district health team officer, from the existing district health structure). In phase 1 (February 2017 to August 2017), SS was provided only to HC staff. In our setting, on average, HC staff had approximately 8.7 (SD:8.0) years as health professionals and 1.5 (SD 3.9) years specifically under nutritional services. Staff were mostly diploma holders (45%) or certificate holders (34%) with one degree holder and with rest as secondary school certificate holders. SS was conducted bi-monthly in the first 2 months, and then monthly for the next 4 months. Each SS session lasted approximately 2 hours. The main activities included the following: an initial 3-day training to introduce the concept of SS, followed by continuous mentorship on the key concepts of the IMAM guidelines (including patient screening, diagnosis, treatment, follow-up, assignment of outcomes and data recording), monitoring the availability of equipment and supplies, and evaluating overall quality of care and case management. Tools included a checklist, to enable the supervisors provide guidance in a standardised way (online supplementary appendix 4). The national IMAM guidelines9 were used as reference standards. Based on the deficiencies identified, the supervisors discussed problems, provided technical support and facilitated the development of solutions, in a participatory manner.33 Complementary activities included the following: (i) facilitation of networking among staff of different HCs, with the objective building ownership in the process and (ii) tools for tracing of defaulters such as telephone credit and location maps. The study protocol also included the delivery of essential key equipment if needed, but since all key equipment were already available, only regular checks for accuracy of the weighing scales for calibration were performed.
In phase 2 (August 2017 to February 2018), SS was extended to include CHWs (monthly for HCs and weekly for CHWs), with the objective of improving community screening and case-referral. Every week, a selection of villages associated with the intervention HCs was visited by the same SS team that comprised of a nutritionist and district health team officer. Overall, every CHW was involved in SS at least twice during the duration of the project. Specific activities implemented included the following: on-site training on the key concepts of the IMAM guidelines, enhanced supervision during work and provision of a small financial incentive.
Control
No intervention was delivered in the control group, which was therefore considered as ‘standard care’. Accordingly, these facilities received the basic nutritional-related supplies such as therapeutic foods, equipment (Mid-upper-arm -circunference (MUAC) tapes, weighing scales) and job aids such as the z-score charts from the central government and partners such as Unicef. During the study period, there were no other activities in the HCs involved in the study (such as training, or additional SS) from any provider, that could impact the quality of care.
Data collection tools, procedures and variables
Health status was measured using six pre-defined indicators (cured, defaulters, non-responders, transferred to inpatient care or to another outpatient care facility, died), based on the national case definitions9 (online supplementary appendix 5). Data were collected prospectively every week for each child enrolled in the study, using a pilot tested tool (online supplementary appendix 6) and standard operating procedures (SOP), by six trained staff (each assigned to one HC). In line with the national guidelines,9 the duration of follow-up for each child with malnutrition was up to 3 months (4 months for the patients with HIV/tuberculosis). Children not cured within this time frame were classified as ‘non-responders’ (online supplementary appendix 5). All children who defaulted were followed up to ascertain their living status.
Quality of case management was assessed from the official nutritional registers using six pre-defined process indicators as defined in the national guidelines9 (online supplementary appendix 5): (1) correct diagnosis; (2) correct ready to use food (RTUF) treatment; (3) correct complementary treatment; (4) correct evaluation of HIV; (5) correct patients’ counselling and (6) correct exit outcome assignment. Data were collected prospectively for each child enrolled in the study, using a pilot tested data collection tool (online supplementary appendix 7) and SOP, at fixed intervals, by two external data monitors (HW and RM).
Quality of nutritional services was measured at three time points (baseline, mid-term and end of the study) using the Nutrition Service Delivery Assessment (NSDA) tool, the official national instrument for assessing performance of nutritional services.34 The NSDA assesses 10 key capacity areas of nutrition service relevant at outpatient level (online supplementary file 1). For each chapter, using strict criteria specified in the tool, a final judgement on the quality of the services is made and a final scoring is assigned in the form of one of four pre-defined categories: poor, fair, good and excellent. The study team involved in the NSDA assessment included a senior paediatrician, a nutritionist and a public health expert all experienced in the national nutritional guidelines9 and in the use of the tool.
To evaluate the additional effectiveness of SS to CHWs on the number of malnourished children (with SAM or MAM) enrolled, the absolute number of children in phase 1 was compared with phase 2. The choice of absolute numbers was based on the lack of an accurate reliable estimate of the reference population for each HC and the assumption that total population in the coverage area did not change.
Data management and quality control
Details of data quality control procedures are outline in online supplementary appendix 9. All tools for data collection were pre-defined and pilot-tested, SOP were developed and tested, and performance of data collectors was verified before the start of the study. Data collectors were trained in key aspects of the IMAM guidelines9 and in data quality assurance procedures, and constantly supervised by a study manager (HW) and a study coordinator (RM). Quality of data in both the intervention and control group were regularly monitored for each enrolled case using the following three pre-defined indicators: (a) data completeness; (b) accuracy and (c) internal consistency (online supplementary appendix 9). The filled data collection forms were checked daily for completeness and accuracy and errors were corrected before data entry. Data were cleaned and double-entered into Epidata V.3.1. Range, consistency and validity checks were built in to the entry programme to minimise errors. Data were collected at fixed intervals and entered in the databases in real time. The databases were also monitored for completeness and internal consistency and any problem was discussed in real time. An interim data analysis was performed at fixed intervals of 6 weeks and checked by an independent analyst.
Data analysis
Data were analysed with STATA V.14. Categorical variables were presented as frequencies and percentages with 95% CIs. This was a cluster randomised trial and therefore correlated observation analysis techniques were used for analysis for the main study outcomes. The proportion of children with specific health outcomes or for which a correct case management process outcome was conducted were first estimated at each the health facilities (clusters). These summary measures were then used to estimate the overall mean proportion (95% CI) for each of the randomisation arms. The significance of the difference of the mean proportion between the intervention and control arms was estimated using the t-test. To evaluate the effect of imbalances in baseline characteristic to the primary outcome (cure rate) crude and adjusted OR and 95% CI were estimated by the forward fitting conditional logistic regression model, taking effect modification into consideration (online supplementary appendix 10). All statistical tests were two-sided. A p value of less than 0.05 was considered statistically significant. Results were interpreted looking both at the level of statistical significance and at plausibility and consistency of results across different outcomes.
Ethical considerations
The study was approved by the Makerere University School of Public health ethical committee, Uganda National Council of Science and Technology and the ethical committee of the IRCCS Burlo Garofolo, Italy. Health authorities were informed of the authorisation received to carry forward the study. At the cluster level, staff was informed on the objectives and methods of the study, and their written consent was obtained. At the individual level, children and their parents/guardians were informed, and enrolled if providing written consent to participation and for the information derived to be published. Consent was administered in English and a local language of Lugbara.
Results
Access to care
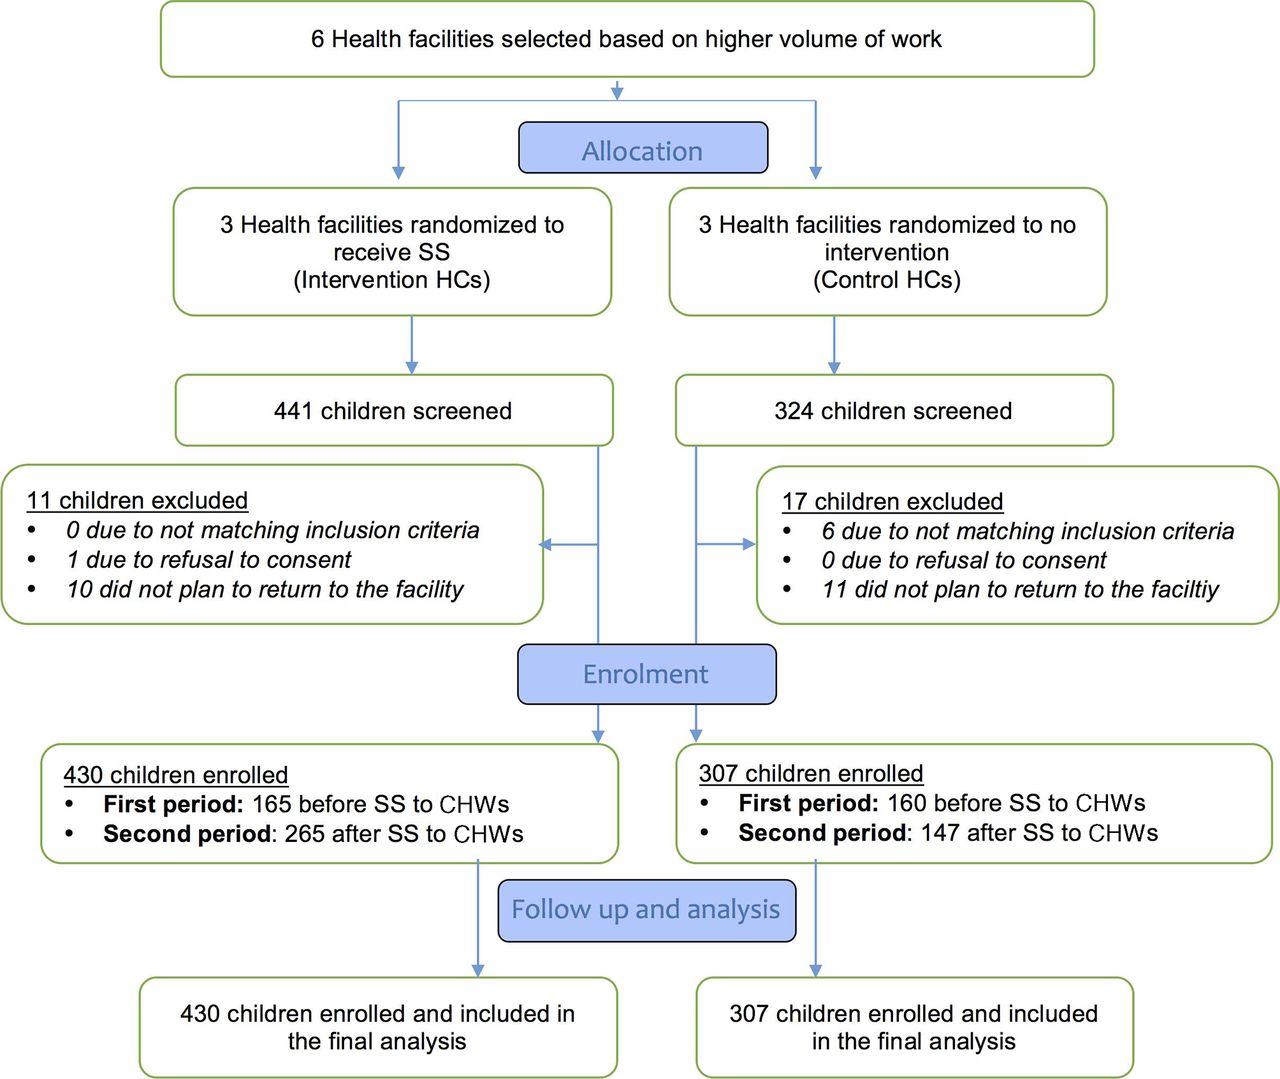
Children enrolment flow is shown in figure 1. Overall, 765 children were screened and 737 were included. All enrolled children were included in the final analysis.

Consort flow diagram. HC, health centre; SS, supportive supervision.
The monthly average number of children enrolled in phase 1 of the study was 27.5 versus 26.5 children between the intervention and control arm (overall total 165 in intervention group vs 159 in control arm, p=0.517). However, this rose to 44.2 (all three facilities recording an increase) versus 24.5 children in phase 2 when SS was extended to include CHWs (overall total: 265 in intervention group vs 147 in control arm, risk ratio (RR)=1.26, 95% CI: 1.11 to 1.44, p=0.001) (figure 1).
Baseline characteristics
Characteristics of enrolled children are reported in table 1. There were some significant differences in children characteristics between the study arms, and specifically more children in the intervention group had SAM (p=0.005), were twins (p=0.001), were HIV positive (p=0.001), had a mother no longer breastfeeding (p=0.014) or died were abandoned children (p=0.023).
Characteristics of malnourished children at enrolment
Baseline characteristic of HCs did not show significant differences (online supplementary appendix 2-3).
Health outcomes
Table 2 presents the health outcomes during the intervention phase of the study. In the HCs receiving SS, the cure rate was significantly higher than in the control facilities (83.8%, 95% CI: 71.0 to 96.6 vs 44.9%, 95% CI: 38.2 to 51.6), mean difference 38.9% (RR=1.91, 95% CI :1.56 to 2.34, p=0.001).
Health outcomes of malnourished children admitted to the outpatient care
On the other side, defaulting rate was significantly lower in the intervention HCs compared with control facilities; (1.4%, 95% CI: 1.1% to 1.8% vs 47.2%, 95% CI: 37.3% to 57.1%) in the control, mean difference—45.8% (RR=0.03, 95% CI: 0.0 to −0.06, p=0.001). All defaulting children were ascertained to be alive when they were followed up. Overall less than 5% of children had any of the other outcome (non-responder, transfer, dead), and for these outcomes there were no statistical significance differences among allocation groups.
Quality of case management
Quality of case management did not significantly differ between the two groups for most indicators (table 3): diagnosis, treatment with RTUFs, HIV evaluation, counselling and assignment of the exit outcomes were correctly performed in most cases in both groups. On the other side, complementary treatment was correctly assigned only in 58.8% (95% CI: 43.2 to 74.3) of control facilities, compared with 94.0% (95% CI: 83.7% to 100%) of intervention facilities (RR=1.52, 95% CI: 1.40–1.67, p=0.001).
Quality of case management of malnourished children among health facility staff
Quality of nutritional services
Figure 2 shows the trend of NSDA scores for each facility. At baseline, all facilities except one scored, in any of the 10 assessment areas of the NSDA tool, either poor or fair, without significant difference between the intervention and control groups. At the end of the study, both groups had increased the total number of area scoring either good or excellent, with a significant difference between intervention and control arm (24/30 (80%) vs 14/30 (46.6%), RR=1.7, 95% CI: 1.1 to 2.6, p=0.015).

Total number of areas with either good or excellent Nutrition Service Delivery Assessment score, by group, over time.
Discussion
This cluster RCT has shown that SS significantly improved the cure rates of malnourished children at outpatient level, increasing it above the SPHERE standard. This result was observed, despite the fact that the children in the intervention group had more risk factors. The intervention also resulted in a significant decrease in the rate of defaulters, and a significant improvement in general nutritional service delivery, and access to care. These findings contribute to the body of evidence from other studies in LMIC suggesting that SS can be an effective strategy to improve quality of care at the facility level.23 24 35–37 However, this is the first study that specifically tested SS to improve health status of children. The study was conducted in a setting with low resources, where baseline quality of care was reported to be highly substandard.22 In such settings, identifying effective intervention capable to improve child survival, especially for malnourished children who have a very high risk of death, is crucial. As such, study findings are extremely relevant: this study adds to the previous knowledge that, in a setting with very low resources, SS may be a highly effective strategy for improving the cure rate—and thus survival—of malnourished children.
Different components of the intervention may have contributed to the final results: both SS and complementary networking activities may have played a role. In regards to the decrease in children defaulting, the provision of practical tools such as telephone credit and localisation map, as a part of the intervention, may have played a major role. Additionally, the improvement in overall quality and organisation of care may have been positively perceived by service users, who may have been more prone to return, rather than to default.
Of notice, two interesting phenomena were observed in this study. First, over time we observed that the control HCs recorded a relative improvement in general nutritional service delivery (NSDA tool34), cure rates and case management (table 3) notwithstanding that the intervention facilities performed better. This may be due to the ‘study effect’ where the presence of well-trained data collectors at the facility level positively affected the overall performance of the health facility staff.
Second, despite some of the process indicators indicated good case management in both groups—except for complementary treatment, which remained substandard in the control group—the cure rate was significantly higher in the intervention group compared with the control (83.8% vs 44.9%). This higher cure rate in the intervention could be explained either by the low rate of children defaulting in the intervention group compared with control, or by the importance of a correct complementary treatment (amoxicillin, vaccinations, vitamin A, iron and folic acid, mebendazole) for achieving the state of being cured.
The finding that some areas of the health service assessment (NSDA), such as human resources, still performed as either ‘poor or fair’, irrespective of the intervention, is not surprising. Obviously, SS alone cannot solve all gaps in quality of care. Some of the required improvements, such as increasing the number of human resources working in the nutrition services, require financial resources, and actions from the district and central government authorities which were beyond SS and the actual mandate of the supervisors.
When SS was extended to include CHWs, combined with a small financial incentive, it also increased the number of malnourished children in each of the intervention facilities who were admitted to the facility. This is extremely important, since delay in accessing care has been shown to contribute to increase in mortality rates among vulnerable malnourished children.38 Of note, our study combined a small financial incentive with SS, and this model proved to be effective. Indeed, other studies have suggested that providing some sort of economic recognition is crucial for ensuring CHWs’ performance.39–41
There were a number of study limitations that need to be acknowledged. At baseline, there was a limitation of data accountability (online supplementary appendix 2), from historical data in the HMIS and in the nutritional registers. We recognise that data from HMIS and registers may not be fully accountable. However, these were the only official data with no alternative sources. Study findings show that there was a clear improvement in cure rate according to the before and after comparison, in addition to the comparison of the intervention and control groups, although with a significant improvement in the intervention arm, thus suggesting that the intervention is actually effective.
We used a simple approach to estimate access to care, that is, estimating it with the crude number of those accessing care, irrespective of the total population. This was opted for given the circumstances, where no accurate estimate of total reference population existed.
Heterogeneity in quality of care at baseline was observed in our sample, despite no observed significant differences in the mean cure rate among groups. Heterogeneity in quality of care, even among facilities is in the same setting, is a common finding21 22 24 and should not be perceived as unusual. Similar to other previous studies,24 this study showed that SS can reduced heterogeneity in health outcomes.
This study had a few health facilities included however, these facilities contributed over 45% of the total annual cases of malnourished children in Arua district based on the official reports from the HMIS.22
It is also important to acknowledge that part of the effect observed in the study was due to other study components, beside the intervention, such as the presence of data collectors. However, the study could not be conducted without data collectors. These data collectors were present in both study groups, but the observed difference in effect between groups suggests that SS was actually effective
Strength of the study include the cluster randomised trial design, and the quality assurance procedures used to ensure data quality. Quality of data was over 99% on all indicators (data of completeness, accuracy, consistency), in both groups (online supplementary appendix 11). Even though the study was not blinded, the use of objective outcomes measures limited the potential for assessment bias. Imbalance among groups in patient characteristics did not favour a positive effect of the intervention, thus resulting in a possible under-estimation, and not in an over-estimation, of the treatment effect.
The current IMAM guidelines in Uganda9 recommends SS, without much detail on specific activities or tools for SS. Therefore, this study is of interest of policy makers, by providing both evidence in support of the effectiveness of SS, and experience on dedicated tools.
Generalisability of this study findings needs to be placed in the contexts that the study was conducted with well trained, highly motivated local staff and SS was provided at a relatively high frequency. This suggests that when the above described factors are present, quality of care can be achieved. These characteristics need to be kept in mind, when planning to replicate the intervention.
Finally, the use of local staff already under district employment as providers of SS and of local guidelines as reference standard may facilitate the sustainability of this model. However, external coordination and monitoring need to be ensured, and appropriate resources need to be allocated.
Conclusion
SS was an effective intervention to improve the cure rate of malnourished children at outpatient level in a setting with very low resources. This approach also improved the overall quality of care, and increased the number of enrolled children. As such, SS may be considered among the strategies to improve nutritional outcomes of children in Uganda, and in other similar settings. Future studies could document the effectiveness and cost-effectiveness of SS when implemented in other LMICs.
References
Footnotes
Handling editor Stephanie M Topp
Contributors LM conceived the study idea, in collaboration with HW, MR, GP, GS, WH and PL. LM, HW and MR lead the design and acquisition of data, LM and HW conducted the analysis and interpreted the data. LM and HW lead the drafting of manuscript, all authors were involved during critical revision for important intellectual content. All authors read and approved for the final manuscript to be published and are accountable for all aspects of the work.
Funding Research discussed in the publication is funded by the World Food Programme (Office of Evaluation), the UK aid through the Department for International Development (DFID) and the International Initiative for Impact Evaluation (3ie). The views expressed in the report are not necessarily those of WFP, DFID or 3ie. The funding body had no role in the design of the study, data collection, analysis, and interpretation and writing the final manuscript.
Competing interests None declared.
Patient consent for publication Not required.
Ethics approval The study was approved by the Makerere University School of Public health ethical committee: protocol number 391, Uganda National Council of Science and Technology (UNCST): HS number 2059, and the ethical committee of the IRCCS Burlo Garofolo, Italy: protocol number 521/2016.
Provenance and peer review Not commissioned; externally peer reviewed.
Data sharing statement Data may be obtained from a third party and are not publicly available.