Article Text

Abstract
Background Facing increasing obesity prevalence and obesity-related disease burden, South Africa has devised an obesity prevention strategy that includes a recently implemented tax on the sugar content of sugar-sweetened beverages (SSB). We assess the potential distributional impact (across socioeconomic groups) of this tax on type 2 diabetes mellitus (T2DM) incidence and associated mortality and its financial burden on households.
Methods We conducted an extended cost-effectiveness analysis of the new 10% tax on SSBs in South Africa, and estimated: the averted premature deaths related to T2DM, the financial benefits to households (out-of-pocket (OOP) medical costs and indirect costs due to productivity losses averted), the increased government tax revenues and healthcare savings for the government, all across income quintiles.
Findings A 10% SSB tax increase would avert an estimated 8000 T2DM-related premature deaths over 20 years, with most deaths averted among the third and fourth income quintiles. The government would save about South African rand (ZAR) 2 billion (US$140 million) in subsidised healthcare over 20 years; and would raise ZAR6 billion (US$450 million) in tax revenues per annum. The bottom two quintiles would bear the smallest tax burden increase (36% of the additional taxes). The bottom two income quintiles would also have the lowest savings in OOP payments due to significant subsidisation provided by government healthcare. Lastly, an estimated 32 000 T2DM-related cases of catastrophic expenditures and 12 000 cases of poverty would be averted.
Conclusions SSB taxation would have a substantial distributional impact on obesity-related premature deaths, cost savings to the government and the financial outcomes of South Africa’s population.
- diabetes mellitus
- sugar-sweetened beverages
- soda tax
- South Africa
- equity
- distributional impact
- extended cost-effectiveness analysis
This is an open access article distributed in accordance with the Creative Commons Attribution Non Commercial (CC BY-NC 4.0) license, which permits others to distribute, remix, adapt, build upon this work non-commercially, and license their derivative works on different terms, provided the original work is properly cited, appropriate credit is given, any changes made indicated, and the use is non-commercial. See: http://creativecommons.org/licenses/by-nc/4.0/.
Statistics from Altmetric.com
- diabetes mellitus
- sugar-sweetened beverages
- soda tax
- South Africa
- equity
- distributional impact
- extended cost-effectiveness analysis
Key questions
What is already known?
In 2018, the South African government implemented a 10% excise tax on sugar-sweetened beverages (SSB).
Evidence from other countries suggests that a tax on SSBs is likely to reduce consumption and reduce the increasing burden of obesity-related non-communicable diseases.
What are the new findings?
A 10% tax would avert an estimated 8000 premature deaths related to type 2 diabetes mellitus (T2DM) over 20 years, the government would save South African rand (ZAR) 2 billion in subsidised healthcare, and raise ZAR6 billion in tax revenues per annum.
An estimated 32 000 T2DM-related cases of catastrophic expenditures and 12 000 cases of poverty would be averted.
The deaths averted would be concentrated in the third and fourth income quintiles, while the bottom two income quintiles would bear the lowest burden of taxes.
What do the new findings imply?
An SSB tax has the potential to reduce deaths due to T2DM, reduce out-of-pocket and government expenditures, and healthcare expenditure induced poverty in South Africa.
Introduction
In 2016, combined obesity and overweight prevalence in South Africa (SA) was 68% among women and 31% among men.1 Obesity-related non-communicable diseases (NCD) contributed to 40% of overall deaths in 2013.2 One contributor was increased consumption of sugar-sweetened beverages (SSB).3–6 In 2013, SA ranked seventh in the world in sugar consumption with a per-capita annual consumption of sugar of 36 kg.7 8 Between 2002 and 2016 annual sales of SSBs doubled from 3.0 to 6.0 billion litres.9 This increase in consumption occurred in conjunction with falling real prices, rising incomes and increasing affordability of SSBs.10
In view of the increasing burden of disease from obesity-related conditions, the SA government has implemented an excise tax on SSB as of 1 April 2018.11 12 This tax, also called the Health Promotion Levy (HPL), is levied at South African rand (ZAR) 2.21 cents for each gram of sugar over a threshold of 4 g/100 mL (figure 1). Using a sugar base is relatively novel, with Mauritius and the UK being the only other jurisdictions to have done so, and has the potential to incentivise consumers to change behaviour and for producers to reduce the sugar content of their products.11 The proposed HPL amounts to an approximate 10% tax on the price of can of standard cola drink.11 The National Treasury has indicated financing of expanded health promotion programmes from a portion of additional tax revenues.12
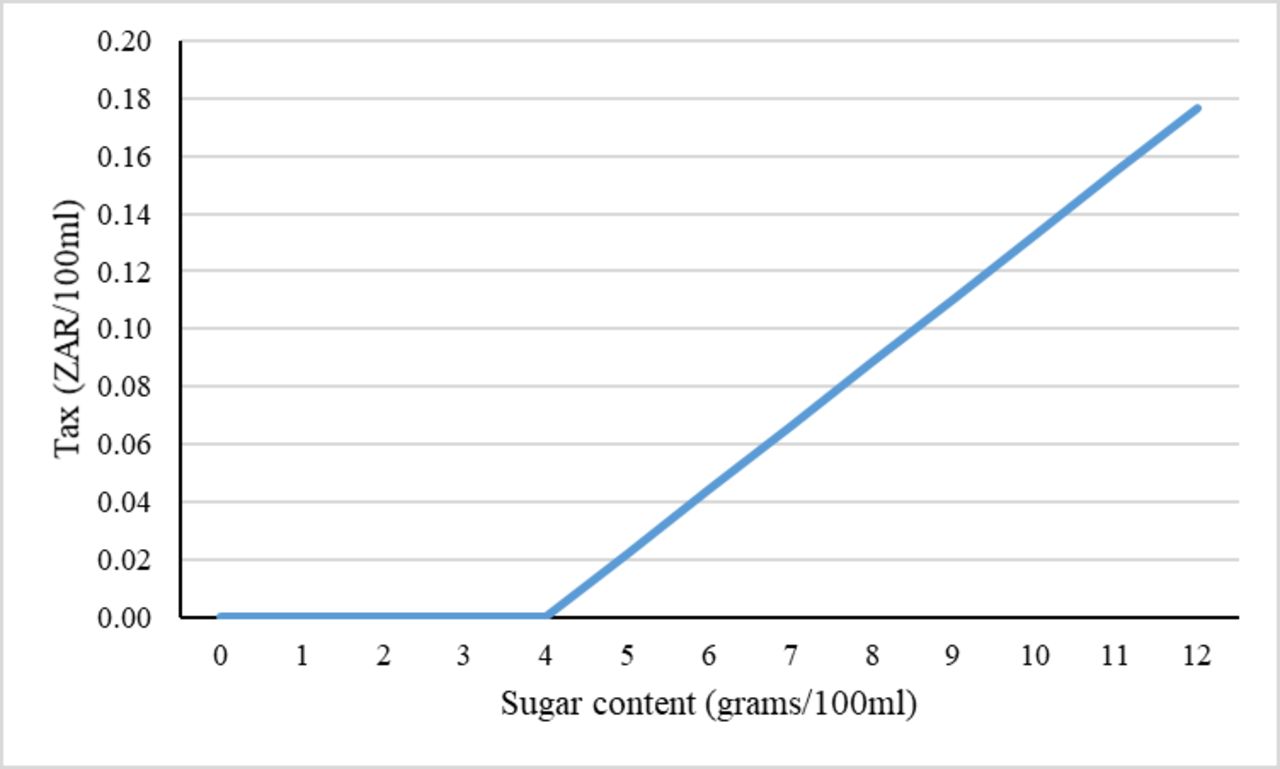
Tax per 100 mL by sugar content of taxed beverages. This figure shows the amount of tax (in ZAR/100 mL) due to sugar content in beverage (in g/100 mL). Tax is levied at 2.21 cents per 100 mL for each gram of sugar over a threshold of 4 g/100 mL. ZAR, South African rand.
A 10%–20% excise tax on SSBs, or ‘soda tax’, is recommended as one policy solution to the problem of increasing obesity13 14 and is hypothesised to increase the retail price of SSBs and to reduce consumption accordingly. This in turn is expected to curtail a proportion of the increase in obesity and related NCDs. In 2018, twenty-seven countries including Chile, France, Mexico and Spain, and six US municipalities had implemented some form of soda tax.15 Evidence from Mexico showed that sales of taxed beverages declined by 7% per capita within the first year of tax implementation, 10% within the second year, with overall higher reductions among lower versus higher socioeconomic groups (10% vs 6%).16 17
In response to an excise tax, manufacturers and distributers can either absorb the tax such that the retail price to the consumer does not increase after the implementation of the tax or pass a proportion of the tax to consumers resulting in an increased retail price paid at the point of sale. This is called the ‘pass-through’ effect to the consumers. The pass-through effect could be more than 100%, that is, the retail price increases/decreases by more than the amount of the tax and is called ‘over-shifting’, could be exactly 100% (‘perfect pass-through’ or ‘complete shifting’) or less than 100% (‘under-shifting’).18–23 There is evidence of overshifting of prices in responses to excise tax in Mexico (132% increase),24 in Denmark (300% increase), complete shifting in France (100% increase)21 and undershifting in Philadelphia (61% increase in first month and 93% increase by second month)23 and Berkeley, California (47% increase in first 3 months).19 Evidence from excise taxation of other products, namely beer, in SA has found similarly overshifting of tax increases to retail prices (480% increase).25
Beyond the NCD challenges, SA faces a public health system that is fragile and reflects underlying economic inequalities.26 27 These income inequalities are one of the highest globally, and arose through discriminatory government policies of the colonial and Apartheid eras which intentionally deprived all non-white citizens of meaningful access to economic opportunity through restrictions on what jobs could be held, on where residence could be taken up, on movement and through deeply skewed allocations of public resources for social services.28 The result of this deeply discriminatory past is a highly unequal distribution of income and economic well-being across which the potential differing impacts of public policies of SA’s new dispensation need to be evaluated.
The introduction of the tax has not been without controversy. Opponents have argued that the tax would be regressive (ie, tax paid as proportion of income decreases as income increases) and disproportionally impact the poor.29 A systematic review found that the tax burden was regressive whereas the modelled health benefits were progressive in the USA and Australia.30 Focusing solely on the share of SSB expenditure without considering the incidence of potential health benefits and averted healthcare costs, the regressivity of taxation could be significantly overstated.
A few studies from SA have considered the effect of a potential SSB tax on consumption of SSBs, obesity prevalence and mortality due to type 2 diabetes mellitus (T2DM).31–36 Building on these previous SSB tax analyses from SA, this is the first economic modelling analysis on the potential distributional health and financial impacts among poor and rich households in SA using extended cost-effectiveness analysis (ECEA) methods.37 38 Our analysis is restricted to T2DM-related mortality over a 20-year time period instead of covering additional health conditions affected by sugar consumption in order to use these previously published studies from SA and add ECEA. Additionally, within this ECEA, we extended the analysis to savings in indirect costs due to averted productivity losses. This approach of focusing on one disease condition helps us to remain comparable to the previously published literature and extend the analysis to equity effects.
Methods
Overview
We build on ECEA methods applied to the study of increased tobacco taxes.39–43 ECEA is a policy assessment methodology that estimates policy impact on three major outcomes: (1) health benefits; (2) reduction of out-of-pocket (OOP) costs on health and the financial risk protection (FRP) due to reduction in OOP expenditures; and (3) the distributional impact across socioeconomic status (eg, income quintiles).37 38 Here we assess: (1) impact on SSB consumption and resulting change in body mass index (BMI); (2) subsequent change in mortality due to T2DM; (3) resultant healthcare savings associated with foregone treatment for T2DM; (4) increase in tax revenues; (5) FRP provided by reduction in OOP costs to households; (6) savings in indirect costs associated with productivity losses; and (7) distributional impact of (1–6) across income quintiles (figure 2).

Conceptual pathway for modelling the health and financial impact of sugar-sweetened beverages using extended cost-effectiveness analysis. This figure shows the conceptual pathway of modelling the distribution of health and financial impact across income quintiles. Health and financial impacts are measured along five dimensions: (1) health gains as measured by change in mortality due to type 2 diabetes mellitus (T2DM); (2) healthcare savings associated with foregone treatment for T2DM; (3) increase in tax revenues; (4) financial risk protection provided by reduction in out-of-pocket (OOP) costs to households; and (5) savings in indirect costs associated with productivity losses. BMI, body mass index; SSB, sugar-sweetened beverage.
In the context of SA’s history of racialised discrimination, another salient dimension by which the population could have been stratified is race. While the potential differential impact of this policy on racial groups could be important, we focus our analysis on income given the concerns of regressivity in discussions of excise taxes, because the overwhelming majority of South Africans are Black Africans (about 81%)44 and due to lack of racially disaggregated data for SA for the variables and parameters we use in our estimation.
Price, tax, elasticity and consumption of SSBs
The policy imposes a tax of ZAR2.21 cents (US$0.18 cents) for each gram of sugar over 4 g/100 mL.12 As stated in a policy paper issued by the National Treasury of South Africa, a per litre price of ZAR11.45 and sugar content of 10.6 g/100 mL is used to derive the total SSB tax of approximately 10%.11 We chose a pass-through of 100% for baseline analysis to show the pure effect of price elasticity on consumption without the intervening effect of market structure that may cause overshifting (pass-through of more than 100%) or undershifting (pass-through of less than 100%). We quantified the change in per-capita beverage consumption using own price elasticity of demand for SSB, and pretax per-capita daily consumption by age, and income quintile (online supplementary appendix table A1). As we did not have price elasticity estimates by income quintile for SA, we had to impute the income quintile-specific price elasticity. We used SSB price elasticity estimates from Mexico and used a regression approach to quantify the correlation between the quintile-specific price elasticity and income distribution.22 We then predicted the elasticity estimates by income quintile for SA (table 1). The imputed elasticity estimates are by income quintile and are constant across age and sex. The estimated median price elasticity was −1.20 which is similar to the overall price elasticity of SSB consumption from SA of −1.18.36
Supplemental material
Price elasticity estimates of demand of sugar-sweetened beverages (SSB) by income quintile for Chile, Mexico and South Africa
Change in BMI and T2DM-related premature mortality
A recent meta-analysis has documented the effect of SSB consumption on T2DM incidence and the included studies showed the combined effect of the various channels through which SSB consumption can affect disease incidence.45 In our study, we modelled the impact on T2DM incidence through one such channel of change in BMI, and thus our estimates are likely to be conservative and underestimate the impact on T2DM incidence and mortality. We estimated the effect of reduced consumption on T2DM in two steps: first, the change in BMI; and second, the effect of reduced BMI on T2DM incidence and mortality.
Similar to another study,31 change in BMI was obtained in the following steps: first, the change in SSB consumption was converted into change in energy consumption using energy density of a litre of SSB; second, the change in energy consumption was converted into change in body weight using an energy balance equation; and lastly, the change in body weight was converted into change in BMI using average height. A previous study from SA calculated the energy density of SSBs to be 1800 kJ/L.32 Multiplying the change in SSB consumption by energy density provided the change in daily energy consumption. Energy consumption was then multiplied by the energy balance equation to obtain change in body weight. A previously published energy balance equation states that to obtain a 1 kg change in body weight for adults, a daily energy change of 94 kJ was required, assuming no change in physical activity.46 Having obtained the change in body weight by sex, age and income quintile, we divided it by the square of the average height in each of the respective categories to obtain the associated change in BMI. Age, sex and quintile-specific population BMI and average height were obtained from wave 4 of the National Income Dynamics Study (NIDS) survey.47
To convert changes in BMI into T2DM incidence and associated mortality and model the impact over 20 years, we used a disease incidence model.31–33 48–50 Using data from the Global Burden of Disease study51 on the relative risk (RR) of T2DM due to one-unit increase in BMI (table 2) and the change in age-specific BMI by quintile (calculated above), the age-specific potential impact fraction (PIF) was calculated in the model. The definition of PIF is ‘the proportional reduction in incidence of a certain disease, resulting from a specific change in distribution of a risk factor in the population at risk.’52 This post-tax intervention PIF was multiplied by the age-specific incidence of T2DM at baseline to obtain the post-tax incidence. The disease incidence model then conducted a simulation such that each cohort moved forward in time using the new incidence rate until they reached a maximum age of 100 years or death. This cohort-specific simulation was repeated across the income quintiles to estimate the effect on T2DM incidence and mortality over a 20-year time period.
Input parameters used in the extended cost-effectiveness analysis of introducing a sugar-sweetened beverage (SSB) tax in South Africa
T2DM-related disease expenditures
We calculated the reduction in OOP healthcare expenditures for households and reduction in healthcare subsidies provided by the government to the patients. To estimate treatment costs, we used cost estimates per T2DM case per year in the private sector reported by the Council of Medical Schemes, and assumed the public sector costs at approximately 70% of the private sector costs.31
The SA healthcare payment system is fairly complex and OOP payments are determined by a means-tested sliding scale in the public sector and by the presence of insurance in the private sector. Public sector patients are divided into four H categories by their ability to pay. H0 patients receive 100% subsidy, H1 70%, H2 20%, while H3 patients and those privately insured receive no subsidy.53 We calculated the share of the population falling into each of these subsidisation categories, and subsequently the reduction in OOP payments using the averted cases of T2DM, the potential OOP payments for the individuals in each quintile and the utilisation rates per quintile. Similarly, we estimated the reduction in government subsidies for each averted case of T2DM.
For utilisation by income quintile, we calculated the number of individuals currently taking DM medication as the percentage of those who reported being previously diagnosed with DM (see online supplementary appendix table A2).
Financial risk protection
We used two measures of FRP. First, we used the catastrophic health expenditures (CHE) metric with disease-related expenditures exceeding 10% of total annual household expenditures and estimated the number of T2DM-related CHE cases avoided, with SSB tax introduction.54 Second, we used the number of poverty cases averted by estimating the number of cases avoiding their annual household income from dropping below the food poverty line (FPL) of ZAR321 or US$21 per capita per month (see online supplementary appendix table A3 for definition of the three SA poverty line measures and their values).
Change in additional tax revenues
We used own price elasticity estimates and SSB consumption at baseline to obtain the post-tax SSB consumption by income quintile. This new SSB consumption was then multiplied by the tax rate per litre to derive the additional tax revenue collected from each income quintile.
Indirect costs
Following the human capital approach, we estimated indirect costs capturing the loss of income due to morbidity associated with T2DM, due to absenteeism (working days lost due to illness) and presenteeism (reduced productivity at work due to illness).55 Absenteeism was calculated by multiplying the number of excess sick days in a year (about 8.6 days),56 57 by the number of diabetics in the labour force and the average daily wage by income quintile. Presenteeism was calculated by multiplying the productivity shortfall (0.6%)57 58 by the number of diabetics in the labour force and by the average annual wage.
Baseline characteristics and data sources
We obtained population estimates by age from Statistics South Africa.59 We calculated the share of each age population in each income quintile using wave 4 of the NIDS survey.47 We obtained age- and sex-specific population BMI and average height from the NIDS. SSB consumption was obtained from the All Media and Products Survey for 2013.60 The mean annual salary and labour force participation rates (LFPR) were estimated from the 2015 General Household Survey (GHS). The healthcare utilisation measure was constructed using the 2015 GHS.
Sensitivity analyses
We conducted five univariate sensitivity analyses: (1) we reduced the tax pass-through effect from 100% to 60%; (2) we altered sugar content as the producers of SSB may reduce the sugar content in response to the tax; (3) for determining CHE cases we used two different thresholds (5 and 40%) in place of the 10% threshold used in the base case; (4) we varied the utilisation for health services for each quintile; (5) instead of using the average wages by income quintile, we calculated the indirect costs using the recently approved minimum wage in SA of ZAR20 per hour.61
The pass-through rate could be different over time, across the type and location of retail stores and across countries. Evidence from SA shows that for taxes on beer, the pass-through rate of taxes to retail prices was greater than 100%.25 For SSBs, one study from Berkeley (USA) showed that in the first month the prices of SSBs increased by 61% and in the second month they increased by 93% in the retail stores that had to implement the tax due to their geographical location.23 Thus, to observe the short-term impact, we used the estimate for the pass-through effect in the shortest observed duration (60% over first month) in our sensitivity analysis. The producers may reduce the SSB sugar content and we considered two scenarios: reductions of sugar content by 10 and 20%, respectively. Reduction in sugar content will also reduce the quantum of price increase per litre of SSB as the tax is imposed on the quantity of sugar per litre of SSB. We assumed that benefits from this reduction in sugar content would be derived entirely from reduction in sugar intake and its energy conversion and not through reduction in consumption due to change in taste of SSB with lower sugar content.
For utilisation, we adopted a traditional measure of health services utilisation by calculating the percentage of individuals who reported being ill (with any disease condition) that had accessed health services in the past 30 days (see online supplementary appendix table A2). The mean utilisation was 60% with lowest utilisation of 53% in the bottom quintile and highest utilisation of 70% in the top quintile. The last sensitivity analysis of using minimum wage across all quintiles instead of average wage in each quintile provided an estimation of the T2DM economic burden as a function of LFPR and T2DM incidence by quintile, and avoided ascribing more value to individuals with higher wages.
Patient and public involvement
No patients were involved in this study.
Results
We present our findings by income quintile on: the number of T2DM-related premature deaths averted, the reduction in OOP payments, the additional tax revenues collected by the government, the cases of CHE averted and the savings in indirect costs (table 3).
Summary findings for the extended cost-effectiveness analysis of 10% tax on sugar-sweetened beverages in South Africa
Figure 3 presents the distribution of premature T2DM-related deaths averted due to a 10% SSB tax over 20 years. We estimated that 8000 deaths could be averted, and the effect would be concentrated in the third and fourth income quintiles with 47% of the deaths averted accruing in those two quintiles. The smallest effect would be among the lowest quintile with slightly more than 1200 deaths averted (16% of the total deaths averted). The low magnitude of effect in the lowest quintile could be due to the relatively lower levels of SSB consumption as compared with other quintiles.

Estimated distribution of potential type 2 diabetes mellitus (T2DM)-related deaths averted over a 20-year time period, with a 10% tax on sugar-sweetened beverage (SSB) prices. This figure shows the distribution across income quintiles of potential T2DM-related deaths averted due to a 10% tax on SSB prices over a 20-year time period in South Africa. Q1 refers to lowest income quintile, Q5 refers to highest income quintile.
Regarding reductions in OOP payments and government subsidies (figure 4), our analysis shows a reduction of ZAR1.3 billion over 20 years in OOP payments related to T2DM treatment. Since the lowest two income quintiles would pay on average 20% of their healthcare costs in OOP payments, the reduction would be smaller in these two quintiles (8% of total reduction in each quintile); 63% of the savings would accrue to the top two quintiles as they are required to pay 56–82% of their healthcare costs: OOP savings for the top two quintiles would be ZAR400 million and ZAR440 million (30% and 33% of the total reduction, respectively). Furthermore, the government would save about ZAR1.7 billion in subsidies over 20 years representing about 4% of SA’s Department of Health’s 2017/2018 annual expenditures.

Estimated distribution of the reduction of out-of-pocket (OOP) payments and government expenditures related to type 2 diabetes mellitus (T2DM) healthcare costs by income quintile, in South Africa, over a 20-year time period. This figure shows the distribution across income quintiles of reductions in OOP expenditures and government expenditures on subsidies that are related to T2DM healthcare costs due to 10% tax on sugar-sweetened beverages over a 20-year time period in South Africa. Q1 refers to lowest income quintile, Q5 refers to highest income quintile. ZAR, South African rand.
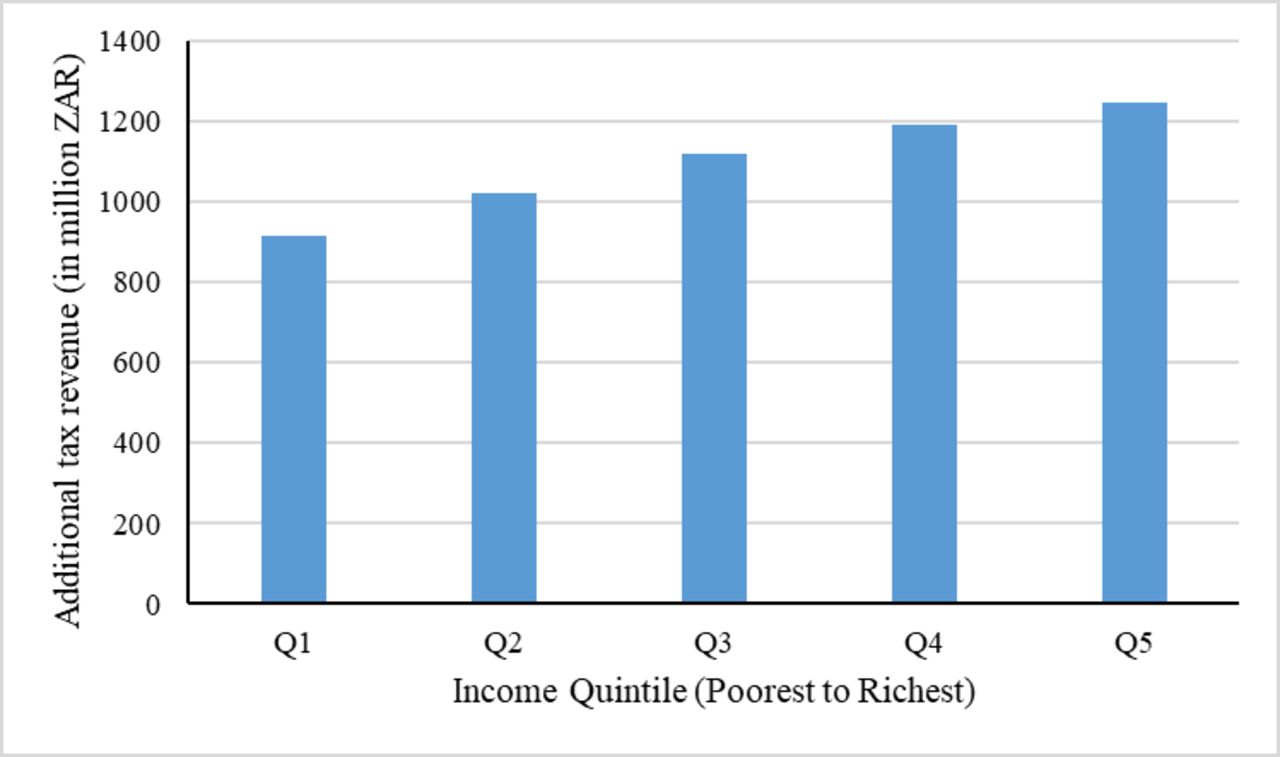
Despite the expected reduction in SSB consumption, we estimated that the government would receive ZAR5.5 billion per annum as additional tax revenues. The price elasticity for consumption is relatively low (in absolute value) in the richest quintile, where the smallest reduction in consumption would be expected. Consequently, this income group would bear about 23% of the tax revenues (figure 5). Quintiles 4 and 5 would bear 45% of the tax revenues. The bottom two income quintiles (quintiles 1 and 2) have relatively higher elastic demand and lower per-capita SSB consumption, and would contribute to a total 35% of the tax revenues.

Estimated distribution of additional tax revenues by income quintile with the sugar-sweetened beverage (SSB) 10% tax in South Africa, per annum. This figure shows the distribution across income quintiles of additional tax revenues collected per annum due to a 10% tax on SSB prices in South Africa. Q1 refers to lowest income quintile, Q5 refers to highest income quintile. ZAR, South African rand.
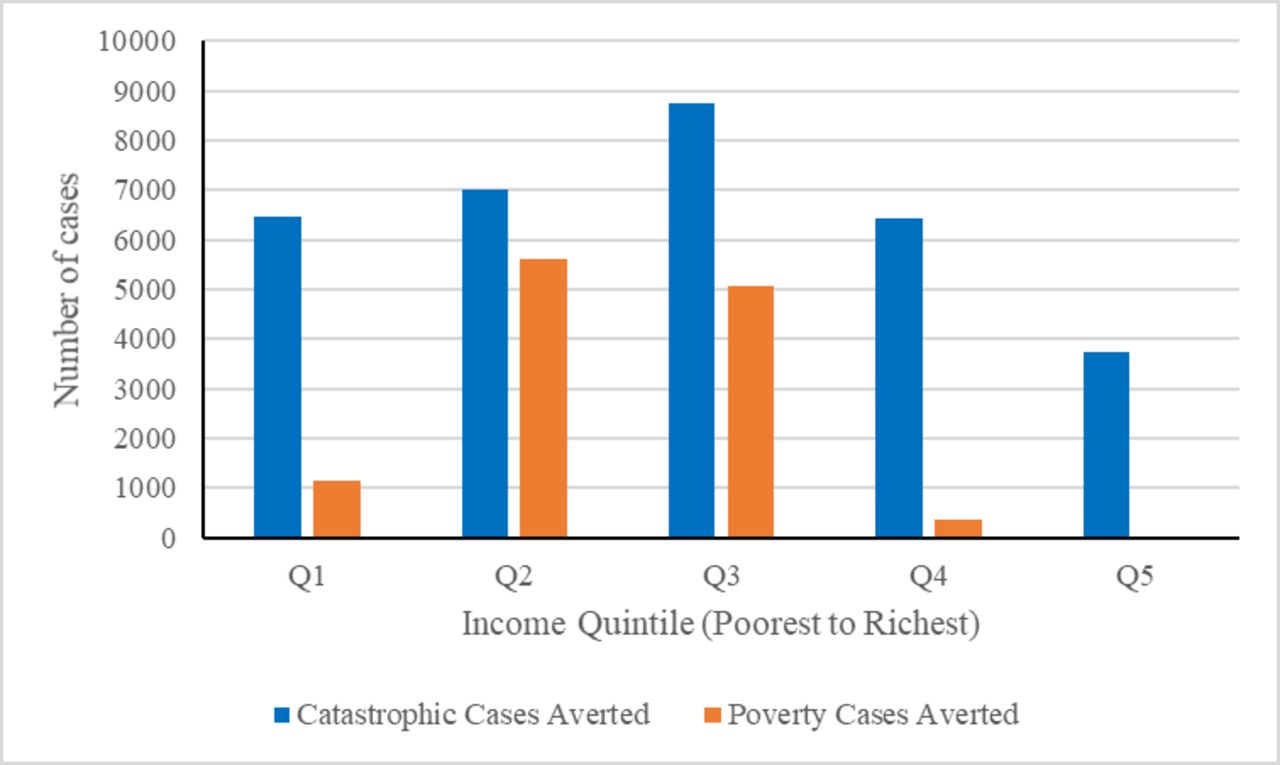
For FRP, using the FPL (ZAR321 per capita per month), about 1100 cases of poverty would be averted in the poorest quintile, while around 400 cases would be averted in the fourth quintile and none in the highest quintile (figure 6). As the average T2DM treatment cost was almost 25% of annual household expenditures (annual household expenditures for a three-person household was about ZAR103,290 (US$8370) with an annual cost of ZAR27,000), any reduction in treatment cost would likely have a significant impact on averting CHEs. We estimated that this tax policy would likely avert 6500 cases of CHE in the lowest quintile (20% of all cases averted). The number of CHE cases averted would increase to about 8700 for quintile 3 (27% of all cases). For the highest income quintile, we would observe about 3700 cases of CHE averted (12% of all cases).

Estimated number of catastrophic health expenditures and poverty cases averted over a 20-year time period, with the introduction of the sugar-sweetened beverage (SSB) tax in South Africa. This figure shows the distribution across income quintiles of catastrophic health expenditures averted and poverty cases averted due to 10% tax on SSB prices in South Africa. For determining catastrophic health expenditures, this figure uses the criterion of disease expenditures exceeding 10% of annual household expenditures. For determining poverty cases, this figure uses the food poverty line of South African rand (ZAR) 321 (US$21) per capita per month. Q1 refers to lowest income quintile, Q5 refers to highest income quintile.
Lastly, savings in indirect costs due to reduced absenteeism and presenteeism would amount to ZAR11 million per annum. The major share of these savings (ZAR7 million) would accrue to the highest income quintile due to the higher per-capita wage in this quintile, whereas the lowest income quintile would only have savings of <ZAR1 million.
Sensitivity analyses
In reducing the tax pass-through effect to a lower bound of 60%, we would observe changes in effects in both absolute and distributional terms. The total number of T2DM premature deaths averted would be reduced to 3200 (from 7800), about 59% lower than in the base case scenario (table 4); but we observed an increase in tax revenues to ZAR5.8 billion. Lastly, we estimated that 5000 poverty cases (using FPL) and 13,000 CHE cases would be averted (a reduction from 12,000 and 32,000 respectively).
Sensitivity analyses for pass-through rate and reduction in sugar content for the extended cost-effectiveness analysis of 10% tax on sugar-sweetened beverages in South Africa
In considering the impact of SSB sugar content reduction by producers in response to the tax, we re-estimated the model assuming 10% and 20% reduction in sugar content. A 10% reduction in sugar content is likely to reduce the T2DM-related deaths by 4600 while a 20% reduction in sugar content is estimated to reduce the deaths by 7000 as compared with 7800 deaths averted under the base case scenario. This policy would also reduce the annual tax revenues from ZAR5490 million in the base case scenario to ZAR2361 million (10% reduction in sugar content) and ZAR2842 million (20% reduction in sugar content).
For health services utilisation, when adopting utilisation rates for those who are ill and access healthcare services within 30 days, the FRP benefits (ie, the number of poverty cases and CHE cases averted) would be reduced (table 5).
Sensitivity analyses for healthcare utilisation rate and wage rate for the extended cost-effectiveness analysis of 10% tax on sugar-sweetened beverages in South Africa
When assigning a minimum wage of ZAR20 per hour to individuals across all income quintiles instead of using mean wage per quintile, the total productivity losses would decline to ZAR9 million per annum. The distribution of productivity losses would, expectedly, be more uniform across quintiles (table 5).
Furthermore, while using a 10% threshold, the number of CHE averted would be 32 000 whereas under a 40% threshold, it would reduce to 10 000 and under a 5% threshold it would increase to 38 000 (table 6). Using the upper bound poverty line (UB-PL) value (ZAR620 per capita per month) we estimated about 12 130 poverty cases averted in quintiles 2 and 3. The UB-PL value of ZAR620 per capita per month (ZAR7440 per annum) is about 15% higher than the upper bound cut-off value of per-capita income for the lowest income quintile (6485 per annum), and thus there would be no cases of poverty averted in this group.
Sensitivity analyses for catastrophic health expenditure thresholds for the extended cost-effectiveness analysis of 10% tax on sugar-sweetened beverages in South Africa
Discussion
SSB consumption has been linked with several obesity-related NCDs, including T2DM, certain cancers, dental caries and cardiovascular diseases. Evidence from other countries suggests that a tax on SSBs is likely to reduce consumption and reduce the increasing burden of obesity-related NCDs. In 2018, the South African government implemented a 10% excise tax on SSBs. This is expected to reduce the consumption of SSBs, related obesity and associated NCD conditions, including T2DM, and premature deaths. It is also anticipated to reduce public sector expenditures subsidising the treatment of NCDs and is expected to raise revenues.
As the number of countries considering and implementing SSB tax is increasing, there have been a number of studies modelling the potential impact of such tax on SSB consumption, obesity prevalence, disease incidence and mortality. However, most of these studies have not considered the distributional impact of the SSB tax. Only two recent studies from Australia and Indonesia have modelled the impact along income quintiles.48 62 Even in SA, a few studies had modelled the population-wide impact of SSB tax on disease mortality.31–35 Our study is one of the first to model the potential distributional health and financial impacts of SSB taxes among poor and rich households in SA using ECEA. Inequality, and especially health inequality, is still an important challenge in SA. ECEA enables us to disaggregate the population-wide impact of an intervention into effects by income quintile and on inequality. ECEA also enables us to analyse the potential regressivity of this economic intervention beyond the sole consideration of tax incidence by extending the analysis to health benefits and financial protection.
In this study, we showed that the recently implemented SA SSB tax could have the potential to reduce T2DM-related deaths. We found that the tax would reduce T2DM deaths with the greatest impact among the third and fourth income quintiles due to the relatively larger amount of SSB consumption in these groups. The reduction in OOP expenditures would be lowest in the bottom quintile and highest in the top quintile. This is reflective of the means-tested subsidies that are provided largely to households with low income, and is a testimony to the pro-poor orientation of the current South African health system. However, due to SA’s skewed income distribution, these reductions in OOP expenditures still result in significant reductions in CHE-related poverty cases.
Nevertheless, our study presents several limitations. First, we did not have direct estimates of the price elasticity of SSB consumption by income quintile. Instead, we used Mexican estimates and regressed them on upper bound values of income quintiles in SA to obtain quintile-specific elasticity estimates. The median of our scaled estimates was close to a previously identified average price elasticity in SA. Second, we did not include consideration of substitution from SSBs to other potential drink substitutes such as milk and 100% fruit juices, neither did we consider the effect of reduced consumption of potential complements to SSBs such as junk food. This is in part due to a lack of empirical estimates and expert consensus on cross-price elasticities. To the extent that substitution patterns result in positive or negative net changes in caloric intake our results would either overstate or understate the health impact of the tax. Third, as we built on previous analyses of SSB tax from SA,31–36 we only estimated the health impact of the tax on T2DM-related mortality. Consumption of SSBs and obesity are associated with several diseases and conditions like cardiovascular diseases and certain types of cancers (oesophageal, colon, breast, liver, pancreatic). In addition, in our estimation of indirect costs, we only accounted for absenteeism and presenteeism, but not for labour force dropout, premature mortality and other indirect costs such as caregiver costs. Lastly, while we acknowledge that there is heterogeneity across racial groups (as observed in the USA) in terms of SSB consumption, price elasticity, BMI distribution, disease incidence and metabolic response,63 we only modelled the average population effects by using population averages across all racial groups in SA, as the overwhelming majority of South Africans are Black Africans (about 81%)44 and due to data limitations and unavailability of modelling parameters suitable for SA. The evidence on differential metabolic response by Black and White races was also inconclusive and largely based on studies in the USA.64–66 We did not have sufficient respondents in each race, sex, age and quintile category in NIDS to calculate mean SSB consumption, BMI and height; and we did not have separate elasticity measures across racial groups; neither did we have separate distributions in disease prevalence, incidence and mortality by race in SA. As a result, analyses disaggregated across racial groups in SA are left for future work once data and evidence become available.
An important conclusion from this analysis is that SA’s SSB tax has the potential to reduce deaths due to T2DM, reduce OOP and government expenditures, and healthcare expenditure-induced poverty. As tax policy is being implemented, further evaluation is required to determine its impact on price changes, the response from sugar producers on content in SSBs, the impact on other obesity-related NCDs and to measure these among the South African population to ascertain the distributional benefits of the policy.
Acknowledgments
We thank the International Development Research Center for funding. Preliminary versions of this paper were presented during seminars at the University of the Witwatersrand School of Public Health and the Harvard TH Chan School of Public Health where we received valuable comments from seminar participants.
References
Footnotes
Handling editor Sanni Yaya
Contributors SV, NS and KH conceived the study. SV supervised the study. AS, NS, CM and PDRP collected the data. AS performed the calculations and interpreted the results with SV and NS. AS wrote the first draft of the manuscript. All authors reviewed and edited the manuscript. The corresponding author had full access to all the data in the study and had the final responsibility for the decision to submit for publication.
Funding This work was funded by the International Development Research Centre (grant#108424-001).
Disclaimer The funder had no role in the study design, data collection, data analysis, data interpretation or writing of the report.
Competing interests None declared.
Patient consent for publication Not required.
Provenance and peer review Not commissioned; externally peer reviewed.
Data availability statement Data are publicly available.