Article Text

Abstract
Introduction India has the world’s highest burden of tuberculosis (TB). Private retail pharmacies are the preferred provider for 40% of patients with TB symptoms and up to 25% of diagnosed patients. Engaging pharmacies in TB screening services could improve case detection.
Methods A novel TB screening and referral intervention was piloted over 18 months, under the pragmatic staggered recruitment of 105 pharmacies in Patna, India. The intervention was integrated into an ongoing public–private mix (PPM) programme, with five added components: pharmacy training in TB screening, referral of patients with TB symptoms for a chest radiograph (CXR) followed by a doctor consultation, incentives for referral completion and TB diagnosis, short message service (SMS) reminders and field support. The intervention was evaluated using mixed methods.
Results 81% of pharmacies actively participated in the intervention. Over 132.49 pharmacy person-years of observation in the intervention group, 1674 referrals were made and 255 cases of TB were diagnosed. The rate of registration of symptomatic patients was 62 times higher in the intervention group compared with the control group (95% CI: 54 to 72). TB diagnosis was 25 times higher (95% CI: 20 to 32). Microbiological testing and test confirmation were also significantly higher among patients diagnosed in the intervention group (p<0.001). Perceived professional credibility, patient trust, symptom severity and providing access to a free screening test were seen to improve pharmacists’ engagement in the intervention. Workload, patient demand for over-the-counter medicines, doctor consultation fees and programme documentation impeded engagement. An additional 240 cases of TB were attributed to the intervention, and the approximate cost incurred per case detected due to the intervention was US$100.
Conclusions It is feasible and impactful to engage pharmacies in TB screening and referral activities, especially if working within existing public-private mix (PPM) programmes, appealing to pharmacies’ business mindset and among pharmacies with strong community ties.
- tuberculosis
- active case finding
- private provider
- intervention
- mixed methods
- pharmacist
This is an open access article distributed in accordance with the Creative Commons Attribution Non Commercial (CC BY-NC 4.0) license, which permits others to distribute, remix, adapt, build upon this work non-commercially, and license their derivative works on different terms, provided the original work is properly cited, appropriate credit is given, any changes made indicated, and the use is non-commercial. See: http://creativecommons.org/licenses/by-nc/4.0/.
Statistics from Altmetric.com
Key questions
What is already known?
In India, up to 40% of patients with tuberculosis (TB) symptoms visit pharmacies as the first point of medical contact, but are seldom referred for TB screening and testing services.
What are the new findings?
A TB screening and referral intervention was implemented via the staggered recruitment of 105 pharmacies engaged in a public–private mix (PPM) programme in Patna over 18 months.
Rates of registration of symptomatic patients were 62 times higher in the intervention group compared with the control group (95% CI: 54 to 72), TB diagnosis was 25 times higher (95% CI: 20 to 32) and microbiological testing and test confirmation were also higher (p<0.001).
The intervention was acceptable to pharmacy providers, and the approximate cost incurred per case detected due to the intervention was US$100.
What do the new findings imply?
It is feasible and impactful to engage private retail pharmacies in TB screening and referral services.
We recommend working with existing PPM programmes, especially in communities with high patient–pharmacist trust, and utilising a mix of incentives that are tailored to pharmacies’ business as well as health professional mandate.
Introduction
India has the world’s highest burden of tuberculosis (TB) and ‘missing patients’ who are either undiagnosed or not notified to the TB programme.1 This is a major challenge to disease elimination. On average, a patient with TB visits three providers, and experiences a delay of 55 days before being diagnosed and initiating TB treatment.2 3 Plugging early leaks in the TB care cascade and reducing transmission and incidence, by strengthening the steps between symptom screening, diagnosis and case notification, is thus a national priority.4 5
As 50% of India’s TB is managed outside of the public sector,6 7 engagement with private providers is essential. The Revised National TB Control Programme (RNTCP) has implemented public–private mix (PPM) programmes through private–provider interface agencies (PPIA).8 Projects actively contribute to national TB case notifications and treatment outcomes.1
With over 750 000 retail outlets, private pharmacies have an especially vital role to play. Their long hours of operation, drug inventory, and lack of queues and consultation fees make them popular access points for medical services.9 10 They are the first point of medical contact among up to 40% of individuals with TB symptoms in India, and 25% of patients continue to seek advice from pharmacies even after diagnosis, preferring to avoid doctor consultations.11 12 However, studies show that pharmacy providers commonly dispense cough syrups, anti-histamines, bronchodilators and antibiotics over-the-counter (OTC), rather than refer patients to a doctor for TB testing and treatment.13–15 Self-medication and poor referral practices can delay TB diagnosis.2 3 The overuse of broad-spectrum antibiotics such as fluoroquinolones may also lead to TB drug resistance.16
Private pharmacies in India have been engaged in TB treatment education, and screening and referral initiatives within PPM projects but participation has been low.17–20 In 2013, the RNTCP recommended pharmacists actively triage and refer patients presenting with cough longer than 2 weeks to microscopy centres for sputum testing.21 However, this initiative was also not widely taken up. In many Indian cities, TB continues to be clinically or empirically diagnosed.22 In 2015–2017, we took these regional norms and experiences into consideration, and piloted a novel TB screening and referral intervention among private pharmacies to improve TB case detection.
Methods
Setting
The city of Patna (population. 6.5 million) has lower than average rates of income, health, literacy and infrastructure. TB incidence is 326 per 100 000 population. A recent patient pathway study found that 18% of people with TB first sought medical care from private community pharmacies before any other formal or informal provider.23 This, combined with the fact that a city-wide PPM project was already ongoing in Patna, made it an optimal site for the pilot intervention.
Program context
The intervention was nested into Universal Access to TB Care (UATBC), a PPM programme between the Bihar state government and PPIA World Health Partners (WHP),24 under an operational research framework. Since 2013, UATBC has engaged over 1500 of Patna’s licensed private practices (medical doctors, laboratories, pharmacies and informal providers) in standardised TB management, via a state-sanctioned memorandum of understanding (MOU). TB tests and treatment are provided at no cost, akin to coverage in the public sector. New diagnoses are notified to the RNTCP; patients may transfer into the public programme at any point. Test, treatment and referral activities are facilitated through programme vouchers and a call centre, to support integration into the RNTCP’s electronic data platform, eNikshay. Incentives include the following: Rs 50 (US$0.80) to pharmacy and informal providers for completed doctor referrals, Rs 50 (US$ 0.75) to doctors and informal providers for completed radiographic and/or microbiological tests and Rs 200 (US$3) to doctors and informal providers for any referrals that result in TB notification. Doctor consultation fees (ranging Rs 200–500 or US$3–7.50 per visit) are not covered but some providers offer free or discounted consultations to very poor patients. In 2016, 84% of 22 291 TB case notifications in Patna came from the private sector, including from UATBC.25
Situation analysis
UATBC programme data showed that 554 of the city’s 972 mapped pharmacies were engaged in the PPIA programme in 2014–2015; 33% of pharmacies participated in TB drug dispensing activities but only 16% participated in screening and referral activities (WHPs 2014–15 programme data, unpublished). In September 2015, a situation analysis involving consultations with UATBC programme managers and engaged private providers (14 pharmacy providers, 6 doctors and 4 laboratories) was conducted. Pharmacies, though mandated to be owned and operated by licensed pharmacists, were commonly run by persons with diverse levels of licensure and training. A multidimensional model for improving pharmacies’ engagement in TB screening and referral was developed keeping this reality in mind, including a revised training curriculum and referral protocol that was tailored to align with established private provider networks; retail competition; varying training and capacity of front-line pharmacy providers; and poor professional oversight, technical and human resources. The incentive plan was matched to that of informal providers and doctors.
Pharmacy provider recruitment
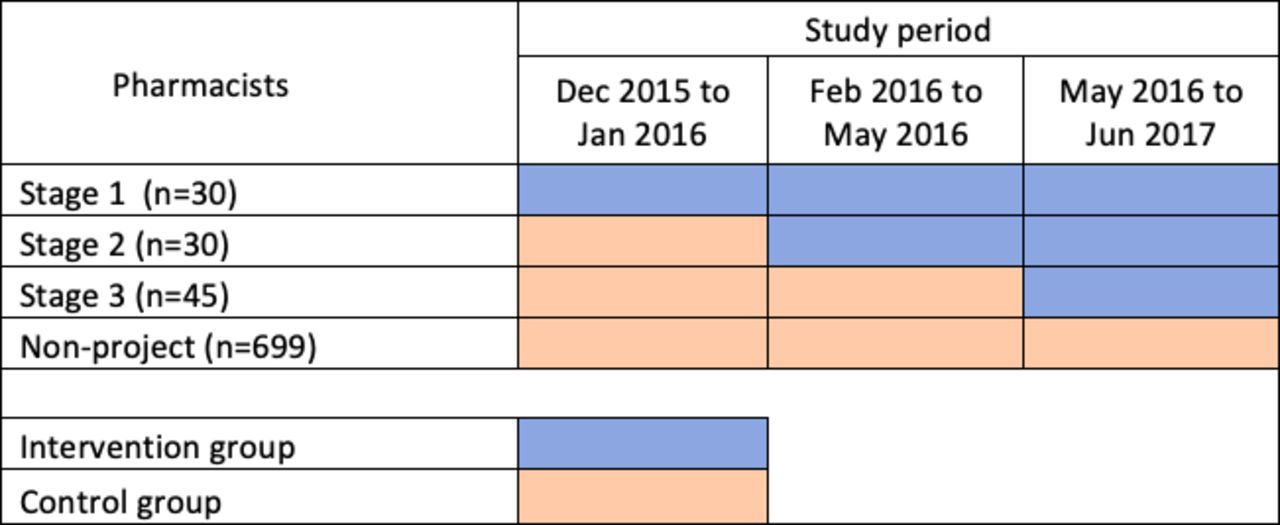
In December 2015, 804 private pharmacy providers were enrolled in the UATBC programme. Under a pragmatic approach, a proportional random sample of 105 providers from three lower-income city areas was invited to participate in the pilot intervention. Providers were given opportunity to decline without it affecting their participation in the parent programme. All providers approached agreed to participate. They were recruited into the intervention in a staggered manner at three time points (figure 1). The first set of 30 providers were trained and began participating in the intervention in December 2015, the second set of 30 were trained and began in February 2016 and the third set of 45 were trained and began in May 2016. Each participating provider was thus allocated a pre-participation time period (control group) and a participating time period (intervention group) to enable assessing differences in referral practices. In parallel, referral rates among 699 of the 804 programme pharmacy providers who were not included in the pilot intervention were observed, to account for any changes in referrals over the intervention period, independent of the intervention. These data were included in the control group.

Staggered recruitment of 105 out of 804 pharmacy providers into the intervention arm and follow-up time periods.
Intervention components
The five components of the pilot intervention were:
Training: Interactive training workshops were held at baseline and 3 months later. Topics included TB symptomology; TB screening and diagnostic testing; antibiotic stewardship; study referral practices and documentation. One-on-one refresher trainings were provided as needed. All persons working within pharmacies were included in training.
TB screening and e-referral: Pharmacy providers screened all adults presenting with cough or requesting a medication to alleviate cough for TB symptoms: specifically, cough longer than 2 weeks, fever, night sweats, bloody cough, weight loss, personal/family history of TB. Patients with an unresolved cough lasting longer than 2 weeks were referred for a chest radiograph (CXR) followed by doctor consultation, irrespective of the CXR result, or directly for a doctor consultation. Referrals were made via UATBC programme vouchers. Patients were referred to 1 of 10 private laboratories and 54 private doctors located in the same city areas and engaged with UATBC, as per their preference. Patients who were below 18 years of age, pregnant, with recent history of CXR (past month), any history of TB, already under the care of a medical doctor, diagnosed with a respiratory condition (eg, asthma) or who declined a CXR, were referred for a direct doctor consultation only. Additional TB testing and all TB diagnoses were made by doctors only, not pharmacy providers.
Incentives: Pharmacy providers received Rs 100 (US$1.50, akin to programme doctors and informal providers) for each completed CXR referral. If the referral resulted in a case notification, they received an additional Rs 200 (US$3, akin to programme doctors and informal providers). They continued to receive their usual incentive (Rs 50 or US$0.75) for completed doctor referrals. Payments were directly made to providers by the parent programme, within 1 week, via bank transfer.
E-health messages: Pharmacy providers received weekly automated SMS messages to reinforce training, and remind them to screen and refer symptomatic patients. They also received individualised messages conveying the number of referrals, proportion notified and incentive earned each month. Messages were sent using a bulk local SMS provider, MVaayo.
Supervision and monitoring: Human resources (two full-time field officers, and part-time field coordinator and data manager) were deployed for field support and supervision, data recording, reporting and verification. Pharmacies were visited minimum once every 2 weeks by a field officer for troubleshooting and to encourage participation. Quarterly meetings were held to discuss implementation, and make refinements under an operational research framework.
Data collection
Quantitative methods
Quantitative data were collected from December 2015 to June 2017 from all 804 UATBC pharmacy providers from the programme database: month-wise number of referrals per provider and number of TB cases detected as a result of these referrals; and for each pharmacy referral, the date of patient registration, CXR referral and completion, doctor referral and completion, microbiological diagnostic test referral and completion, CXR and diagnostic test outcomes, number of diagnosed patients initiating treatment, and date of treatment initiation. An assessment of whether the referral was made during the pilot intervention was made based on the date of providers’ entry into the intervention period and date of patient registration. Patient data were de-identified.
Qualitative methods
Qualitative data were collected from February 2016 to June 2017. Nine focus group discussions (FGDs)26 were held with 83 intervention providers during quarterly meetings at a central non-study location where lunch was provided. In all, 22 providers were unable to attend a FGD, and participated in private interviews at their places of practice.27 FGDs and interviews were conducted in Hindi and audio-recorded by a local qualitative interviewer. The following broad topics were discussed: experiences and challenges serving the community; specific experiences with TB service delivery; interactions with patients and other providers involved in TB care; and opinions and feedback about the intervention. Providers were familiar with one another from having participated in the UATBC programme; hence rapport was easily established. The interviewer used culturally sensitive language to stimulate open discussions about their shared experiences, nuances and differences, and probed needs and preferences related to the intervention.
Analysis
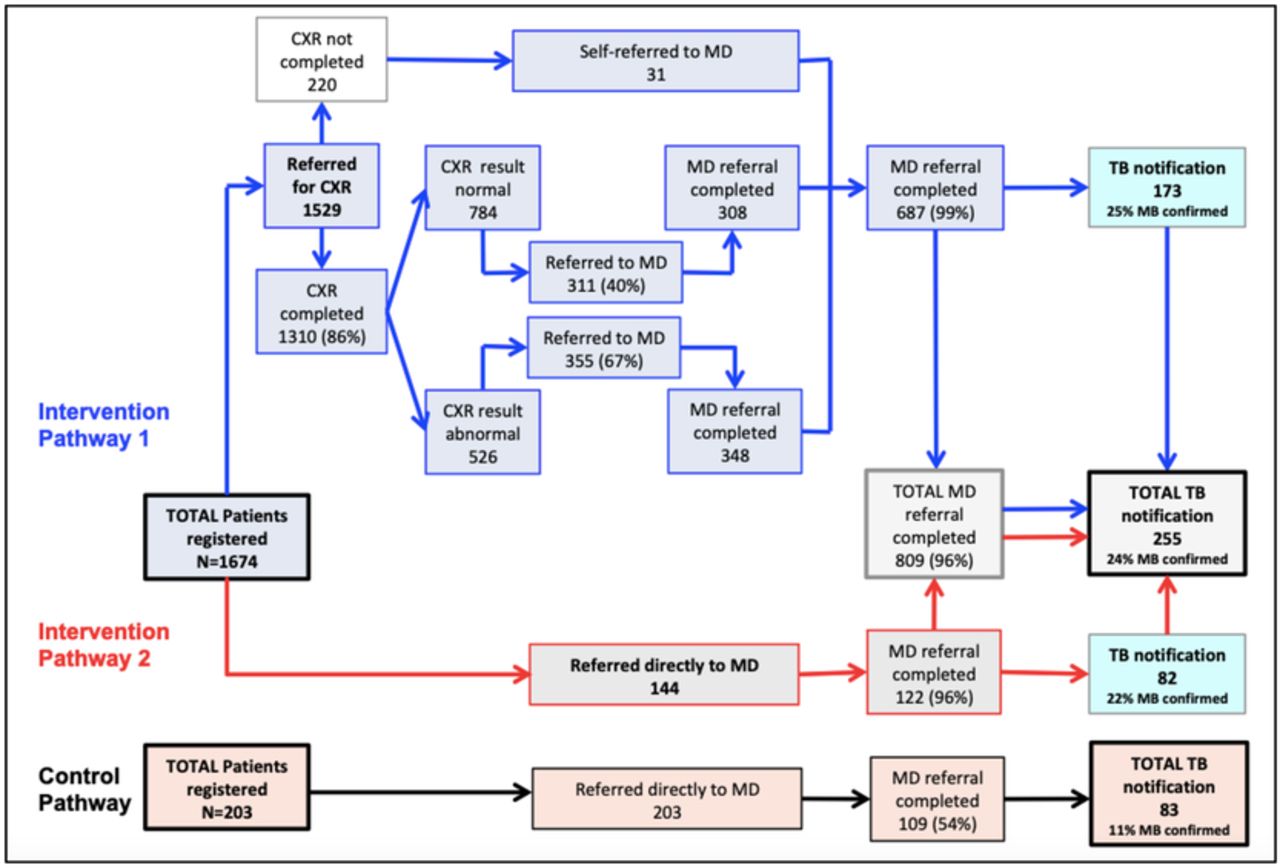
Quantitative data on the diagnostic evaluation cascade are displayed within a flow diagram indicating the number of patients registered, and number and proportion of patients who underwent a CXR, doctor referral, sputum test (smear and/or Xpert MTB/Rif assay) and were diagnosed with TB (figure 2). The aggregate person-days of observation in the intervention period and the aggregate person-days of observation in the control period were calculated for all 804 pharmacy providers to measure the ‘crude’ intervention effect. TB symptomatic patients referred and TB cases detected during the intervention and non-intervention periods were compared. Four outcomes were subsequently determined: (1) number of symptomatic persons registered per provider person-year of observation (PYO) during the intervention period; (2) number of symptomatic persons registered per provider PYO during the control period; (3) number of patients with TB diagnosed per provider PYO during the intervention period and (4) number of patients with TB diagnosed per provider PYO during the control period. The first two rates (1 and 2) were compared to assess the relative difference in the rate of registration of persons with TB symptoms during the non-/pre-intervention and intervention periods, and next two rates (3 and 4) were compared to assess the relative difference in TB cases diagnosed during the non-/pre-intervention and intervention periods. Crude rate ratios for comparing the rates of persons with TB symptoms and TB cases detected during intervention and control periods were estimated by the conditional maximum likelihood estimate method; 95% CI were estimated by the Mid-P Exact method.28 Characteristics of patients diagnosed with TB during the intervention and control periods were evaluated by χ2 independence test (for categorical variables) and Wilcoxon rank-sum test (for non-normally distributed continuous variables); a p value<0.05 was considered as statistically significant.

Pathway to TB diagnosis for symptomatic persons visiting pharmacies in intervention and control groups. CXR, chest radiograph; MD, medical doctor; TB, tuberculosis.
FGD and interview data were transcribed, translated, coded and thematically analysed29 by two team members with expertise in qualitative research, in consultation with the interviewer, field staff and other team members, to assess pharmacy providers’ perspectives towards the intervention. Findings from early FGDs were probed in subsequent FGDs and interviews to improve analytic reliability and confirmability.30 A brief description of the qualitative findings is provided; comprehensive qualitative analyses will be disseminated separately. We drew on the SQUIRE 2.0 and COREQ checklists to report on the quantitative and qualitative outcomes, respectively.
Ethics
The state-sanctioned UATBC programme granted permission to nest the pilot intervention into its ongoing routine service delivery programme. A supplementary MOU was created and signed by all pharmacy providers participating in the pilot. They also signed an informed consent form to participate in FGDs or interviews. Patients diagnosed under the pilot intervention were treated via the routine UATBC programme by the Bihar state government. Patient data were de-identified; patients were not required to be consented. Institutional ethics approval was also granted by the Research Ethics Office of the McGill University Health Centre (Ref 15–360).
Patient and public involvement
The intervention model aligns with patient preferences to access medical advice and services at retail pharmacies. However, study participants were pharmacy providers; patients were not involved in recruitment and conduct.
Results
Person-days of observation
In the intervention group, there were a cumulative of 48 360 provider person-days of observation and in the control group there were 397 860 provider person-days of observation (table 1).
Cumulative pharmacy provider person-days of observation in intervention and control groups
Pharmacy provider participation
The intervention was implemented over 18 months (December 2015–June 2017). Of 105 enrolled pharmacy providers, 84 (81%) made at least one referral during the intervention period: 81 (77%) referred patients for a CXR followed by doctor consultation, whereas 35 (33%) referred patients directly for a doctor consultation. All providers who made direct doctor referrals also referred patients for a CXR. By contrast, 12 (11%) of these 105 enrolled providers and 37 (5%) of the 699 non-enrolled providers made a doctor referral during the control period.
Pathway to diagnosis
In the intervention group, patients went through two diagnostic pathways (figure 2). Overall, 1674 persons with TB symptoms were identified, of which 255 were diagnosed with TB.
Pathway 1: Patients were initially referred for a CXR (n=1529). Of these referred, 687 (45%) reached a doctor (656 after undergoing CXR and 31 without undergoing CXR) and of those who reached a medical doctor, 173 (25%) patients were diagnosed with TB, with 25% microbiologically confirmed.
Pathway 2: Patients were directly referred to a medical doctor for TB diagnostic evaluation (n=144) of which 122 (85%) reached a doctor and of those who reached a medical doctor, 82 (67%) were diagnosed with TB, with 22% microbiologically confirmed.
In the control group, patients went through Pathway 2 alone: 203 persons with TB symptoms were identified and 83 (41%) were diagnosed with TB, with 11% microbiologically confirmed.
Referral completion
In the intervention group, 86% of 1529 patients referred by a pharmacy provider for a CXR abided by the referral and underwent a CXR, and 96% of total 809 patients referred to a medical doctor (regardless of the pathway) completed the doctor consultation. This compared with a 54% doctor referral completion rate in the control group, a difference of 42% (95% CI: 35% to 49%). In the intervention group, 348 (66%) out of 526 patients with an abnormal CXR result reached a doctor, compared with 308 (39%) out of 784 patients with a normal CXR result, a difference of 27% (95% CI: 22 to 32). Patients with an abnormal CXR result were 1.68 times more likely to reach the doctor (895% CI: 1.51 to 1.87).
Identification of TB symptoms, TB diagnosis and treatment initiation
A total of 1674 patients with TB symptoms were registered in the intervention group (12.63 patients per provider PYO) as compared with 203 (0.19 patients per provider PYO) in the control group (table 2). The registration rate of persons with TB symptoms was 62 times higher (95% CI: 54 to 72) in the intervention group. Similarly, 255 patients (1.92 patients per provider PYO) were diagnosed with TB in the intervention group as compared with 83 patients (0.08 patients with TB per provider PYO) in the control group. The TB diagnosis rate was 25 times higher (95% CI: 20 to 32) in the intervention group. All patients diagnosed with TB in the intervention and control groups were initiated on treatment.
Identification of patients with TB symptoms and TB diagnosis in intervention and control groups
Patient characteristics
In all, 255 patients were diagnosed with TB in the intervention group compared with 83 in the control group (table 3). The median age and sex were similar in both groups. Patients diagnosed with TB in the intervention group were more likely to undergo CXR and microbiological tests (sputum smear and GeneXpert tests).
Comparison of patients diagnosed with TB in intervention and control groups
Diagnostic delay
The date that patients were registered by the pharmacy provider was considered the date of first provider contact. The median duration from symptom onset to first contact was 30 days (IQR 20–60) in the intervention group. However, these data were not collected in the control group. The median duration between first contact with the pharmacy provider to TB treatment initiation was 5 days (IQR 3–12) in the intervention group, compared with 1 day (IQR 0–8 days) in the control group.
Intervention acceptability
FGDs and interviews revealed insights into the mechanisms, barriers and facilitators of pharmacy providers’ referral practices and perspectives on referral completion (table 4). All quotes are taken from intervention pharmacy providers.
Potential barriers and facilitators to TB screening and referral from the perspective of intervention pharmacy providers
Referral practices
Providers appreciated participating in the pilot programme and exchanging feedback. They felt they had made a positive contribution to their community. The ability to ‘dispense’ a screening test gave them a sense of professional responsibility and pride that was missing with routine doctor referrals.
I feel good that I am being able to serve my society. People are benefitting. We are able to provide care and people are getting better.
This was cited as a major personal incentive among those who regularly referred patients, especially among providers working in poorer, less dense parts of the city who reported stronger relationships with patients, dealt with repeat customers, and were less busy than their urban counterparts.
Providers felt pressured to provide symptomatic patients with a tangible resolution beyond a doctor referral; a free CXR test was thus welcomed. However, many reported delaying referral of eligible symptomatic patients in favour of short courses of antibiotic such as amoxicillin, azithromycin and on occasion ciprofloxacin, as a first step, to meet patients’ demand for OTC medicines and avoid losing patients to competitors. Prompt referrals were reserved for patients whose symptoms persisted despite a round of antibiotics, or those who looked very ill.
For one week we give antibiotics. When they do not improve with it, then we send for investigation.
Many people insist on getting medicines, then we convince them. If fever and cough are for long, then we send for X-ray.
Providers with low referral rates said they did not see many symptomatic patients, or catered to patients who visited pharmacies specifically to buy medicines. Such patients tended to be more educated, affluent and preferred to seek advice directly from a doctor; pharmacy providers did not want to disrupt this dynamic. Several non-participating pharmacies were also located in larger health centres that specialised in other disease states (eg, oncology).
Incentives and reminders
Providers appreciated receiving incentives via rapid direct deposits, and enjoyed individualised SMS reminders indicating their monthly ‘performance’. However, incentives were not the driving force behind referral decisions for patients with severe symptoms who, as described earlier, were immediately referred to doctors, regardless of CXR eligibility or the loss of incentive.
Programme documentation
Documentation of referrals was a deterrent to participation in the general programme as well as the intervention. Many providers verbally referred patients for a doctor consultation, as part of standard practice, omitting entries from programme vouchers and forfeiting incentives. These pharmacies catered to large volumes of patients who expected an immediate resolution; they did not have time to complete programme vouchers. Doctor referrals also resulted in small incentives and no savings to patients, who still had to pay consultation fees; hence, they were less often documented. CXR referrals, on the other hand, were documented because they were considered a new activity and a documented referral was required to access the free test; though here too, busy pharmacies suggested using simpler vouchers.
Patients do not want to wait, the faster the service the better.
We should be allowed to give the paper coupon and patient may go to get the test done.
Referral uptake
Completed referrals were attributed to patient–pharmacy provider trust and communication, and symptom severity. The direct offer of a free test before visiting and paying consultation fees to see a doctor drove up CXR referrals. A positive CXR result drove up doctor referrals.
People who came to us were those who were hesitant in visiting a doctor, considering the fees, tests. They would have to spend money first and then get any diagnosis. But when they came to us we could offer the test free of cost right at the beginning. There are many patients who are not willing to spend money at the beginning.
Incomplete referrals were attributed to distance from or a lack of familiarity with a referred laboratory or doctor (even for doctors who waived their fee), low perceived symptom severity, and patient mistrust in pharmacy providers’ advice which was common among affluent patients.
People like to go to labs with a good name and fame… consult a reputed doctor. And people do not like to travel far… If I send from here to [far], patients will say they may save money on test but transportation will cost them more. So they feel better to get tested at a nearby lab.
People who are of a high social stature do not listen to us, they will never agree to our advice. We convince and send the poor.
Incomplete doctor referrals were attributed to high consultation fees.
I will refer to a network doctor so that he can get free medicines. But the network doctor asks for fees. Then it becomes difficult to convince the patients… Many people drop out due to their unwillingness to pay the consultation fees.
Intervention cost
The intervention incurred a cost of US$24 025 over 48 360 provider PYO in the intervention group, including incentives for CXR referrals and case notifications (Rs 165 200 or US$2470); e-health text messaging services (Rs 3750 or US$55) and human resources (salaries of two dedicated field staff, part-time intervention coordinator and data manager, equalling Rs 1 440 000 or US$21,500). Without the intervention, if all 804 pharmacy providers had remained in the baseline UATBC programme, we would expect to have detected about 98 cases during the study period (0.08 cases per provider PYO, from table 2). As a result of the intervention, 338 cases were detected by the same cohort of 804 pharmacies. Thus, 240 additional TB cases may be attributed to the intervention, and the approximate cost incurred per case detected due to the intervention was US$100. This was over and above UATBC programme costs, which covered patient tests, treatment, as well as management of pharmacy referrals.
Discussion
This paper describes the pragmatic and operational research implementation of a multidimensional TB screening and referral intervention among private pharmacies in Patna, India. The study’s strengths are rooted in its mixed methods approach, which allowed us to quantify the intervention’s effect on TB case detection, and explain pathways by which it was acceptable (or challenging) to pharmacy providers.
The idea of engaging pharmacies in the TB care cascade is not new. They have helped to dispense TB treatment or deliver adherence support.31–33 A few interventions have attempted to improve pharmacy referral of symptomatic patients to the national TB programme or in some cases to private doctors engaged in PPM programmes. Participation, however, has been low, with only 30%–40% of pharmacy providers referring symptomatic patients for TB screening and testing.20 34–38 In our study, participation (81%) and referral completion (86%–96%) were very high. Our participatory approach may have helped, including early programme stakeholder consultations and regular participant feedback sessions. Additionally, in previous models, pharmacy referrals have required patients to visit doctors or direct observation of treatment (DOT) centres before undergoing TB testing. Informed by our work with private providers in the region,14 39–41 we directly connected patients to laboratories before visiting a doctor. This led to a 64-fold higher rate of referral of symptomatic patients, and a 25-fold higher rate of TB diagnosis. FGDs also revealed that providers were especially motivated to refer patients for a screening test, over and above their baseline ability to refer patients to a doctor. However, documentation was a barrier to participation. Reports of undocumented verbal referrals suggest providers may have made a higher number of referrals than captured. Study forms were developed in consultation with pharmacies involved in the situation analysis, during which time simple mobile apps or barcodes were considered unfeasible because most providers did not use smartphones or computers. Greater efforts to simplify monitoring and evaluation processes could improve participation of busy providers. Wider use of smartphones may also afford innovative mechanisms.
Although higher in the intervention group, the rate of TB diagnosis in patients who were directly referred to a doctor was generally quite high when compared with those who first underwent a CXR. Qualitative data explain that pharmacy providers immediately referred patients who they considered to be very ill to a doctor, regardless of the intervention or CXR eligibility. Microbiological confirmation among intervention group patients was also higher than in the control group. Having symptomatic patients undergo a screening test before a doctor visit may thus be an effective mechanism to improve microbiological test referrals and promote higher quality diagnostic care.
The intervention’s impact on time to TB diagnosis was unclear. Patient delay,2 or time from symptom onset to first contact with a health provider, was not captured in the control group. It was slightly longer in the intervention group (median 20 days) compared with that found in a national systematic review (18 days)2 and Patna-based patient pathways study (15 days).12 This may be because traditional pathways studies rely on patient reports of symptom duration, whereas we relied on pharmacy provider reports, where many would have dispensed antibiotics before registering patients. Health system delay, or time from first provider contact to treatment initiation, was longer in the intervention compared with control group (5 vs 1 day). This may be attributed to the additional time taken to undergo diagnostic tests by intervention group patients, given that the proportion of CXR and microbiological tests was all significantly higher than in the control group. By contrast, clinical diagnoses (ie, diagnoses based on clinical assessment with no other testing) were significantly higher in the control group.
Incentives can promote behaviour change. In previous studies, pharmacy providers have been compensated US$0.80–1 per TB notification and $5 to transfer privately managed patients to the public sector.20 36 Visits to doctor offices and DOT centres have also been arranged to build accountability and appeal to pharmacy providers’ professional mindset.38 During the situation analysis, monetary incentives were deemed necessary for pharmacy participation. However, FGDs revealed that many providers were motivated by reputational gains and a genuine readiness to connect sick patients to medical care. This was especially relevant for providers working with poorer populations, as compared with those working with affluent clients in more developed, urban areas. Nonetheless, FGDs also revealed that patient demand for OTC medicines, and concerns of attrition, thwarted best practices in OTC drug dispensing.
An additional 240 cases of TB were detected due to the intervention, costing US$100 per case detected above the costs of the baseline PPIA programme. Models of active case finding for TB in India conclude that interventions costing up to US$1000 per case detected may be considered cost-effective.42 While we did not undertake a cost-effectiveness analysis, our model may be a fiscally feasible strategy.
The study had several limitations. We were unable to capture numbers of symptomatic patients who presented at pharmacies during the intervention and control periods; only patients who were registered and referred were recorded. It was difficult to gauge the intervention’s impact on timing or volume of OTC drug sales, as these records were unavailable. Qualitative data suggest that only some providers may have replaced the offer of an OTC drug with a screening test. We were also limited in identifying objective characteristics of high-performing versus low-performing providers. Qualitative data suggest the intervention may be most relevant for pharmacies catering to lower-income clients.
We accordingly suggest that future engagement of pharmacy providers in TB screening and referral activities includes the following constituents. First is pharmacist–patient trust. This may be easier to establish within resource-poor neighbourhoods where pharmacies are a common first point of contact. Second is a multipronged approach to enticements. We found timely monetary incentives aligned with pharmacies’ revenue generating mandate, performance reports reiterated the value of their participation and training underscored the day-to-day realities of running a business as opposed to just normative expectations about professional pharmacy practice. (We recommend further reducing or easing provider documentation.) Third is creating liberal referral pathways by engaging wide numbers of doctors and laboratories. This would meet the needs of patients who decide on providers based on individualised algorithms around distance, cost and reputation, and the needs of gatekeeping pharmacy providers whose personal opinions and networks may govern how referrals are made. As most PPM projects do not cover doctor consultation fees, options should be conceived to cater to patients needing urgent TB care. In our study, patients’ expectation to be referred to familiar and reputed providers appeared important for referral completion. Last is a strong PPM infrastructure. We were able to piggyback on the foundational efforts of the UATBC programme, wherein networks of private pharmacies, doctors and laboratories, and referral procedures were already established.
Conclusion
This study successfully engaged private pharmacy providers in India in a novel TB screening and referral intervention. The rate of patient registration into the TB care cascade and TB diagnosis significantly increased under the intervention. The intervention was acceptable to pharmacy providers, and associated with improved quality of diagnostic care, in particular improved rates of microbiological testing. Identified barriers and facilitators to implementation should be considered if the model were to be scaled up.
Acknowledgments
The authors thank the UATBC programme pharmacy providers, patients and providers, and staff at World Health Partners and the Research Institute of the McGill University Health Centre. The authors are especially grateful to Sirisha Papineni, Kamal Nath Ojha, Sanjay Kumar, Sushant Krishna Jha, Vaibhav Saria, Pardeep Sinha and Sophie Huddart for their research support.
References
Footnotes
Handling editor Seye Abimbola
Contributors AD and SS wrote the first draft. AD, SS, NJ, MS, SM, CV and MP reviewed and approved the final version.
Funding The study was funded by the IC-IMPACTS Centres of Excellence. AD is supported by a Research Scholars award from Fonds de Recherche Santé. MP is supported by a Canada Research Chair award from the Canadian Institutes of Health Research.
Competing interests None declared.
Patient consent for publication Not required.
Provenance and peer review Not commissioned; externally peer reviewed.
Data availability statement Data are available upon reasonable request.