Article Text

Abstract
Introduction Understanding patterns of antibiotic consumption is essential to ensure access to appropriate antibiotics when needed and to minimise overuse, which can lead to antibiotic resistance. We aimed to describe changes in global antibiotic consumption between 2011 and 2015.
Methods We analysed wholesale data on total antibiotic sales and antibiotics sold as child-appropriate formulations (CAFs), stratified by country income level (low/middle-income and high-income countries (LMICs and HICs)). The volume of antibiotics sold per year was recorded for 36 LMICs and 39 HICs, measured in standard units (SU: 1 SU is equivalent to a single tablet, capsule or 5 mL ampoule/vial/oral suspension) and SU per person, overall and as CAFs. Changes over time were quantified as percentage changes and compound annual growth rates in consumption per person. Analyses were conducted separately for total sales, sales of antibiotics in the Access and Watch groups of the WHO’s Essential Medicines List for children 2017, for amoxicillin and amoxicillin with clavulanic acid.
Results Antibiotic consumption increased slightly between 2011 and 2015, from 6.85×10¹⁰ SU to 7.44×10¹⁰ SU overall and from 1.66×10¹⁰ SU to 1.78×10¹⁰ SU for CAFs. However, trends differed between countries and for specific antibiotics; for example, consumption of amoxicillin as CAFs changed little in LMICs and HICs, but that of amoxicillin with clavulanic acid increased by 6.8% per year in LMICs and decreased by 1.0% per year in HICs.
Conclusions As measured in standard units in sales data, the rate of increase in global antibiotic consumption may be slowing. However, the trends appear to differ between countries and drugs. In the absence of routine surveillance of antibiotic use in many countries, these data provide important indicators of trends in consumption which should be confirmed in national and local studies of prescribing.
- antibiotics
- paediatrics
- global surveillance
This is an open access article distributed in accordance with the Creative Commons Attribution Non Commercial (CC BY-NC 4.0) license, which permits others to distribute, remix, adapt, build upon this work non-commercially, and license their derivative works on different terms, provided the original work is properly cited, appropriate credit is given, any changes made indicated, and the use is non-commercial. See: http://creativecommons.org/licenses/by-nc/4.0/.
Statistics from Altmetric.com
Summary box
What is already known?
Antibiotic use has been increasing globally in recent years.
Several studies have shown that children are important users of antibiotics in many settings but childhood antibiotic consumption has not been quantified globally.
What are the new findings?
Based on global antibiotic sales data, consumption of antibiotics overall and in specific child-appropriate formulations remained relatively constant between 2011 and 2015 in both high-income and low/middle-income countries.
Trends in specific antibiotics differed, with an increase in the use of amoxicillin in combination with clavulanic acid in low/middle-income countries.
What do the new findings imply?
There appears to have been limited progress in reducing antibiotic prescribing in high-income countries and increasing access to antibiotics in low/middle-income countries.
Introduction
Improving and maintaining access to antibiotics presents unique challenges, with the need to ensure availability of appropriate treatment balanced against limiting inappropriate use and emergence of resistance. The WHO has recommended that countries implement surveillance of antimicrobial consumption,1 but this may be challenging, particularly in low-income and middle-income settings in which robust surveillance systems are generally not available.
In the absence of global surveillance data, information on international antibiotic sales can provide a proxy measure of consumption.2–4 Based on such data, global consumption of antibiotics, including last resort treatments such as polymyxins, increased between 2000 and 2010, particularly in low-income and middle-income countries.2 4 This increase appeared to continue into 2015, particularly, but not exclusively, in low-income and middle-income countries,3 where increasing consumption potentially reflects improvements in access rather than necessarily overuse.
One limitation of using sales data to estimate consumption is the lack of information on the individuals to whom the drugs were prescribed, including patient age. However, information on the antibiotic formulation may be available and could provide a proxy identifier of drugs dispensed to children, as some oral formulations are particularly suitable for children.5 Quantifying global paediatric antibiotic use is important as childhood exposure to antibiotics in many settings is high; for example, in New Zealand, 97% of children had received at least one course of antibiotics by the age of 5 years.6 Children in low-income settings are also commonly exposed to antibiotics, with an average consumption of 4.9 courses per child-year reported among children aged <2 years in eight low-income settings (Bangladesh, Brazil, India, Nepal, Pakistan, Peru, South Africa and Tanzania), although frequency and patterns of use varied substantially between sites.7 Paediatric antimicrobial stewardship programmes may therefore play a critical role in reducing the emergence of bacterial resistance. However, previous studies of antibiotic use have often either not focused on children8–16 or have used cross-sectional designs,17 often in hospitals.18–21 A few studies have reported on trends in paediatric antibiotic use, in individual countries or regions or a small number of countries,22–25 using data on health insurance claims,22 pharmacy databases,23 community surveys24 and electronic health records.25
In this paper, we aim to describe global trends in antibiotic consumption using wholesale data, stratified by country income level, overall and for specific ‘child-appropriate formulations’ (CAFs) as a proxy for consumption by children.
Methods
Data on antibiotic (Anatomic Therapeutic Chemical (ATC) code J01) sales during 2011–2015 were obtained from the IQVIA MIDAS database. The database contains annual figures summarising pharmacy sales of specific antibiotic drugs and combinations in 75 countries/regions (Guatemala, El Salvador, Honduras, Nicaragua, Costa Rica and Panama are aggregated as Central America, and Benin, Burkina Faso, Cameroon, Côte d'Ivoire, Democratic Republic of the Congo, Gabon, Guinea, Mali, Senegal and Togo as Francophone West Africa); online supplementary appendix table 1 summarises the sectors covered in each included country. Antibiotic consumption is expressed in standard units (SU), with 1SU defined by IQVIA as a single tablet, capsule or ampoule/vial or 5 mL oral suspension. Countries were classified based on income using World Bank categories.26 Low-income, lower middle and upper middle income countries were considered together as low/middle-income (LMICs). The remaining countries were classified as high income (HICs).
Supplemental material
The dataset does not include information on the recipients of prescriptions. To estimate antibiotic consumption by children, all recorded formulations were classified by two senior paediatric specialist pharmacists into those considered to be ‘child-appropriate’ formulations (CAFs, that is, formulations available as syrups/liquids or dispersible tablets/solids that become liquid on intake or swallowing) and others (online supplementary appendix). Analyses are presented overall (all formulations combined) and for the subset of formulations considered to be CAFs.
Antibiotics were also grouped into Access, Watch and Reserve (AWaRe) groups based on the classification used in the WHO’s 2017 revision of the Essential Medicines List for children (EMLc).27 Access antibiotics are first-choice or second-choice treatments for major clinical syndromes (eg, amoxicillin for pneumonia) and should be routinely accessible for appropriate use. Antibiotics in the Watch category are first-choice or second-choice treatments for specific indications but carry a higher risk of resistance emerging, while Reserve antibiotics are considered drugs of last resort. Antibiotics not represented in the EMLc were grouped as ‘Unclassified’; this group includes monotherapies not included on the list (eg, second generation cephalosporins) and combination treatments not included on the EMLc (irrespective of whether any of the constituents of the combination are on the EMLc). The nine antibiotics which appear in the Access group only for specific clinical conditions and are otherwise classified in the Watch group were considered as Watch.
Annual antibiotic consumption per capita was calculated overall and for CAFs, using UN estimates of the total and 0–4-year-old population for each country represented in IQVIA,28 assuming that CAFs are prescribed for children aged <5 years. We first described trends in consumption of antibiotics globally over the period 2011–2015, measured in SU and in SU/person (or per child). Changes in overall consumption were assessed globally and for individual countries as the percentage change in consumption per person (or per child aged <5 years), calculated as 100 × (SU per person in 2015 – SU per person in 2011)/SU per person in 2011). A positive percentage change therefore represents an increase in consumption. Similar to van Boeckel et al,4 we also calculated the compound annual growth rate (CAGR) in consumption per person and per child:

where N is the number of years of data available. For CAFs, calculation of the CAGR was analogous but used consumption per child aged 0–4 years in place of consumption per person. We repeated these analyses for Access and Watch antibiotics and separately for amoxicillin and amoxicillin with clavulanic acid.
Analyses were conducted using Stata V.15.
Ethics statement
All data were supplied aggregated at country level with no individual-level information. Therefore, ethical approval for this analysis was not required.
Patient and public involvement
There was no patient or public involvement in study design, analysis or reporting.
Results
Global consumption of antibiotics, 2011–2015
In total, 75 countries/regions contributed data to IQVIA for the period 2011–2015 (36 low/middle-income settings and 39 high-income settings). Overall, antibiotic consumption increased from 6.85×10¹⁰ SU in 2011 to 7.44×10¹⁰ SU in 2015, an increase of 8.6%. Consumption of CAFs increased by 7.3%, from 1.66×10¹⁰ SU to 1.78×10¹⁰ SU. These estimates correspond to CAGRs in consumption per person of 0.9% per year in overall consumption per person and 1.2% per year in consumption per child of CAFs. Combining LMICs and HICs, the four antibiotics with the highest reported sales of CAFs in 2015 were amoxicillin (4.21×10⁹ SU), amoxicillin with clavulanic acid (3.55×10⁹ SU), cefixime (1.86×10⁹ SU) and sulfamethoxazole with trimethoprim (0.88×10⁹ SU).
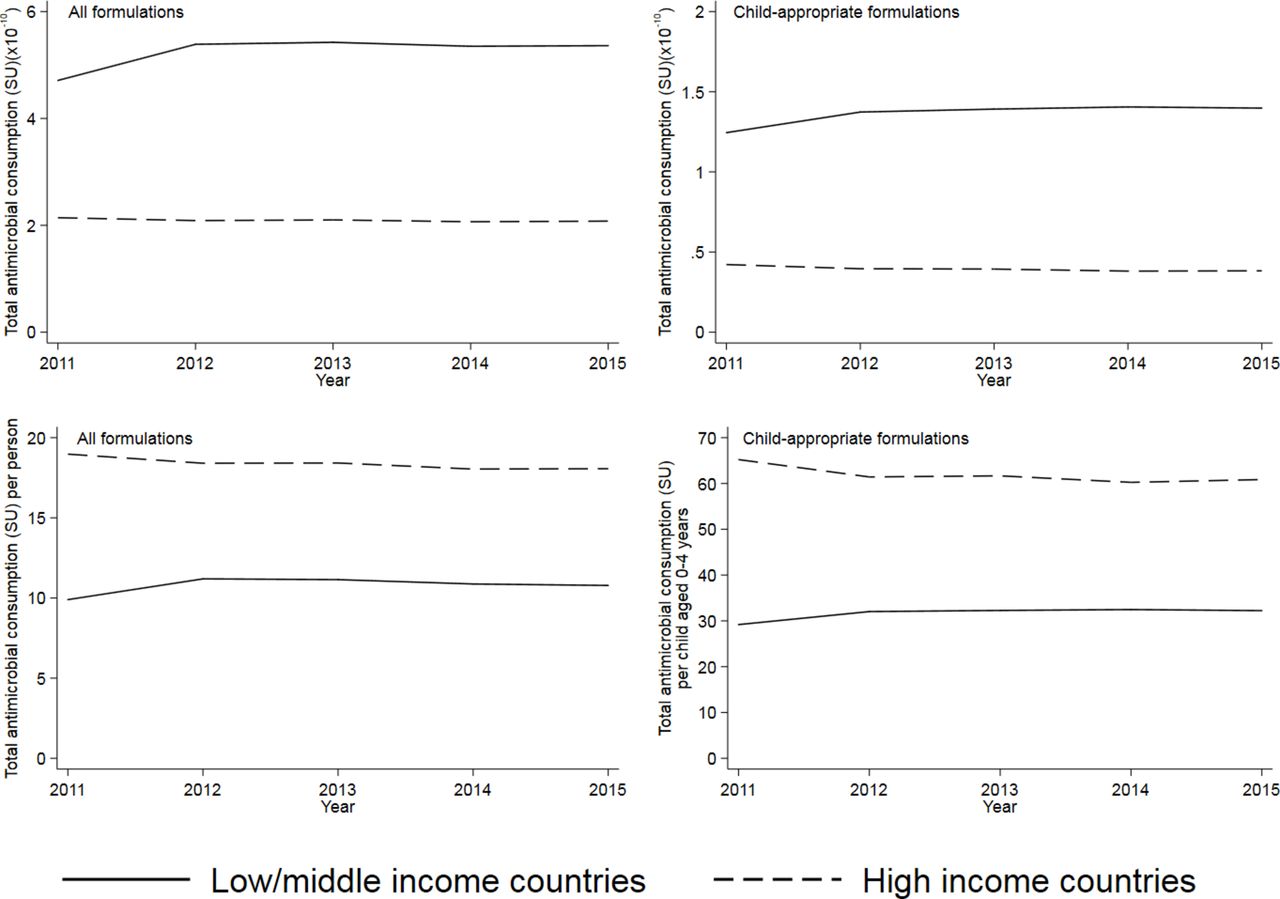
The volume of antibiotics consumed (measured in SU) was higher in LMICs than HICs, both overall and for CAFs (partially reflecting the higher population in LMICs); however, consumption per person was higher in HICs (figure 1). The increase in consumption seen in LMICs between 2011 and 2012 was mostly due to an increase reported from China. From 2012 to 2015, reported consumption of antibiotics changed relatively little in LMICs contributing to IQVIA (from 32.0 SU/child to 32.2 SU/child for CAFs and from 9.9 SU/person to 10.8 SU/person in total). For HICs, there were slight reductions in volume of consumption between 2011 and 2015: 6.7% in consumption/child of CAFs and 4.8% in consumption/person overall (figure 1). These estimates for HICs correspond to CAGRs of −1.4% per year for CAFs and −1.0% per year overall.

Global antibiotic consumption, all formulations and child-appropriate formulations in low/middle-income and high-income countries, 2011–2015. Consumption is measured in SU and in SU/person (all formulations) or SU/child aged 0–4 years (child-appropriate formulations). Source: IQVIA. Note the differing Y axis scales.
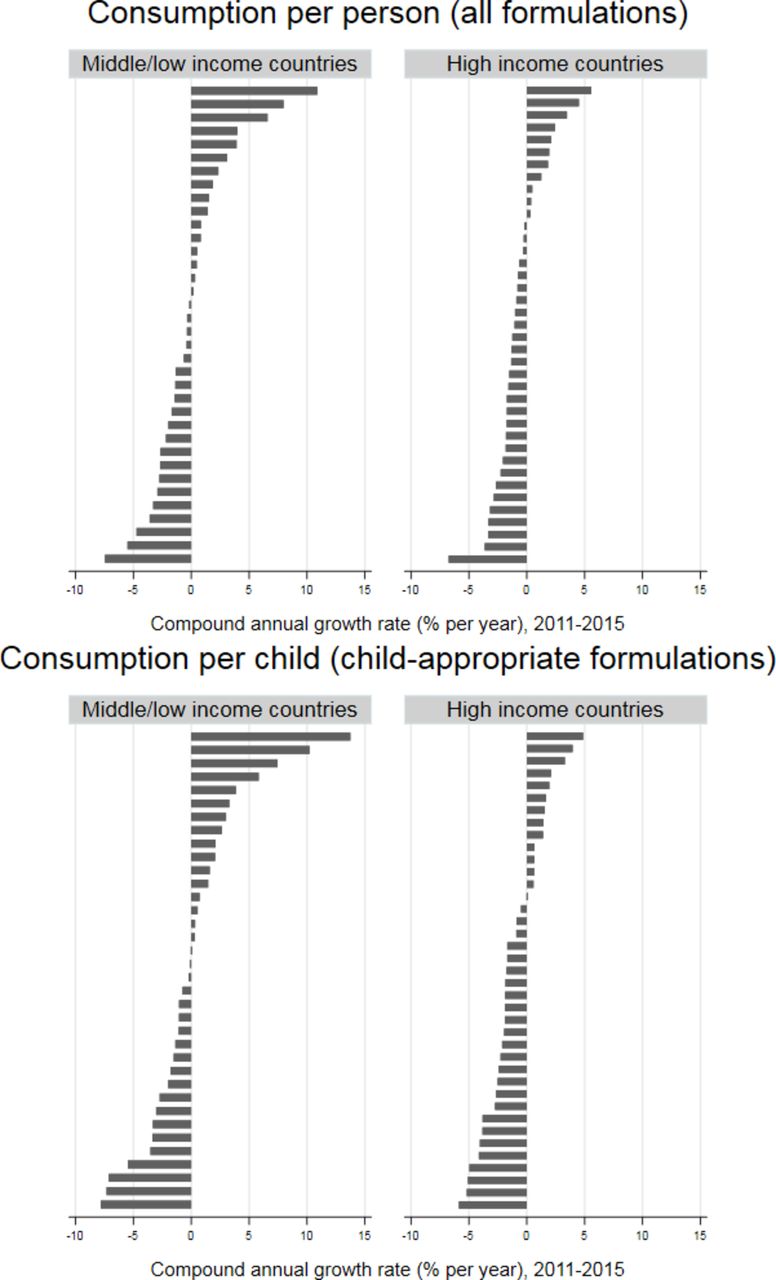
The patterns of change in consumption per person, as measured by the CAGR, differed markedly between countries in both LMICs and HICs, although the range of changes was greater in the former (figure 2). The median CAGR in CAF consumption per child was a reduction of 0.18% per year (IQR 2.4% decrease to 2.1% increase per year) in LMICs and a reduction of 1.8% per year (IQR 2.7% decrease to 0.7% increase per year) in HICs. For all formulations, the median CAGR in consumption per person was a 0.37% decrease per year (IQR 2.4% decrease to 1.5% increase per year) in LMICs and a 1.1% decrease per year (IQR 1.8% decrease to 0.4% increase per year) in HICs.

Compound annual growth rate in consumption per person (all formulations) and per child aged 0–4 years (child-appropriate formulations) of antibiotics, 2011–2015, for individual countries, by country income. Source: IQVIA.
Antibiotic use in relation to WHO stewardship categories
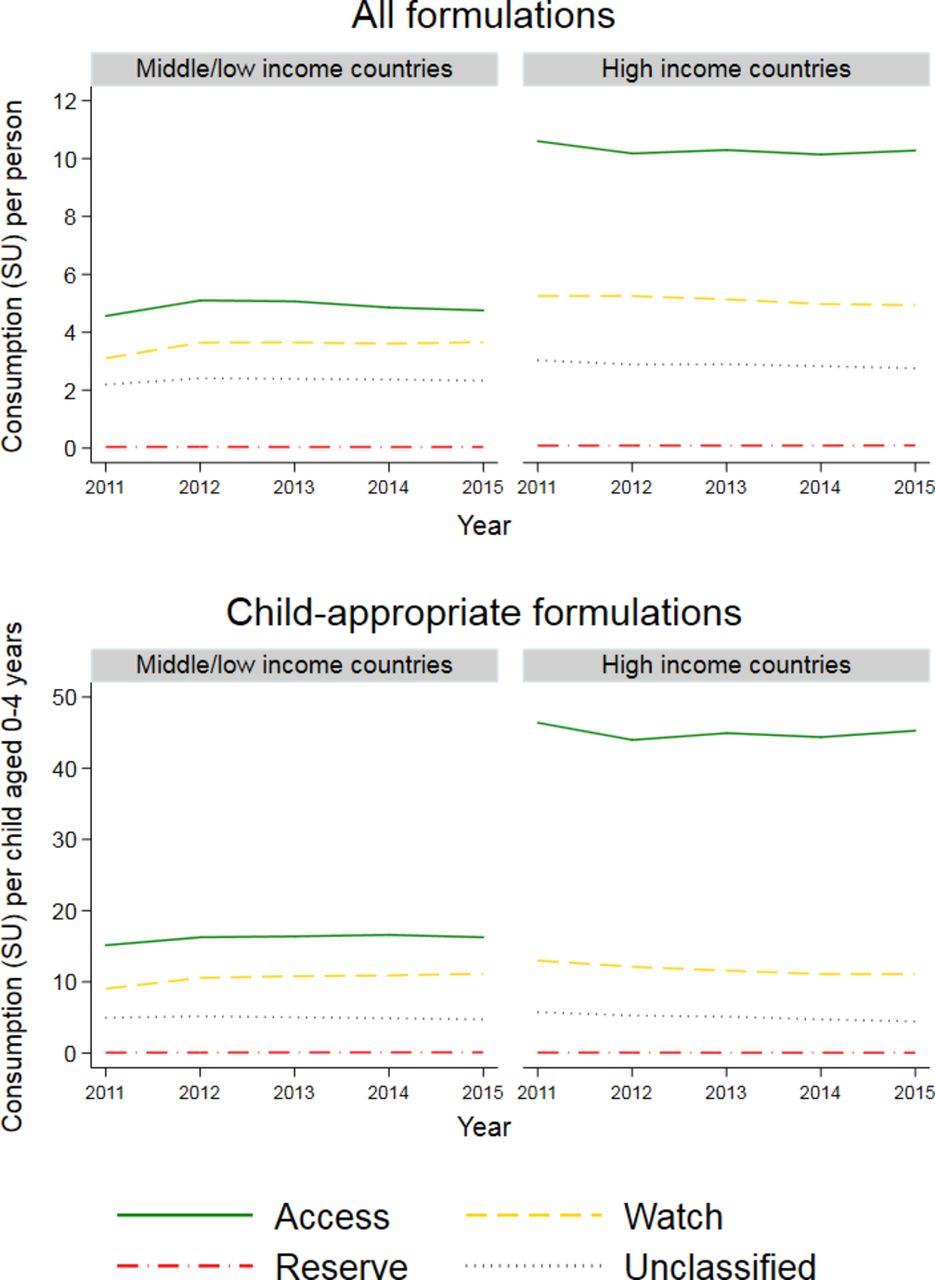
The highest levels of consumption per person and per child were reported for Access antibiotics overall and for CAFs (figure 3). For CAFs, consumption per child of Watch and Unclassified antibiotics was similar between LMICs and HICs, although Access use was considerably higher in the latter. Consumption of Reserve drugs was very low in both income settings.

Consumption per person (all formulations) and per child aged 0–4 years (child-appropriate formulations) of antibiotics in Access, Watch, Reserve and Unclassified categories, 2011–2015, in low/middle-income and high-income settings. Source: IQVIA.
There was little change in the consumption of Access and Watch drugs over time (table 1), with the largest magnitude CAGR being a median 2.8% per year decrease in consumption of Watch antibiotics in CAFs in HICs. Again, there were substantial variations between countries, particularly for Watch antibiotics for which increases in consumption were generally greater in LMICs compared to HICs (online supplementary appendix figure 1).
Compound annual growth rates in consumption of Access and Watch antibiotics, overall and in child-appropriate formulations, 2011–2015 (source: IQVIA)
Changes in use of amoxicillin and amoxicillin with clavulanic acid
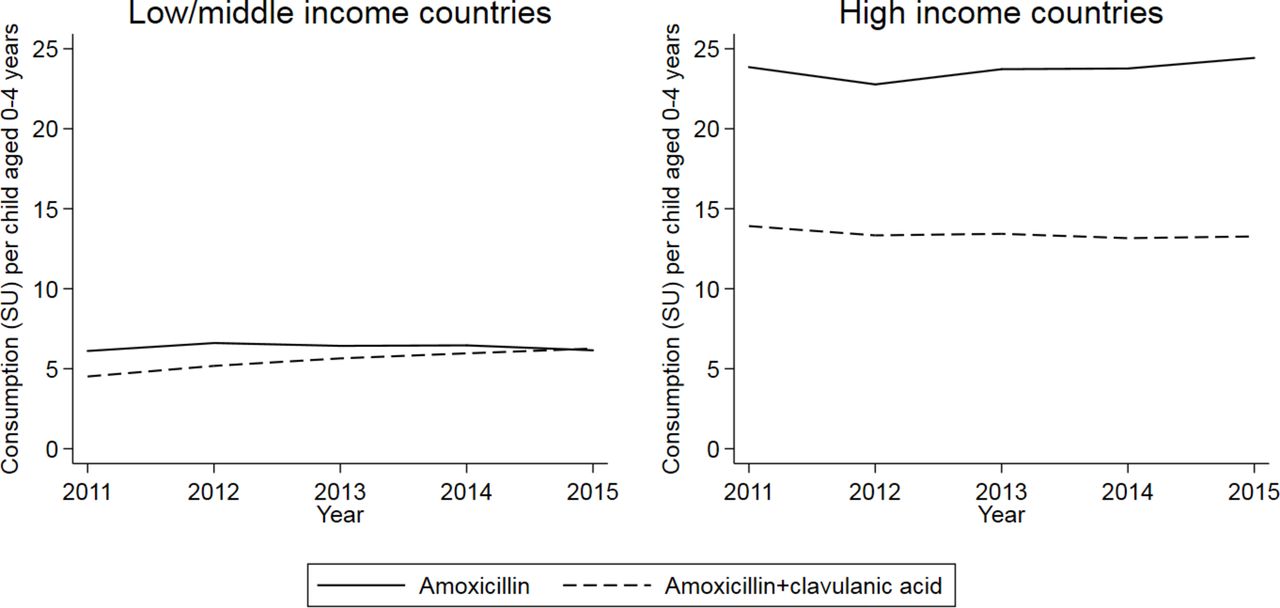
In HICs, consumption of CAFs of amoxicillin and amoxicillin with clavulanic acid changed relatively little over the period 2011–2015 (figure 4), with CAGRs of 0.5% per year and −1.0% per year, respectively. In LMICs, the CAGR for amoxicillin was again relatively small (0.14% per year). However, usage per child of CAFs of amoxicillin with clavulanic acid increased at a rate of 6.8% per year, with usage almost equalling that of CAFs of amoxicillin alone in 2015.

Consumption of amoxicillin and amoxicillin with clavulanic acid, per child aged 0–4 years, 2011–2015. Source: IQVIA.
Again, these global trends obscured marked variation at country level in both HICs and LMICs (online supplementary appendix figure 2). Increases in use were more likely in LMICs than HICs, particularly for amoxicillin with clavulanic acid.
Discussion
We present the first international analysis of temporal changes in antibiotic consumption according to formulation type. Global antibiotic consumption (both overall and of CAFs), as measured in standard units by IQVIA sales data, changed relatively little between 2011 and 2015. However, there were marked differences between countries in trends over time, with some countries showing substantial increases in antibiotic use, and trends differed by antibiotic. Global use of last-resort (Reserve) drugs was low. Consumption per child of antibiotics in CAFs was higher than consumption per capita overall, consistent with the expected high consumption among young children.18 29
The IQVIA dataset is unique in providing extensive, long-term information from a large number of countries, and the reported data are internally validated against alternative sources of sales data.30 However, there are several limitations in using this dataset to estimate trends in antibiotic consumption. The data are not intended to necessarily reflect countries’ full national sales, but only the sectors or distribution channels from which data are collected. For example, in LMICs, no hospital data are collected in 17 countries, and in some of these only the purchases made from commercial wholesalers are included (see online supplementary appendix table 1 for further information). Coverage in LMICs also refers mainly to community antibiotic use whereas HICs also include hospital data. Consequently, it is difficult to define the population covered in each country; we used national population denominators but these may overestimate the population covered, particularly in LMICs, leading us to underestimate antibiotic sales per person (and per child). Variations in representativeness and coverage between countries and over time make it difficult to assess the comparability of data between individual countries; for this reason, we have not presented data for named countries but instead highlight apparent variation.
Furthermore, many low-income countries, where the infection burden and therefore need for antibiotics are greatest (and where access to, and rational prescribing of, antibiotics may be particularly difficult),31 are not represented in the dataset (only seven low-income countries, all within the aggregated region of Francophone West Africa, contributed to IQVIA over the study period). Finally, sales data do not necessarily reflect consumption; the extent to which they do may vary between settings (eg, due to differences in healthcare systems and the volume of imports and exports). Despite these important biases, the overall direction of which is difficult to ascertain, the dataset provides a useful indication of global trends in antibiotic use. Thus, while there is potential for error in our quantitative estimates, our key conclusions are likely to be valid and highlight the need for countries to examine local consumption data in the context of their national epidemiology, resistance patterns and data collection systems.
Understanding to whom antibiotics are prescribed can assist with planning stewardship activities. Unfortunately, sales data do not easily lend themselves to analysis of consumption by specific groups, for example, by age. We therefore used the type of formulation as a proxy for age, assuming that the defined CAFs would be prescribed to children aged <5 years (and using corresponding population denominators). The classification of CAFs was developed by two senior paediatric research pharmacists but is somewhat subjective. CAFs may be used by older children and by adults, particularly those with swallowing difficulties due to advanced age or comorbidities. Consequently, we may have overestimated antibiotic consumption by young children, particularly in HICs where elderly individuals and those with comorbidities comprise a larger percentage of the population. The extent of this error might increase over time, although over the relatively short study period any such change is likely to be minor. These factors could disguise any true reduction in childhood antibiotic consumption over time. Despite this, we saw a slight reduction in consumption of CAFs in HICs and little change in LMICs. Conversely, formulations which could be given to both adults and children (eg, intravenous) were not considered child-appropriate, which would underestimate total antibiotic consumption by children. For example, cefazolin and amikacin (which appear on the EMLc as powder and solution for injection, respectively and are classified as Access drugs)27 are not available as CAFs; and solid formulations of drugs other than antibiotics may be used by young children when paediatric formulations are not available.32 In addition, off-label use of formulations not approved for use in children would not be accounted for in our analysis of CAFs. Our defined CAFs are likely to be mainly consumed in the community, where the majority of antibiotic use occurs;33 these data must therefore be considered alongside hospital data to obtain a fuller picture of antibiotic consumption.
Apparent changes in antibiotic consumption may be (at least partially) artefacts of changes in reporting practices or drug availability. Any real increases in consumption of antibiotics may reflect improved access to appropriate treatments or increasing inappropriate use. We cannot distinguish between these factors, as the data did not include information on indications for prescriptions or microbiological data. Furthermore, an increase in consumption of antibiotics in CAFs may represent a shift to using these formulations in preference to others. Without patient-level data on clinical indication and causative organism (including antibiotic resistance profiles), we cannot assess the appropriateness of prescribing. Assessing the suitability of CAFs is also beyond the scope of this paper (eg, parents may have difficulty reconstituting powders,34 and liquid formulations may require refrigeration35).
Existing data on trends in antibiotic consumption at a global level, especially in the community, are fairly limited. Considering all age groups, a previous analysis of IQVIA data 2000–2010 reported a dramatic increase in consumption globally, particularly in the BRICS countries (Brazil, Russia, India, China and South Africa), but trends varied between countries. A recent analysis reported that this increase continued up to 2015, with consumption measured in defined daily doses (DDDs) and that patterns of change varied by country and antibiotic.3 This contrasts with the plateau in consumption measured in SUs which we report. This is most likely accounted for by the different units used. We opted not to convert SUs (as available in the dataset) to DDDs, as DDDs do not account for the age-based or weight-based dosing used in treating children of different ages and sizes. DDDs could also be influenced by changes in dosage. However, the differences which we highlight between high-income and lower-income countries are consistent with the previous analysis,3 and we add information on the AWaRe categories and two specific highly used drugs, amoxicillin and amoxicillin with clavulanic acid. Our results are also consistent with broader literature showing different trends in antibiotic consumption, measured from a variety of data sources, over time in different settings. For example, electronic primary care data from five European countries showed no evidence of a trend in the prevalence of antibiotic prescribing between 2004 and 2009,16 whereas numbers of antibiotic prescriptions and sales increased by 25% and 57%, respectively, between 2008 and 2011 in Namibia.36
Data on trends in antibiotic use by children are also limited but again suggest variation according to both country and antibiotic.22–25 Our analyses provide results from a single dataset for 75 countries/regions, aiding understanding of overall patterns of antibiotic usage to complement previous national and regional analyses and highlighting differences between high-income and low/middle-income settings, in overall trends and in use of specific antibiotics. Ecological studies such as these provide valuable indications of potential areas for improvements in antibiotic prescribing, but longitudinal, individual-level cohort studies are also needed to give insight into individual-level patterns, determinants and indications for antibiotic use.6 7
While preferences for different types of antibiotics vary between settings,16 37–39 amoxicillin, with or without clavulanic acid, is frequently reported to be one of the most commonly used, particularly in community prescribing.6 36–38 40 41 Although recommended as a first-choice treatment only for specific indications,27 CAFs of amoxicillin with clavulanic acid were sold in volumes similar to those of amoxicillin alone in LMICs. The reasons for this increase, which was not driven by any particular country, are unclear, but could relate to real or perceived increases in resistance to amoxicillin or increases in dosage or duration of treatment. The increase in sales of amoxicillin with clavulanic acid may mean that children receive more expensive treatment (depending on the precise formulation),42 with little additional clinical benefit.
Antibiotics which appear on the EMLc are categorised into the Access, Watch and Reserve groups to assist with stewardship.27 However, antibiotics not on the EMLc (the ‘Unclassified’ category) account for a substantial percentage of antibiotic consumption in the IQVIA dataset. This is a heterogeneous group of drugs and combinations. Some of these are widely used treatments which are generally considered safe and effective and may be appropriate treatments, but do not meet the current criteria for being on the EMLc, for example, second generation cephalosporins and several narrow-spectrum or beta-lactamase resistant penicillins. Others are variations on combinations which appear on the EMLc, for example, amoxicillin with beta lactamase inhibitors other than clavulanic acid. Still others are drug combinations, some, all or none of the constituents of which may be on the EMLc. We have not analysed the composition of these combinations. Previous analysis has found a high proportion of Watch and Reserve consumption in India to be accounted for by fixed dose combinations (FDCs).43 Based on IQVIA data from eight Latin American countries (1999–2009), 70% of FDCs were considered to lack evidence in support of combined use and a further 21% were considered potentially unsafe, with 20% of consumption in 2009 being FDCs.44 These studies highlight the need to analyse these combinations in detail and to consider their implications for stewardship programmes.
Conclusion
Global antibiotic consumption, as measured in standard units and recorded in IQVIA sales data, changed relatively little between 2011 and 2015. However, the direction and magnitude of change differed between countries and drugs, for both total consumption and consumption of CAFs, although these comparisons are subject to several caveats. The relative importance of improvements in access to appropriate treatments versus changes in inappropriate usage remains to be determined.
Acknowledgments
We are grateful to Stephen Tomlin for assistance with classifying the child-appropriate formulations.
References
Footnotes
Handling editor Alberto L Garcia-Basteiro
Contributors CJ analysed the data with input from YH, JAB, SE and MS and drafted the paper. PS and ICKW obtained the data. All authors contributed to the interpretation of the results and critically revised the manuscript. The corresponding author attests that all listed authors meet authorship criteria and that no others meeting the criteria have been omitted.
Funding This study was funded by the Netherlands Ministry of Health, Welfare and Sport.
Disclaimer The funder had no role in the study design, analysis and interpretation of data, the writing of the report or the decision to submit the article for publication.
Competing interests PS is employed by IQVIA, which is funded by both industry and governments to collect, process and analyse information on medicine usage. All other authors report no conflicts of interest.
Patient consent for publication Not required.
Provenance and peer review Not commissioned; externally peer reviewed.
Data sharing statement No additional data are available.