Article Text

Abstract
Introduction Cambodia is among the 30 highest burden of tuberculosis (TB) countries. Active TB prevalence has been estimated using nationally representative multistage sampling that represents urban, rural and remote parts of the country, but the prevalence in non-sampled communes remains unknown. This study uses geospatial Bayesian statistics to estimate point prevalence across Cambodia, and demographic modelling that accounts for secular trends in fertility, mortality, urbanisation and prevalence rates to project the future burden of active TB.
Methods A Bayesian hierarchical model was developed for the 2011 National Tuberculosis Prevalence survey to estimate the differential effect of age, sex and geographic stratum on active TB prevalence; these estimates were then married with high-resolution geographic information system layers to project prevalence across Cambodia. Future TB projections under alternative scenarios were then derived by interfacing these estimates with an individual-based demographic model.
Results Strong differences in risk by age and sex, together with geographically varying population structures, yielded the first estimated prevalence map at a 1 km scale. The projected number of active TB cases within the catchment area of each existing government healthcare facility was derived, together with projections to the year 2030 under three scenarios: no future improvement, c ontinual r eduction and GDP projection.
Conclusion Synthesis of health and geographic data allows likely disease rates to be mapped at a high resolution to facilitate resource planning, while demographic modelling allows scenarios to be projected, demonstrating the need for the acceleration of control efforts to achieve a substantive impact on the future burden of TB in Cambodia.
- tuberculosis
- mathematical modelling
- geographic information systems
This is an open access article distributed in accordance with the Creative Commons Attribution Non Commercial (CC BY-NC 4.0) license, which permits others to distribute, remix, adapt, build upon this work non-commercially, and license their derivative works on different terms, provided the original work is properly cited, appropriate credit is given, any changes made indicated, and the use is non-commercial. See: http://creativecommons.org/licenses/by-nc/4.0
Statistics from Altmetric.com
Key questions
What is already known?
Nationally representative surveys were conducted in Cambodia in 2002 and 2011 to derive national but not subnational estimates of the point prevalence of active tuberculosis (TB).
What are the new findings?
This paper therefore provides the first subnational estimates of the point prevalence of active TB across Cambodia and the first projections of future point prevalence in Cambodia.
What do the new findings imply?
These projections provide evidence that may allow healthcare resources to be deployed more efficiently across Cambodia over the next decade.
However, a key uncertainty remains, namely the degree to which the reduction in age-specific point prevalence rates observed between the 2002 and 2011 surveys can be maintained.
Continued support for the national TB control programme is therefore required.
Introduction
Tuberculosis (TB) is a leading infectious cause of morbidity and mortality worldwide, accounting for 10.4 million new cases and 1.3 million deaths in 2016.1 The disease burden is disproportionately concentrated in low-income and middle-income countries, with over 95% of TB deaths occurring in these regions.2 3 In 2016, the number of new TB cases was estimated at 10.4 million and nearly 40% remained undiagnosed.4 Limited access to healthcare, high treatment cost and the social stigma of TB contribute to delayed detection and suboptimal treatment uptake.5 6 Poor living conditions and overcrowding further perpetuate the transmission of TB, which, in turn, leads to social and economic insecurity.7 The financial burden of TB—due to the loss of income, and the logistics and costs of medical care—is high, with typical costs amounting to 58% and 39% of individual and household annual income, respectively, in low-income and middle-income countries.8 In Cambodia, one of the countries with the world’s highest burden of TB, although TB services and treatment are provided free in public healthcare facilities, other financial costs may amount to over 10% of average household income per case.9
Cambodia has an active TB prevalence of 817 (95% CI 690 to 954) per 100 000 population, estimated during the 2011 National Tuberculosis Prevalence (NTP) survey of individuals aged 15 years or older conducted by the National Center for Tuberculosis and Leprosy Control (known by its French acronym, CENAT).10 This estimate was based on a multistage sampling design that ensured urban, rural and remote areas were represented; however, for efficiency, only a fraction of communes within each stratum was randomly sampled, so while the national prevalence can be estimated, the subnational prevalence in other, non-sampled communes remains unknown. The Global Tuberculosis Report 20171 highlights the possible discrepancies in reporting, access to healthcare, and differences in TB diagnosis and treatment, masking the magnitude of the problem faced by individual provinces across Cambodia. Active case finding—recognised as an important step to early diagnosis and treatment11—has been found to be feasible and cost-effective in Cambodia,12–14 but would benefit from reliable estimates of the prevalence of active cases across heterogeneous communities, to ensure resources are apportioned efficiently and to facilitate effective planning and evaluation of interventions.
To this end, we performed Bayesian evidence synthesis to fuse epidemiological and spatial data to identify plausible high burden areas (in terms of point prevalence of active TB, ie, the proportion of the population who at an instant of time have active TB, and number of active TB cases) at a fine spatial resolution (1 km2) across Cambodia. We then projected the future spatial prevalence of active TB across Cambodia under alternative future scenarios. This was made possible with the amalgamation of several data sources and methods: imputation of the population spatial structure over time, demographic modelling of the future population and modelling of risk factors associated with active TB in a Bayesian hierarchical framework. The modelling provides estimates of likely disease burden in the absence of increased funding for control programmes and continued reduction in TB prevalence seen in the NTP surveys of 2002 to 2011.15
Methods
Overview of the methodology
The overall approach is to use data fusion to synthesise various data sources—the 2011 NTP survey, projected population density plots, birth and death rates, and the age profile across Cambodia—to project TB prevalence across Cambodia over time. Figure 1 gives an overview of the data sources and the major steps of the modelling framework described in the sections that follow. The modelling framework begins with a Bayesian hierarchical model (TB-NTP model) that was developed for the 2011 NTP survey. This model estimates age, sex and stratum (urban/rural: for comparison with the previous NTP survey in 2002, remote areas were classified as rural) effects on the TB prevalence in Cambodia, accounting for cluster-level random effects. The ensuing subsections detail the methodology adopted to construct a Demographic Epidemiological Model of Cambodia (DEMOKH), an individual-level model that represents the population of Cambodia over space and time, which was used to forecast the prevalence of active TB to the year 2030. Some additional details of the methodology are provided in the online supplementary material 1.
Supplemental material

Methodology and data. Overview of the data sources and model framework in the manuscript is presented in this flow chart. National Tuberculosis Prevalence Surveys (NTP) for 2011 were made available by the National Center for Tuberculosis and Leprosy Control (CENAT) in Cambodia. A summary of the methodology is represented by the model framework: (A) TB-NTP model, and (B) demographic epidemiological model of Cambodia (DEMOKH). The projections to the year 2030 were modelled under three scenarios: no future improvement (should the prevalence rate be maintained at the 2011 rates), continual reduction (should the prevalence rate decline at the same rate from 2002 to 2011 and gross domestic product ( GDP) projections (should the fall in the prevalence rate mirror the projected rises in GDP) as represented in the bottom panel. TB, tuberculosis.
Active tuberculosis point prevalence model (TB-NTP model)
In the second NTP survey conducted in December 2010 to September 2011 by CENAT,10 62 survey sites (or spatial clusters) were randomly selected across Cambodia with population proportionate multistage cluster sampling. Of the 40 423 eligible participants (age >15 and resident at the survey site for at least 2 weeks), 37 417 (92.6%) were recruited.
The TB status of survey participants was recorded in the NTP survey as a binary variable indicating if the participant had bacteriologically positive pulmonary TB or not. Hierarchical logistic regression was conducted that accounted for features at the individual level (ie, age, sex and rural/urban stratum classification) and cluster level, to explain heterogeneity within clusters.
Let  be the probability of active TB infection of an individual
i
, where
be the probability of active TB infection of an individual
i
, where  if
i
has active TB and 0 otherwise. We model active TB point prevalence as
if
i
has active TB and 0 otherwise. We model active TB point prevalence as  where
where

Here,  is a vector of individual-level risk factors of active TB infection—including age (in categories or continuous, details as follows), sex and urbanisation level, while
  is a spatial random effect shared by all individuals in the commune
  to which
i
belongs.
to which
i
belongs.
The model adopted a Bayesian framework16 17 to address uncertainty by borrowing strength from other clusters in the data. Weakly informative priors were assumed for all parameters, namely:  for each component
k
in the individual risk factors vector,
for each component
k
in the individual risk factors vector,  for commune
c
and
for commune
c
and  Because very few sampled communes border each other, there was insufficient information to fit a model with spatial correlations in the random effects, which were therefore modelled to be conditionally independent of each other. The model is fully specified in online supplementary material 1.
The posterior distribution of the parameters was estimated via Markov chain Monte Carlo simulation16 17 and the inference was implemented in the Just Another Gibbs Sampler (JAGS) language18 using the rjags package in R.19 In total, two chains with 50 000 iterations each were performed and the convergence of the Markov chain Monte Carlo samplers was assessed by the Heidelberger-Welch and Geweke diagnostics20 21 and inspection of the trace plots.
Demographic epidemiological model of Cambodia (DEMOKH)
Spatial projections
Gaughan and colleagues22 developed high-resolution estimates of the geography of the population using the United Nations adjusted population distribution of Cambodia over the years 2010, 2015 and 2020, which were extracted from the WorldPop Project.23 Data were downloaded as raster files and processed in QGIS,24 ArcMap25 and R19 to be partitioned into 1 km grid squares.
To project the prevalence of active TB across Cambodia at the time of the 2011 NTP, a pseudo-population of individuals was first assigned into each grid randomly based on age, sex and strata level of the pseudo-individuals using the Gaughan population distribution data, and with a Monte Carlo sample of the parameters from the posterior distribution of the TB hierarchical model; the individual’s risk of active TB was computed. This procedure was repeated 100 times and the mean prevalence and total number of individuals with active TB was calculated and spatially visualised.
Temporal projections
The projections of possible future active TB prevalence resulted from a three-stage procedure: in stage 1, we imputed the current spatial structure of the population, as previously described; in stage 2, we ran a demographic model on top of the spatial structure, ageing the existing population, depleting it by deaths and replenishing it with births; and in stage 3, we applied existing or reduced age-specific point prevalence rates, stratified by sex and urban/rural strata, to the projected future spatial structure. The three scenarios for changing point prevalence are described later in this section.
For the demographic model, 5-year age-specific fertility rates for the country as a whole over the period 2000 to 2005 were used as a baseline, obtained from the United Nations Statistics Division.26 These were then adjusted for each region of the country and both strata (rural and urban) within each province, by scaling to match the number of (living) children under 1 year old in the year 2008.27 This fertility rate was then held fixed in the model to the year 2030. We observed in initial modelling that fertility rates varied across provinces and rural/urban strata, due to the mismatch between predicted and actual numbers of infants. We therefore adjusted fertility rates at the province/stratum level, as follows.
The overall sex ratio at birth was estimated via the number of male to female infants aged <1 in 2008 and held fixed thereafter, that is, at 105 males to 100 females. We denote  to be the proportion of births that are male.
Letting  be the national fertility rate for women aged
a
, and
be the national fertility rate for women aged
a
, and  be the number of women aged
a
in province
p
, urban/rural stratum
u
in year
t
, we derived the expected number of births in each province, stratum and year to be
be the number of women aged
a
in province
p
, urban/rural stratum
u
in year
t
, we derived the expected number of births in each province, stratum and year to be

The number of children surviving to age 1 was derived by separately calculating the expected number of male births

and female births

These were then aged a year, by which time there were  boys and
  girls, and thus
  children altogether. The ratio of this modelled to the actual number of 1-year-olds,
  , in the year
  , that is,

was then set as the ‘correction factor’ for province p , stratum u , which was used to derive the fertility rate there for the projections, that is, the fertility rate for province p , stratum u , age a , was set to be

Annual, sex-specific, 5-year mortality rates were available for the 16-year period from 2000 to 2015 from the Global Health Observatory data repository of WHO,28 with those aged 85 or more grouped together, and those aged <1 separated from the under 5 age group. These were also available for the country as a whole. The log-mortality rates within age groups were extrapolated linearly from this period to the year 2030, that is,

where  is the annual mortality rate for individuals aged
a
in year
t
. The mortality rate was assumed constant over 5-year intervals of age (with those aged <1 having their own mortality group, and those aged >85 aggregated in one age group). The model was fit using least-squares regression to data from the period 2000–2015 and extrapolated beyond this. Separate models were fit for men and women, but the lack of data on differential mortality by rural and urban strata prohibited incorporation of any such effect.
is the annual mortality rate for individuals aged
a
in year
t
. The mortality rate was assumed constant over 5-year intervals of age (with those aged <1 having their own mortality group, and those aged >85 aggregated in one age group). The model was fit using least-squares regression to data from the period 2000–2015 and extrapolated beyond this. Separate models were fit for men and women, but the lack of data on differential mortality by rural and urban strata prohibited incorporation of any such effect.
The estimated and projected proportions of the population in both rural/urban strata in each province for the years 2010, 2015 and 2020 were extracted from the WorldPop Project.22 23 The approximately linear change over this time frame was extended to the time window 2008 to 2030.
Using a yearly time step from 2008 to 2030, we redistributed the population within each region between the rural and urban strata to match the estimated proportions (details in online supplementary material 1). We then calculated for each region and both strata the projected number of births (assigned in a fixed male:female ratio of 511:489 based on the number of living children <1 year in 200827) and the number of deaths in each year of age. Because we could not obtain migration rates between the regions of Cambodia, we froze individuals’ province as per the 2008 census data27 and assigned children to their mother’s province and stratum.
TB point prevalence was then imputed up to 2030 under three scenarios. In the reduced prevalence scenario, the reduction in age-specific point prevalence between the 2002 and 2011 nationally representative surveys was extrapolated to 2030; in the no future improvement scenario, the 2011 estimates were used for 2030. Together, these may constitute lower and upper plausible bounds for future prevalence of active TB. A moderate prevalence reduction model was also considered where gross domestic product (GDP) per capita projections for Cambodia29 as a proxy for overall development was used to inform the rate of improvement in the prevalence of active TB in Cambodia. The three models considered were, then:
No future improvement scenario: for this, we used the posterior mean age, sex, region and stratum-specific prevalence estimated from the 2011 prevalence survey and applied it to the population from 2010 to 2030.
Continual reduction scenario: we assumed the reduction in TB point prevalence for each age group was linear (in the log scale) corresponding to the decline observed over the 9 years between the NTP surveys of 2002 to 2011.15 This was then extrapolated to 2030 for each age group. To accommodate uncertainty, we resampled from the distribution of the age-specific TB rate reductions and compounded it yearly to the projected active TB point prevalence for years after 2011. Given that the age-specific 9-year OR for the reduction seen in the 2002 and 2011 NTPs is  for age group
a
, we assumed the 1 year reduction to be
for age group
a
, we assumed the 1 year reduction to be  where
where

For each simulation, we sample the 1-year age-specific reduction from the distribution as follows:

GDP projection scenario: in this model, we assume the age-specific TB reduction to be exponentially related to per capita GDP growth. Let  be the per capita GDP relative to 2002 and
  be that relative to 2011. Let also
  be the reduction in age-specific TB point prevalence for age
a
and year
t
, relative to 2002 (which has previously been estimated for
be the reduction in age-specific TB point prevalence for age
a
and year
t
, relative to 2002 (which has previously been estimated for  15), and
  be that relative to 2011. We assume
  . The parameter
  is equated to
  , which is resampled similarly to the continual reduction model. Projections are then made by extrapolating this from the 2011 rates.
Access to TB healthcare services
The Cambodia healthcare system has an established network of public and private providers, but while the private healthcare sector provides 61% of healthcare services,30 TB care—including control, prevention and treatment—is predominantly provided by the government sector. Led by CENAT, the national TB control programme was set up to control and treat TB, including the introduction and countrywide expansion of directly observed therapy short-course (commonly known as DOTS) since 1994.31 32 Geographical data of government healthcare facility—referral hospitals, health posts and health centres—were extracted from United Nations Office for the Coordination of Humanitarian Affairs33 34 and coalesced with the spatial distribution of the active TB cases to project the number of cases visiting or in the catchment of each healthcare facility.
Results
The prevalence of bacteriologically positive TB (or active TB) in the 2011 NTP survey varied across age and sex of the individual, and stratum level of his/her living environment (figure 2). An exposure–response relationship was observed between older age and active TB that was approximately exponential. Active TB was also markedly more prevalent in men (OR 2.08, 95% CI 1.66 to 2.62) when compared with women. However, after adjusting for age, sex and spatial random effects, the evidence for differences in urban and rural areas was marginal, with slightly higher empirical rates in rural (OR 1.29, 95% CI 0.83 to 2.01) and remote regions (OR 1.94, 95% CI 0.73 to 5.20) than urban areas. As a result, heterogeneities in the prevalence across the country may be driven mostly by the heterogeneous age and sex profiles in different provinces.

Differences in prevalence of bacteriologically positive tuberculosis (TB) across exposures. Modelled bacteriologically positive TB prevalence per 100 000 population estimates are represented in the log base 10 scale and are based on individual-level data from the 2011 NTP survey. The prevalence of active TB varies across age and sex of the individual, and stratum level of his/her living environment. The interpretation of violin plots is like box plots: they display the probability density of the prevalence estimates at different values. Points are posterior median prevalence estimates, curves are posterior distributions of the parameters truncated to within 95% CI.
The 2008 census population (figure 3) forms the basis of DEMOKH. Phnom Penh, the capital, was more urbanised than the country as a whole and the urban populations were mostly of working ages, while more rural provinces have relatively more children. Modelled fertility rates were higher in rural than urban areas, affecting the projected age profiles of the future population across the country. As the population of Cambodia ages forward in time, DEMOKH projects the population to be older and more urbanised (refer to online supplementary material 1); the latter may act to restrain the future TB prevalence, while the former elevates it.

Population age distribution by province and urbanisation category. The population pyramids by age and sex of the 24 provinces of Cambodia in 2008 is classified by urbanisation extent (urban, the darker area; or rural, the lighter area).
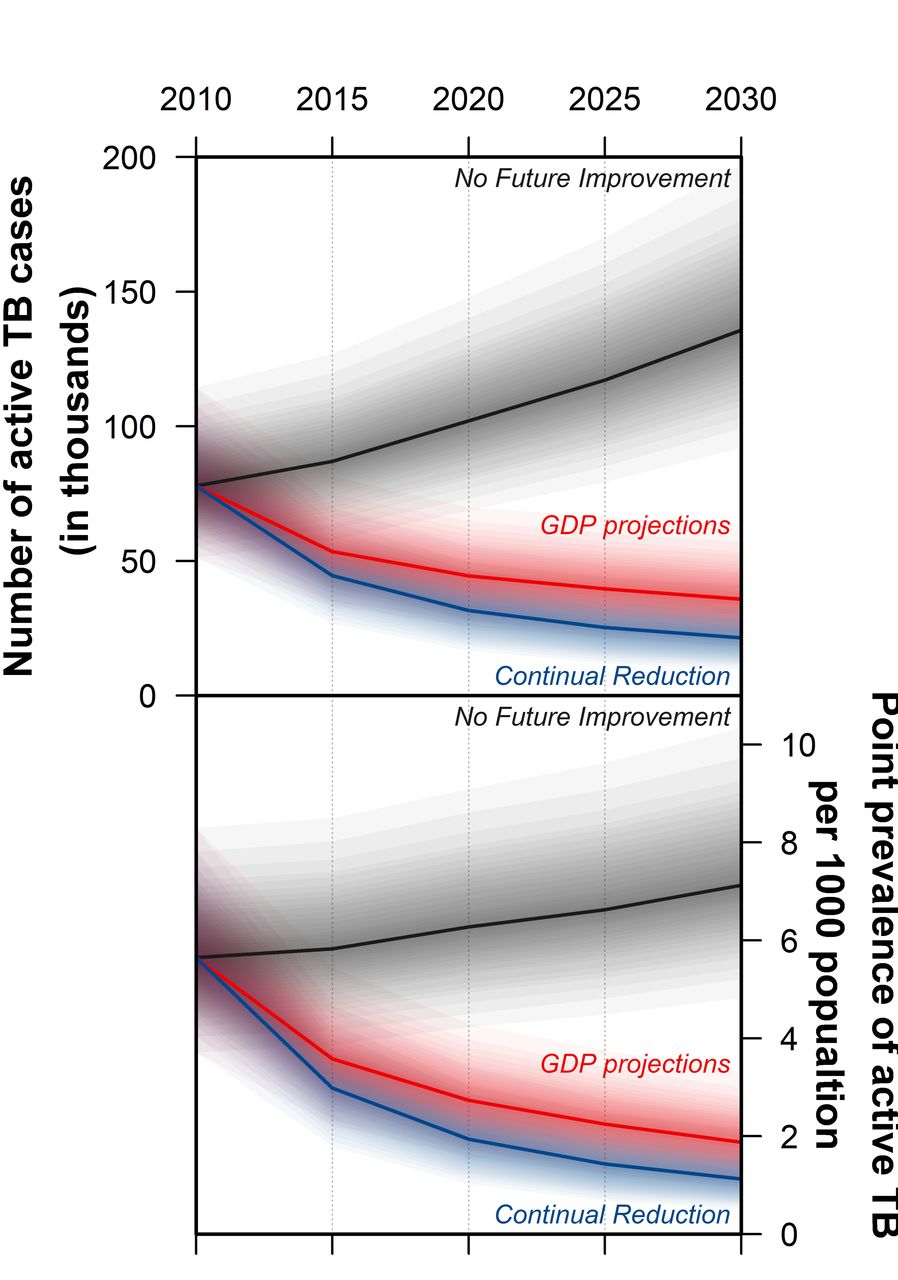
The prevalence of active TB varies spatially across the country and over time as depicted in figure 4. Generally, urban and younger regions had lower projected active TB prevalence. However, under the assumption that recent improvements to life expectancy continue into the immediate future, the population is projected to age noticeably, and as a result, should the age-specific and sex-specific rates remain at the level they were in 2011 (the no future improvement scenario), we project a higher active TB prevalence with more cases in all regions. In contrast, if the historic declines in TB prevalence observed between the 2002 and 2011 NTP surveys were to extend to 2030 (the continual reduction model), the rise in risk due to ageing would be more than countered by the reduction in prevalence due to sustained improvement in TB control. Together, these two scenarios, no future improvement and continual reduction, may constitute upper and lower plausible bounds for future prevalence of active TB. The intermediate third scenario, GDP projections, provides a more moderate outlook for active TB in the future as mirror projected rises in per capita GDP in Cambodia. In figure 5, the projected national prevalence and total cases for the three scenarios are presented to 2030, illustrating the stark differences in disease outcomes that would result from continuing the improvements observed between 2002 and 2011 and rapid development projected for Cambodia.

Projected point prevalence and cases of active tuberculosis (TB) across Cambodia, 2010–2030. Darker regions indicate higher prevalence of active TB. Three scenarios were modelled—(1) no future improvement: future TB prevalence is projected based on the estimates of age specific point prevalence in 2011 assuming no further improvement to the TB control programme; (2) continual reduction: the reduction in age-specific point prevalence between the 2002 and 2011 NTP surveys was extrapolated to 2030; and (3) gross domestic product ( GDP) projections: the reduction in age-specific point prevalence of TB brought about by rapid development projected for Cambodia until 2030. No future improvement and continual reduction may constitute lower and upper plausible bounds for future prevalence of active TB.

Projected change in cumulative active tuberculosis (TB) cases and point prevalence in Cambodia from 2010 to 2030. Of the three scenarios presented, no future improvement and continual reduction may constitute lower and upper plausible bounds for future prevalence of active TB in Cambodia; the intermediate third scenario, g ross domestic product ( GDP) projections, is based on the assumption that TB point prevalence falls mirror projected rises in GDP. The no future improvement scenario assumes no further improvement to the TB control programme after 2011; the future TB prevalence projected are based on the estimates of age-specific point prevalence in 2011. The continual reduction model accounts for the reduction in age-specific point prevalence between the 2002 and 2011 NTP surveys, which was then extrapolated to 2030. the GDP projections model accounts for the rapid development Cambodia could experience and the reduction it brings about to age-specific point prevalence of TB. The darker lines indicate the median values.
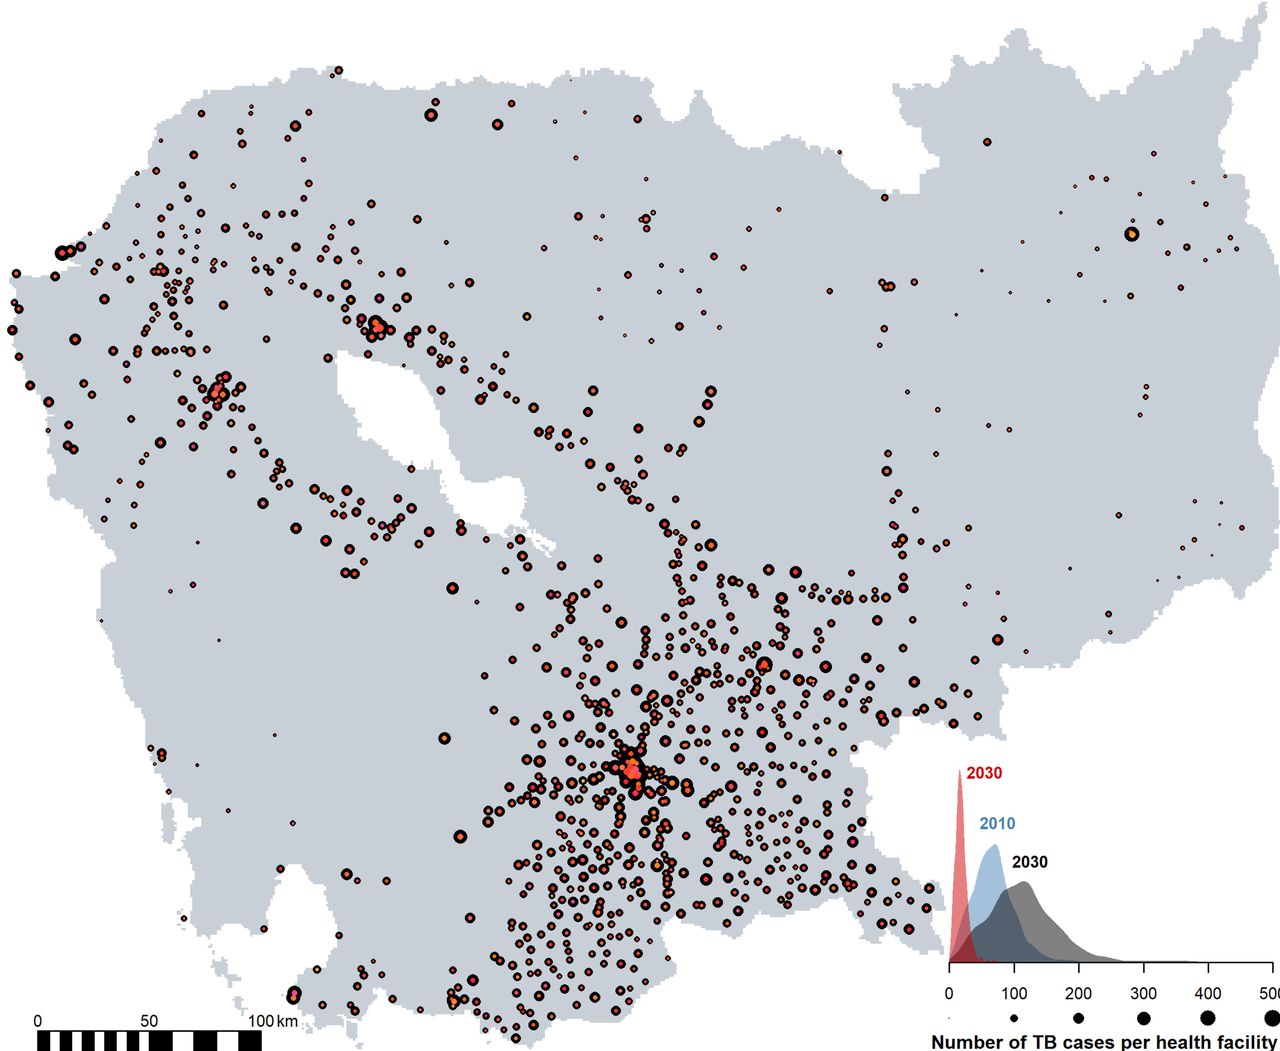
The projected number of active TB cases within the catchment area of each existing government healthcare facility—under the assumption of no new facilities—was determined (and is presented in figure 6) to forecast the future healthcare needs across the country and which areas to prioritise for new healthcare facilities. Under the no future improvement scenario, the burden of existing healthcare facilities is expected to increase across the country, but in particular in cities due to increasing urbanisation. In contrast, if age-specific TB prevalence continues its decline (the continual reduction scenario), existing healthcare facilities should see no further growth in the number of patients being treated through to 2030 (figure 6 and online supplementary material 1).

Projected catchment size of the government healthcare facility in Cambodia in 2030. The size of the points corresponds to the number of active tuberculosis (TB) cases within the catchment area of a government healthcare facility. Two scenarios for 2030 are presented, no future improvement (points in black) and continual reduction (points in hues of red). The burden of the healthcare facility is expected to change over time, with 2010 in blue vs 2030 in dark grey (for the no future improvement scenario) and red (for a continual reduction scenario).
Discussion
Houben and Dodd35 have estimated that about 9 million (~60%) of Cambodia’s population were infected with latent TB in 2014. As the population of Cambodia ages over the next few decades, the resultingly larger pool of older individuals—who are more likely to be infected with latent TB and at risk of TB reactivation due to chronic medical conditions that weaken their immune system's ability to prevent infection36—means that the burden of TB is expected to increase even if the current age-specific prevalence can be maintained. It is therefore imperative that the TB control programme, in which recent improvements have resulted in a substantial decrease in age-specific prevalence between successive NTP surveys, continues to expand, lest the burden of TB grow due to these demographic changes. In another modelling study, Sharma and colleagues37 also recommend additional control efforts to combat the increase in drug-resistant TB forecast in four other high-burden TB countries.
There are echoes of Alice and the Red Queen in the challenge of eliminating TB as a public health problem by 2050—without additional funding and support from international communities to lower-income, high-burden regions, a business-as-usual approach is insufficient to overcome this challenge.38 Improved living environments and socioeconomic status have substantially reduced the burden of TB, which is fundamentally a disease of poverty.38 39 There have been substantial improvements in the age-specific prevalence of TB in Cambodia since the 2002 NTP survey, but if infection rates persist at the lower level seen in the 2011 NTP survey, this study projects a growth in the number of cases and overall prevalence of active TB due to population growth and ageing, with concomitant needs for greater provision of healthcare facilities to treat these patients. In contrast, if the fall in age-specific prevalence can be continued, it is entirely feasible that prevalence rates of active TB in Cambodia could be driven to as low as 1 per 1000. Continued support of the national TB programme is therefore important to effect this outcome. Cambodia, as in many other low-income to middle-income countries (LMICs), has a funding gap for TB treatment and prevention, which was estimated to be US$19 million in 2017.1 The End TB Strategy’s global targets may only be realised through an acceleration of improvements, rather than the maintenance of recent improvements, through research and development.1
In this paper, evidence was synthesised by fusing health and geographic data. This allowed for the mapping of likely active TB prevalence at a high resolution across heterogeneous environments, which could potentially facilitate control efforts and resource planning. We projected that Cambodia’s major cities, such as Phnom Penh and Battambang, have more cases on aggregate, due to their larger populations, but lower prevalence due to their relatively young age profiles. After accounting for demographics and spatial random effects—which represent local heterogeneities in TB prevalence—there was no evidence that urban and rural areas had different risk profiles. This may reflect the widespread access to care at government health facilities in both strata, with the Community DOTS programme, an initiative led by CENAT, providing access to TB care to infected individuals far from the major cities to ensure they are not left behind. As stakeholders’ opinions were regularly sought throughout the study, the projection of the potential burden at government healthcare facilities could be useful when apportioning resources in the future that are targeted at ameliorating active TB (such as active case finding), and may facilitate programme-based operational research.40
As in every modelling study, the projections involved several assumptions. Because of the long latency period and strong effect of age on TB, the model focused primarily on demographic changes to project the probable presence of active TB at cross-sections in time given the demographics structure, rather than transmission dynamics. As a result, the model cannot be used directly to assess the impact of specific changes to the control programme, and future work, similar to that undertaken elsewhere,41–50 would be valuable as Cambodia seeks ways to improve its programme further. The model assumes that the risk factors determined from the 2011 NTP survey can be extrapolated spatially to other regions across Cambodia and temporally. The former is reasonable, given the design of the NTP survey, and we assessed the sensitivity of projections to the latter through scenarios in which future rates are the same as in 2011 or decline either at the same rate as over the period 2002 to 2011 or based on projected per capita GDP growth. There were stark differences between the no-change and declining prevalence scenarios, indicating that a range of outcomes are possible, and future NTP surveys could be used to refine these projections in due course. These projections account for demographic and economic changes but not for other biological, social or policy changes that are known to influence TB risk, such as the provision of social protection programmes,51 52 whose effect is assumed to be subsumed within the three scenarios. Although very rich geospatial data were used to estimate the current and future population distribution across regions of Cambodia, little information was available on migration rates between different parts of the country. While we were able to project future urbanisation, the precise locations of new or expanded urban conglomerations were not available. As a result, there is a risk that the spatial projection of cases may deviate from the eventual one. The effect of international migration on TB in Cambodia is also not accounted for due to the paucity of the data—Cambodia has a large diaspora and TB rates are known to be high among Cambodian migrants in Thailand,53–55 for example. Future research in this area would be invaluable. This work could also enable analyses of disparities in healthcare access by contrasting incident case notifications with the spatial projections of point prevalence of active TB, which could help identify areas to focus future interventions. Our findings encourage further research into health systems’ architecture and optimal resources allocation to achieve continual reduction in TB prevalence, in the face of other emerging public health challenges, such as the rise in non-communicable disease that accompanies ageing populations, that LMICs encounter as they undergo the epidemiological transition.56 This paper provides a successful example of data synthesis from multiple independent sources to inform health system strengthening efforts in LMICs.
As in many other TB high-burden countries, TB case finding has traditionally been done passively at health centres where patients with active TB symptoms seek medical care and the providers are able to diagnose the conditions accurately.57 This strategy is, however, inadequate to measure the burden of undiagnosed TB in the community. In 2016, almost 38% of patients with TB remain undiagnosed or not notified despite a 100% DOTS strategy coverage nationwide.1 30 Narrowing this gap in diagnosis is one way to effect the reduction in the future risk of TB needed to see the lowering of the TB burden in Cambodia as projected in this modelling study.
Acknowledgments
We would like to acknowledge the National Center for Tuberculosis and Leprosy Control (CENAT) for their support for this work. We thank Dr Richard Coker and Dr Mishal Khan for starting the TB Cambodia programme at the Saw Swee Hock School of Public Health at the National University of Singapore. We also wish to thank Dr Borame Dickens and Sun Haoyang for their help with the management of the spatial data.
References
Footnotes
KP and SHP contributed equally.
Handling editor Alberto L Garcia-Basteiro
Contributors ARC, LYH, KE, EEKN and TEM conceptualised the study. ARC, LYH, KE, EEKN, SHP, VS, ST and TEM contributed to study design. SHP, ST, TEM and CENAT were involved in data collection. KP and ARC did the statistical and modelling analyses. KP made the figures. KP, AKJT and KE did the literature review. KP, AKJT and ARC wrote the initial draft. All authors contributed equally to data interpretation, critically reviewed the manuscript and approved the final version.
Funding This work was funded by USIRP under the Infectious Diseases Programme at the Saw Swee Hock School of Public Health at the National University of Singapore. ARC was supported by the Singapore Ministry of Health’s National Medical Research Council under the Centre Grant Programme - Singapore Population Health Improvement Centre (NMRC/CG/C026/2017_NUHS).
Disclaimer This article was prepared while EEKN was employed at the National University of Singapore. She is currently employed at the National Institutes of Health. The opinions expressed in this article are the authors' own and do not reflect the view of the National Institutes of Health, the Department of Health and Human Services, or the United States government.
Competing interests None declared.
Patient consent Not required.
Provenance and peer review Not commissioned; externally peer reviewed.
Data sharing statement No additional data are available.