Article Text

Abstract
Introduction A strong focus on sexual and reproductive health of female adolescents is a key to achieving sustainable development goals, due to the large size of the current cohort in low-income and middle-income countries (LMICs) and adolescents’ biological and social vulnerability. Several indicators of fertility among adolescents are in wide use, but the contribution of adolescent births to all births is poorly understood. We propose and calculate a package of three indicators capturing the contribution of adolescent births to all births, stratified by parity (first and second/higher).
Methods We used Demographic and Health Survey data for 30 LMICs and vital registration for two high-income countries (to calculate levels and trends across a range of countries) for three time periods: 1990–1999, 2000–2009 and 2010–2015. The three indicators were calculated overall and by age thresholds (<16, <18 and <20 years) and exact ages, for each country and time point. Patterns of changes in indicators for the three cumulative thresholds over time are described.
Results In the 30 LMICs, the percentage of all live births occurring to adolescents varied across countries, with a median of 18% for adolescents <20 years. Three countries (Jordan, Indonesia and Rwanda) had levels below 10%; Bangladesh had the highest at 33%. The contribution of adolescent first-order births to all first-order births was high; a median of 49%. Even among second-order and higher-order births, the contribution of adolescent childbearing was appreciable (median of 6%). Over the period under examination, the proportion of adolescent births among all live births declined in the majority of the LMICs.
Conclusion These three indicators add to our understanding of the scale of adolescent childbearing and can be used in conjunction with population estimates to assess the absolute need for age-appropriate and parity-appropriate reproductive, maternal and newborn healthcare and to monitor progress in improving young people’s health.
- health
- medical demography
- health policies and all other topics
- cross-sectional survey
- vital registration
- adolescent fertility
This is an open access article distributed in accordance with the Creative Commons Attribution Non Commercial (CC BY-NC 4.0) license, which permits others to distribute, remix, adapt, build upon this work non-commercially, and license their derivative works on different terms, provided the original work is properly cited, appropriate credit is given, any changes made indicated, and the use is non-commercial. See: http://creativecommons.org/licenses/by-nc/4.0/
Statistics from Altmetric.com
- health
- medical demography
- health policies and all other topics
- cross-sectional survey
- vital registration
- adolescent fertility
Key questions
What is already known?
Indicators of adolescent fertility estimate the incidence/prevalence of adolescent childbearing or timing of childbearing initiation.
It is crucial we also understand the absolute and relative contribution of adolescent births to all births.
What are the new findings?
Across 30 low-income and middle-income countries (LMICs), a median of 18% of all live births were to mothers <20 years of age, and between 2 and 7 of every 10 first-born babies were to adolescent mothers.
In comparison, the contribution of adolescent childbearing to all live births in the two high-income countries was approximately an order of magnitude lower.
What do the new findings imply?
The contribution of adolescent childbearing to all births is substantial in many LMICs, a finding that can energise provision of good quality maternal health services to adolescent girls and their newborns.
Introduction
There are now more adolescents globally than ever before, and the vast majority live in low-middle and middle-income countries (LMICs).1 A strong focus on their sexual and reproductive health needs will be critical to achieving several of the sustainable development goals (SDGs), including universal access to health, poverty eradication, education and gender equality.2–4 Reducing unintended adolescent childbearing has been a global priority since the 1994 International Conference on Population Development and is a target in both millennium development goals and the SDGs.5
In 2015, 19.4 million births occurred to adolescent girls (10–19 years old), of which an estimated 1–2 million were to girls under 15 years.6 7 More than 95% of adolescent births occur in LMICs.8 The number of live births per 1000 women 15–19 years old per year declined in every world region between 1990–1995 and 2010–2015, but still nearly one in five women aged 20–24 globally reported that they had initiated childbearing below the age of 20.5 9 Across all regions, sub-Saharan Africa has the highest percentage of all births occurring to adolescents (>50%)10 and the highest birth rates among adolescents—a level 200-fold higher than some countries in the Western Europe/Central Asia region.11 In most regions, adolescent births are concentrated among the poorest, most rural populations.12
Adolescent childbearing has negative consequences on the health of the mother, her neonate/child as well as on her socioeconomic well-being and educational attainment.13 The adolescent maternal mortality ratio (MMR) is one third higher than the MMR in women aged 20–24, although this increased risk is not consistent across all countries.14 15 Young adolescents (<16 years) in particular are at risk of increased maternal mortality and other negative health sequelae of childbearing.6 16 17 Most recent estimates show that maternal conditions were the leading cause of death among 15–19-year-old females18 19, and an estimated 15% of all deaths among women 10–24 years were due to maternal causes.14 Young adolescents are more likely to experience obstructed labour and fistula,7 especially very young adolescents during their first childbirth.20 In LMICs, children of adolescent mothers are at a higher risk of adverse health outcomes such as stillbirth, neonatal death, premature birth, low Apgar score and low birth weight; and the younger the mother, the greater the risk to her baby.16 20–24 At the same time, first births to women of any age are at increased risk of adverse maternal and neonatal outcomes.25 The risks associated with childbearing in adolescence are therefore compounded by the risk of first pregnancy/childbirth, and first-born children of adolescent mothers are particularly vulnerable to infant mortality and other poor child health outcomes.26 Also, there is some evidence that the risks of poor newborn outcomes of second-order and higher-order births in adolescents are higher compared with those in older women, and these effects hold after adjustment for parity and birth interval.27
Several indicators are commonly used to estimate and monitor the levels of adolescent fertility:
Age-specific fertility rate (ASFR; also called the adolescent birth rate): the number of live births per 1000 adolescents aged 15–19 per year.11The recently published Indicator and Monitoring Framework for the Global Strategy for Women’s, Children’s and Adolescents’ Health (2016–2030) proposes a modification of the adolescent birth rate to also report on young adolescents separately, so that the indicator is the adolescent birth rate (10-14, 15-19) per 1000 women in each age group, to be used as one of the Global Strategy’s 16 key indicators.28
The percentage of girls aged 15–19 years who are currently pregnant or have had a live birth,29 or, alternatively, who have ever been pregnant.30
Adolescent childbearing (also called adolescent-girl pregnancy): the percentage of women aged 20–24 (or 20–29) who had a live birth before age 15 years (early adolescent childbearing),<18 years, or<20 years.12 29 31
Median age at first birth can also capture the extent to which the initiation of childbearing affects adolescents.32
These indicators, with some variability in definitions and populations, estimate the incidence/prevalence of adolescent childbearing or timing of childbearing initiation. However, given the large adolescent global population and the specific biological and social risks to adolescent mothers and their babies, it is crucial we also understand the absolute and relative contribution of adolescent births to all births. One such indicator, used for example by the WHO European Health Information Gateway, is the percentage of all live births to mothers aged under 20 years.33 Such estimates would reflect the composition of all births in a certain population with respect to those occurring to adolescents, and thus be relevant to reproductive and maternal health programming, progress monitoring (demographic indicators, SDGs) and health service provision (midwifery and obstetrics training, clinical care provision and service organisation). This is not a measure of adolescent fertility per se as the denominator is births to women of all ages rather than the adolescent population at risk of pregnancy and would be seen as an additional indicator rather than a replacement for the existing indicators already mentioned.
The objectives of this paper are:
To propose and define a package of three indicators capturing the contribution of adolescent births to all births, and separately for first-order and second/higher-order births, and to provide data requirements for their calculation.
To calculate these indicators for adolescents from various geographical regions and describe current levels and trends over time, with a particular focus on LMICs.
To compare these indicators to other indicators of adolescent fertility to highlight their potential to understanding adolescent childbearing.
Methods
Indicator definitions and data requirements
We define the indicator of the contribution of live births to adolescents (up to age 20 years) to live births to women in all age groups, and, separately, the contribution of first-order vs second-order and higher-order births, as shown in table 1.
Summary of definitions and data requirements for the proposed new indicators
Country selection and data sources
For LMICs, we used the raw data from Demographic and Health Surveys (DHS) and included countries which conducted at least one survey in each of the three time periods—1990–1999, 2000–2009 and 2010–2015; 30 countries met these criteria (table 2). If more than three surveys were available, we included the earliest in the 1990–1999 period and the most recent 2010–2015, with a survey in the 2000–2009 period that was most equally situated between the first and most recent. This sample included countries covering a range of geographical regions, income levels, data types (aggregate and raw) that had easily accessible data to describe trends over time (table 2). For comparative purposes, we included two high-income countries in Europe with aggregate data available from vital registration: Finland (data available for all three indicators) and Slovakia (data for indicator one only).
List of included countries, sources, years of data and indicators calculated
DHS data analysis
DHS are cross-sectional nationally representative household surveys and use model questionnaires which are adapted to each country’s circumstances. The DHS use a multilevel, cluster sampling survey design; survey weights are needed in analysis to adjust for this and for non-response. We used the children ever born section of the women’s questionnaire. Respondents aged 15–49 years were included in the analysis; in 16 of the 90 surveys, only ever-married women were sampled (online supplementary material 1). We calculated the numbers of live births for the numerators and denominators for the 10-year period before each survey, because of likely under-reporting of early adolescent births by girls and young women who were in the 15–19 years age group at the time of the survey.34
Supplemental material
Multiple births (twins, triplets, etc) were considered one delivery “event” and were thus classified as the same birth order. In the calculation of numerators and denominators, births resulting in multiples contributed only one live birth to avoid multiple live births with the same birth order number. Hence, a woman who had twins followed by a singleton, while being of parity 3, contributed one live birth of first birth-order and one live birth of second/higher birth-order to the analysis. While this treatment slightly underestimates the absolute numbers of live births, it does not bias the indicators assuming that women’s risk of having live births resulting in twins, and higher order multiples is not significantly different between adolescents and older women.
The three indicators were calculated overall and by age thresholds and exact ages, for each country and each survey. Data were disaggregated by cumulative thresholds and exact age groups. Absolute and relative changes in indicators for the three cumulative thresholds are described over time. All DHS analysis was conducted in Stata/SE14, with adjustment for survey design (weights, clusters and stratification). The DHS receive government permission, use informed consent and assure respondents of confidentiality.
Results
Most recent survey data
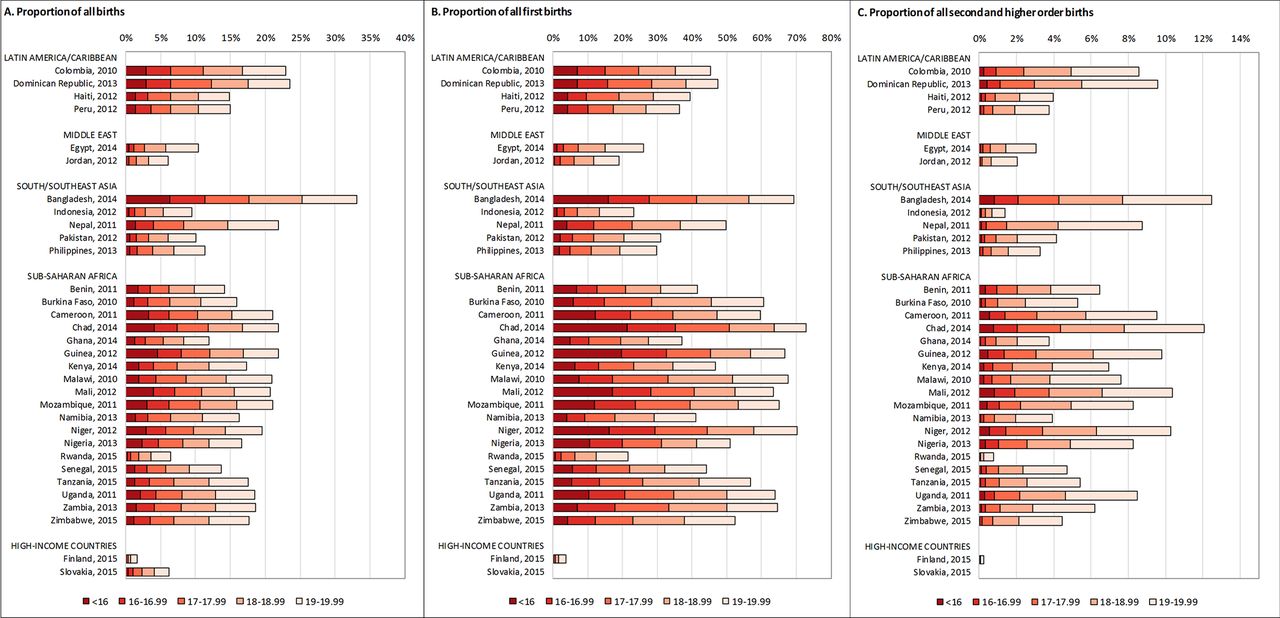
figure 1Figure 1 shows, for the most recent survey data, the contribution of adolescent births to all live births (indicator 1), to first-order live births (indicator 2) and to second-order and higher-order live births (indicator 3), by country, for each annual age increment. The median value for the percentage of all live births to adolescents <20 years of age in the 30 LMICs was 17.5% (table 3). Only three countries (Jordan, Indonesia and Rwanda) had levels below 10%. At the other end of the spectrum, Bangladesh had the highest level at 33.1%, and an additional nine countries had levels above 20%. The percentage of all live births that were among the youngest group of adolescents (<16 years) ranged between 0.1% (Jordan) and 6.3% (Bangladesh), with a median value of 1.5%. In all LMICs, there was a steep rise in the percentage of all live births occurring to adolescents with each annual age threshold segment. At 6.2%, the contribution of adolescent births (<20 years) to all births in Slovakia was similar to the two LMIC countries with the lowest percentages; Rwanda (6.5%) and Jordan (6.0%). However, in Finland, the percentage was much lower at 1.7%. The estimates of the percentages of all, first-order, and second-order and higher order births occurring to adolescents by exact ages in the included countries, and surveys are shown in online supplementary material 2.
Percentage of all live births to adolescents (indicator 1), by age group and survey and change over time
Percentage of adolescent births among all, first-order, and second/higher-order births, disaggregated by exact ages, by country, most recent data.
Looking at the contribution of adolescents to first-order births for the most recent survey, table 4 shows that more than half of all first-order live births are to women <20 years of age in 14 of the 30 LMICs assessed, 13 of them in sub-Saharan Africa. In the 30 LMICs, the median value of the percentage of all first-order live births occurring to adolescents <16 years was 6.1% and to adolescents <20 years was 48.6%. The country with the highest contribution of adolescent first-order births to all first-order births, in both these cumulative age thresholds, was Chad (21.4% and 72.8%, respectively). The lowest percentage of first-order births occurring to adolescents of all age thresholds among the 30 LMICs was in Jordan (0.5% and 19.0%, respectively), and Rwanda was a low outlier in sub-Saharan Africa with 0.7% and 21.5%, respectively. In comparison, in Finland in 2015, the percentage of first-order births occurring to adolescents <16 years was only 0.1% and to adolescents< 20 years was only 3.8%. Parity disaggregated data were not available in Slovakia.
Percentage of all first-order live births to adolescents (indicator 2), by age group and survey and change over time
Table 5 shows the contribution of adolescent second-order and higher-order births to all second-order and higher-order births. In the 30 LMICs, the median value for the most recent survey for adolescents <20 years was 6.3% (lowest in Rwanda at 0.8% and highest in Bangladesh and Chad at 12.5% and 12.1%, respectively). The estimates for the youngest adolescents (<16 years) ranged from ≤0.01% in 16 countries to 0.8% in Bangladesh, Chad and Mali, with a median value of 0.1% across the 30 included LMICs. There were no second-order or higher-order live births reported to girls aged <16 in Finland in 2015, and the contribution of adolescents <20 years to second-order and higher-order births in Finland was negligible at 0.3% in 2015.
Percentage of all second-order and higher-order live births to adolescents (indicator 3), by age group and survey and change over time
Time trends
The change in the three proposed indicators over time is shown for all 32 countries in tables 3–5. Comparing these trends for adolescents <20 years of age between the earliest and most recent survey, we saw seven patterns emerge across the 30 LMICs (table 6).
Pattern 1, which was most common (17 countries), was defined by a reduction in the percentage of adolescent births among all births, first births and subsequent births to women <20 years. In some countries, such as Senegal, Uganda and Niger, these reductions were very marked. For these countries with a very marked reduction, it appears that not just the adolescent and percentage of women having a first birth before the age of 20 are declining, but that adolescent fertility is falling at a greater rate than for other age groups.
In Senegal, for example, there has been a marked fall in the proportion of adolescent births in all three indicators. This is reflected by a fall in the proportion of women who had experienced a first birth before 20 years. In 1992, 55.7% of women aged 20–49 reported that they had given birth before the age of 20, compared with only 38.5% in 2014, a 31% decline (table 7). The median age at first birth in the age group 25–29 years increased by over 2 years in the same time period, from 19.3 to 21.4. The ASFR for 15–19 year olds fell sharply (by 29% between 1992 and 2014), and reduced at a greater rate than in other age groups (the general fertility rate fell by only 17%). A further factor that influenced the decrease in the proportion of births to adolescents was that the proportion of all women of reproductive age 15–49 years who were aged 15–19 years fell from 25% in 1990 to 21% in 2015.35 Similar large reductions in the three indicators were found in Egypt, Jordan, Indonesia, Pakistan and Rwanda. Finland also belonged in this pattern of consistent progressive decline.
Selected indicators of adolescent and overall fertility over time in 30 LMICs (source: DHS surveys results available on StatCompiler.com)
There was one country each in pattern 2 (Benin) and 3 (Chad). Pattern 2 was defined as a country where the overall percentage of adolescent births among all live births has decreased, the percentage of adolescent first births among all first births also decreased, but the percentage of adolescent higher-order births among all higher-order births increased. Pattern 3 described a situation where the overall percentage of adolescent births among all births and contribution of adolescent higher-order births to all higher-order births decreased, but where the percentage of adolescent first births to all first births increased. Chad is also the only country in this sample of countries that saw a rise, although modest, in the percentage of first births occurring to adolescents. This is confirmed by the decline in the median age at first birth between the first and last surveys, from 18.2 in 1996–1997 to 17.9 in 2014–2015.
Colombia and the Philippines are the only countries that saw a rise in the contribution of adolescent births among all three indicators (pattern 4). This reflects a rise in the percentage of women reporting a first birth before the age of 20 years and the 15–19 years ASFR, but the effect is magnified by the fact that fertility in older age groups has declined. In the case of the Philippines, the rise is greatest for first births but is high for both first and subsequent births in Colombia.
In four countries (Nepal, Guinea, Mali and the Dominican Republic), the overall percentage of births among adolescents <20 years (indicator 1) among all live births increased, but there were discordant trends among first-order and higher-order births. Nepal, Guinea and Mali showed a decrease in the contribution of adolescent to first-order births, but an increase in the adolescent contribution to second-order and higher-order births (pattern 5). The opposite was seen in the Dominican Republic which saw an increase in the contribution of adolescent first-order births, but a decrease in the adolescent contribution to second-order and higher-order births (pattern 6). Patterns of adolescent fertility may be partly responsible for these patterns, but wider fertility processes that affected the denominator, such as falling general fertility which would affect the proportion of all births that are first or higher-order, may well also have contributed. In the case of the Dominican Republic, the result is largely due to adolescent fertility rates increasing slightly while the general fertility rate declined by a third over this time period (table 7).
An apparent anomaly is the last pattern 7 (Namibia, Haiti, Peru, Bangladesh, and Malawi), where the overall proportion of births to adolescents <20 years among all live births has increased, but both of the component indicators have fallen. In all these countries except Peru, the ASFR 15–19 years fell, but by a smaller extent than the general fertility rate. In Peru, the 15–19 years ASFR increased slightly, while general fertility declined substantially. This pattern is consistent with the overall increase in the proportion of all births that are to adolescent mothers. By contrast, the fact that the proportion of both first births and higher-order births fell could have been driven by changes over time in the percentage of all births that were first births, as is the case in the context of declining overall fertility. Hence, the proportion of all births that occur to adolescents will be driven higher because a higher proportion of adolescent births are first births.
Discussion
Summary
In this paper, we propose an additional set of three indicators which capture the contribution of adolescent births to all births, and separately for first-order and second/higher-order births. These indicators help to place adolescent fertility in a broader demographic context of overall fertility and childbearing, and can thus serve as a basis for improving the focus on and provision of reproductive/maternal health services to adolescent girls and their newborns. We found that in the 30 included LMICs, a substantial proportion of all live births occurred to adolescents. The extent of this phenomenon varied across countries, with a median of 18% for adolescents <20 years. This was mainly due to the high contribution of adolescent first-order births to all first-order births, showing a median of 49% across the 30 LMICs. However, even among second-order and higher-order births, adolescent childbearing was appreciable (median across countries of 6%).
Over the period under examination, the proportion of adolescent births among all live births declined in the majority of the countries. However, as the number and complexity of patterns of change over time showed, the interpretation of changes in these indicators over time is complex because they are influenced by demographic factors other than variation in the adolescent fertility rate and percentage of women having their first birth before the age of 20 years. Due to being expressed as a proportion of all births, the proposed indicators are influenced by the levels of and trends in fertility rates not just among adolescents but also among older age groups, as well as by changes in the proportion of all women of reproductive age who are below the age of 20 years.
Limitations
The main strength of this set of proposed indicators is that they can be constructed from available secondary data. However, like indicators of adolescent and general fertility levels based on population-representative surveys, they have limitations. The first issue is the focus on live births—mainly based on data availability in LMICs—leads to the exclusion of pregnancies that resulted in miscarriage, induced abortion or stillbirth. This is a problem as adolescent women are at higher risk of negative perinatal outcomes, so a lower proportion of their pregnancies result in live births. Second, population-based surveys such as the DHS, only sample women aged 15–49 years old at time of the survey, therefore missing live births to girls who are younger than 15 years at the time of the survey. This would have likely resulted in a slight underestimation of the contribution of adolescent live births to all live births.
Third, we used the period 0–9 years before each survey for indicator estimation due to age-related biases in reporting live births, particularly among young adolescents.25 However, this also means that the estimates cover a longer period (not providing the most up-to-date picture even when the most recent survey is used), and that these 10-year survey recall periods overlap in some countries included in this analysis. Last, we recognise that as the proposed indicators are affected by a number of demographic processes, it might be difficult to interpret trends over time. This relates particularly to the birth order disaggregated component indicators (indicators 2 and 3), which are therefore probably best only used as cross-sectional indicators for most recent data available. We reiterate that these indicators are not suitable for tracking and monitoring adolescent fertility per se as they are influenced by complex population changes over time and are to be used in conjuction with other commonly used indicators of adolescent fertility.
Interpretation and case for including proposed indicators
Notwithstanding these limitations, an understanding of the proportion of all births that are to adolescents through the set of three indicators proposed in this paper is important for two main reasons. First, these proposed indicators provide valuable demographic information. For example, when considered in conjunction with overall adolescent fertility, they give an indication of adolescent fertility in relation to fertility rates in older women. As we show, a number of countries within Latin America and parts of Asia have lowered overall fertility without making similar gains in adolescent fertility. Such enriched understanding of demographic processes should be used for planning sexual and reproductive healthcare provision, including contraception, safe abortion care and maternal healthcare. In this regard, the proposed set of indicators can be used to calculate the total number of births expected in a given year, disaggregated by age, parity and region.
Second, by providing a more health system perspective on adolescent reproduction than currently available indicators of fertility, these indicators can support the planning and delivery of appropriate and good quality reproductive and maternal care to adolescents and their infants. For example, it can be impactful to note that three of every four first-order births in Bangladesh or Chad are to adolescents <20 years of age. Because the majority of adolescent births are first order, our second indicator may be seen as more important to policy and practice. However, second-order and higher-order births among adolescents should not be disregarded as these indicate, to a certain extent, a failure to prevent repeat pregnancies among this vulnerable population. Recent evidence also suggests that the increased risk of neonatal mortality for second-order and higher-order births is actually greater than for first-order births when compared with similar parities in women in their 20s.27 In most of the countries, we included in our analysis, the contribution of adolescent (<20 years) second-order and higher-order births to all second-order and higher-order births is relatively small (<10%), but the use of this indicator has highlighted several countries where more than 1 in 10 second-order and higher-order births is to adolescents (Bangladesh, Chad, Mali, Niger). This is not insignificant from the point of view of providing pregnancy, intrapartum and postpartum care, and it gives valuable information to policy makers on the failure to prevent these pregnancies.
Health service provision to pregnant, delivering and postpartum adolescents can be improved by recognising their biological and social needs and vulnerabilities. While recent studies show that the increased risk of maternal mortality associated with adolescent motherhood is not as large or as consistent across countries as previously thought, women aged 15–19 years still have higher MMRs than women in their 20s in most countries.14 Further evidence suggests that pregnant adolescents are at greater risk of developing certain conditions such as pre-eclampsia or eclampsia and fistula resulting from obstructed labour compared with older women.36 37 While adolescents are more likely to have malaria infection during pregnancy than older women,38 a study in Uganda found that pregnant adolescents are less able to recognise the risks posed by this condition.39
Adolescents also face specific barriers when seeking maternal healthcare, and it is particularly important for countries with a high proportion of adolescent pregnancies to ensure that the services provided are adolescent friendly. In select countries, there is evidence that adolescents make less use of antenatal care and skilled care at delivery.40–42 In addition, a study in West Africa found that adolescents were less likely to commence antenatal care within the first trimester, to attend four or more antenatal visits, and reported receiving fewer components of care.43 While in some cases, poorer access to appropriate levels of maternal healthcare may reflect socioeconomic factors, studies also suggest that many adolescents face considerable stigma from healthcare providers, which presents a barrier to seeking care.40 Postpartum contraception and other effective interventions to reduce rapid repeat pregnancies (very common in adolescents) are also an important factor.44
Conclusion
In conclusion, while an indicator of the percentage of all births occurring to adolescents has been defined and used previously,9 33 we suggest an expanded set of three indicators disaggregated by parity and with multiple age thresholds. We also identified multiple patterns through an interpretation of trends in these indicators over time. We conclude that these three indicators add considerably to our understanding of the scale of adolescent childbearing in different countries, changes over time, and can be used alongside more traditional measures of adolescent fertility to quantify the contribution and extent of adolescent births, and first-order births in particular. Further, these indicators can be used in conjunction with population estimates to assess the absolute need for age-appropriate and parity-appropriate reproductive (contraceptive, abortion, maternal and neonatal healthcare services) and to monitor progress in improving young people’s health, and disaggregated by region to support local decision making.
Acknowledgments
The authors would like to thank Frances McConville for encouraging this inquiry, Matti Parry for his input on analytical methods and comments on an early version of the manuscript. We also thank Onikepe Owolabi for valuable discussions on the provision of adolescent friendly reproductive and maternal health services.
References
Footnotes
Handling editor Seye Abimbola
Contributors DAR, LB, SN, ER: designed the analyses. LB, SN: conducted the data analysis. LB, SN, ER: drafted tables and figures. All authors participated on interpreting the results, drafting and commenting on the paper.
Funding LB and ER were partly funded by a research grant from Merck Sharp and Dohme (MSD) through its MSD for Mothers programme.
Disclaimer The content of this article is solely the responsibility of the authors and does not represent the official views of MSD and also does not necessarily represent the official views of the institutions to which the authors are affiliated.
Competing interests LB and ER report receiving a research grant from Merck Sharp and Dohme (MSD) through its MSD for Mothers programme. Funding was used for general financial support, including staff salaries, travel and overheads. MSD for Mothers is an initiative of Merck & Co, Inc, Kenilworth, NJ, USA.
Patient consent Not required.
Ethics approval The Research Ethics Committee of the London School of Hygiene and Tropical Medicine approved our analyses.
Provenance and peer review Not commissioned; externally peer reviewed.
Data sharing statement No additional data are available.