Article Text

Abstract
Background To lower the risk of diabetes and heart disease in Africa, identification of African-centred thresholds for inexpensive biomarkers of insulin resistance (IR) is essential. The waist circumference (WC) thresholds that predicts IR in African men and women have not been established, but investigations recently conducted in Africa using indirect measures of IR suggest IR is predicted by WC of 80–95 cm in men and 90–99 cm in women. These WC cannot be used for guidelines until validated by direct measurements of IR and visceral adipose tissue (VAT). Therefore, we determined in a group of African-born black people living in America (A) the WC, which predicts IR and (B) the influence of abdominal fat distribution on IR.
Methods The 375 participants (age 38±10 years (mean±SD), 67% men) had IR determined by HOMA-IR and Matsuda index. VAT and subcutaneous adipose tissue (SAT) were measured by abdominal CT scans. Optimal WC for the prediction of IR was determined in sex-specific analyses by area under the receiver operating characteristic (AUC-ROC) and Youden index.
Results Women had more SAT (203±114 vs 128±74 cm2) and less VAT than men (63±48 vs 117±72 cm2, p<0.001). Optimal WC for prediction of IR in men and women were: 91 cm (AUC-ROC: 0.80±0.03 (mean±SE)) and 96 cm (AUC-ROC: 0.81±0.08), respectively. Regression analyses revealed a significant sex–VAT interaction (p<0.001). Therefore, for every unit increase in VAT, women had a 0.94 higher unit increase in SAT and 0.07 higher unit increase in WC than men.
Conclusion Working with a group of African-born black people living in America, we accessed technology, which validated observations made in Africa. Higher SAT at every level of VAT explained why the WC that predicted IR was higher in women (96 cm) than men (91 cm). For Africans to benefit from WC measurements, convening a panel of experts to develop evidence-based African-centred WC guidelines may be the way forward.
- waist circumference
- insulin resistance
- Africans
- visceral adiposity
This is an open access article distributed in accordance with the Creative Commons Attribution Non Commercial (CC BY-NC 4.0) license, which permits others to distribute, remix, adapt, build upon this work non-commercially, and license their derivative works on different terms, provided the original work is properly cited, appropriate credit is given, any changes made indicated, and the use is non-commercial. See: http://creativecommons.org/licenses/by-nc/4.0/
Statistics from Altmetric.com
Key questions
What is already known?
Waist circumference is an inexpensive biomarker for insulin resistance, a proxy for visceral adipose tissue and a better predictor than body mass index for risk for diabetes and cardiovascular disease.
As the waist circumference that predicts insulin resistance in Africans is unknown, both the International Diabetes Federation and the American Heart Association recommend using waist circumference thresholds determined in whites .
What are the new findings?
Working with a group of African-born black people living in America, the waist circumference that predicted insulin resistance in men and women were 91 cm and 96 cm, respectively.
The waist circumference that predicted insulin resistance was higher in women than men because at every level of visceral adipose tissue, women had more subcutaneous adipose tissue.
What do the new findings imply?
As waist circumference thresholds determined in Africans differ from waist circumference used in whites, convening an expert panel to establish evidence-based African-specific guidelines will make it possible for Africans to benefit from this low cost, valuable marker of insulin resistance.
Introduction
Non-communicable diseases such as diabetes and cardiovascular disease are common in Africa.1 2 Both diseases are closely linked to insulin resistance (IR).3–5 Eliminating global health inequities related to IR requires the development of population-specific screening tests. Waist circumference (WC) as a proxy for visceral adipose tissue (VAT) is an inexpensive marker of IR.3 6 The link between IR and VAT is universally accepted even though the mechanisms by which VAT promotes IR are not understood.3 7–11 Overall, major differences exist by sex and race/ethnicity in the relationship between IR, VAT and WC.3 4 6 12
In 2008, the WHO convened a committee to establish international guidelines for WC thresholds.6 Due to the paucity of data in Africans, WHO decided against providing WC for guidelines for Africans. The International Diabetes Federation and the American Heart Association/National Heart Lung and Blood Institute (AHA/NHLBI) took a different approach.3 4 The International Diabetes Federation decided that until African data were available, WC thresholds established in Europeans should be applied to Africans (men: 94 cm; women: 80 cm). AHA/NHLBI decided to apply the WC used in America to Africans (men: 102 cm; women: 88 cm).3 4
Since 2011, eight investigations designed to identify the WC that predicts IR have been conducted in South Africa, the Democratic Republic of Congo and Benin13–20 (table 1). These studies relied on the five parameters of the metabolic syndrome. The components of the metabolic syndrome are: triglyceride, high-density lipoprotein-cholesterol, fasting glucose, blood pressure and WC.3 The WC thresholds reported in these eight studies were the WC optimally predicted by one, two or three metabolic syndrome components.
Literature review of WC in Africans that predicts insulin resistance or metabolic syndrome
The results of these eight studies differ from International Diabetes Federation and AHA/NHLBI guidelines in three ways (table 1).13–20 First, the authors report that the WC of risk is higher in women than men.13 15–20 Second, they report that the WC of risk in women is 90–99 cm. These WC are higher than the thresholds recommended for women by both the International Diabetes Federation and AHA/NHLBI (80 cm and 88 cm, respectively). Third, they state that the WC of risk in African men is 80–95 cm and therefore lower than guidelines for AHA/NHLBI but not International Diabetes Federation.
Data from these eight studies are important but not sufficient for establishing guidelines.13–20 These studies leveraged the readily available data points of the metabolic syndrome. However, metabolic syndrome variables were chosen because of their individual association with IR and not their ability to predict each other.3 To establish the WC that predicts IR in Africans, IR must be measured, VAT quantified and the relationship between IR, WC and VAT determined.
Resources to collect these data are not readily available in Africa. However, IR measurements and CT scanners programmed to assess abdominal fat distribution are available in America. Therefore, our goals were to determine in a group of African-born black people living in America (A) the WC that best predicts IR and (B) how sex differences in abdominal fat distribution affect the WC that predicts IR.
Methods
Population
The Africans in America cohort was established to evaluate the cardiometabolic health of Africans living in the USA.21–24
Recruitment occurred between February 2008 and January 2018 and was achieved by newspaper advertisements (43%), previous participant referrals (30%) and flyers (6%). The remaining 21% of participants heard about the study at community events, church meetings and the National Institutes of Health (NIH) website. The National Institute of Diabetes Digestive and Kidney Diseases Institutional Review Board (ClinicalTrials.gov identifier: NCT00001853) approved the study. Informed written consent was obtained prior to enrolment.
During pre-enrolment telephone interviews, callers had to report that they were born in sub-Saharan Africa to two black parents who were also born in sub-Saharan Africa. In addition, they had to state they were healthy and to their knowledge did not have diabetes.
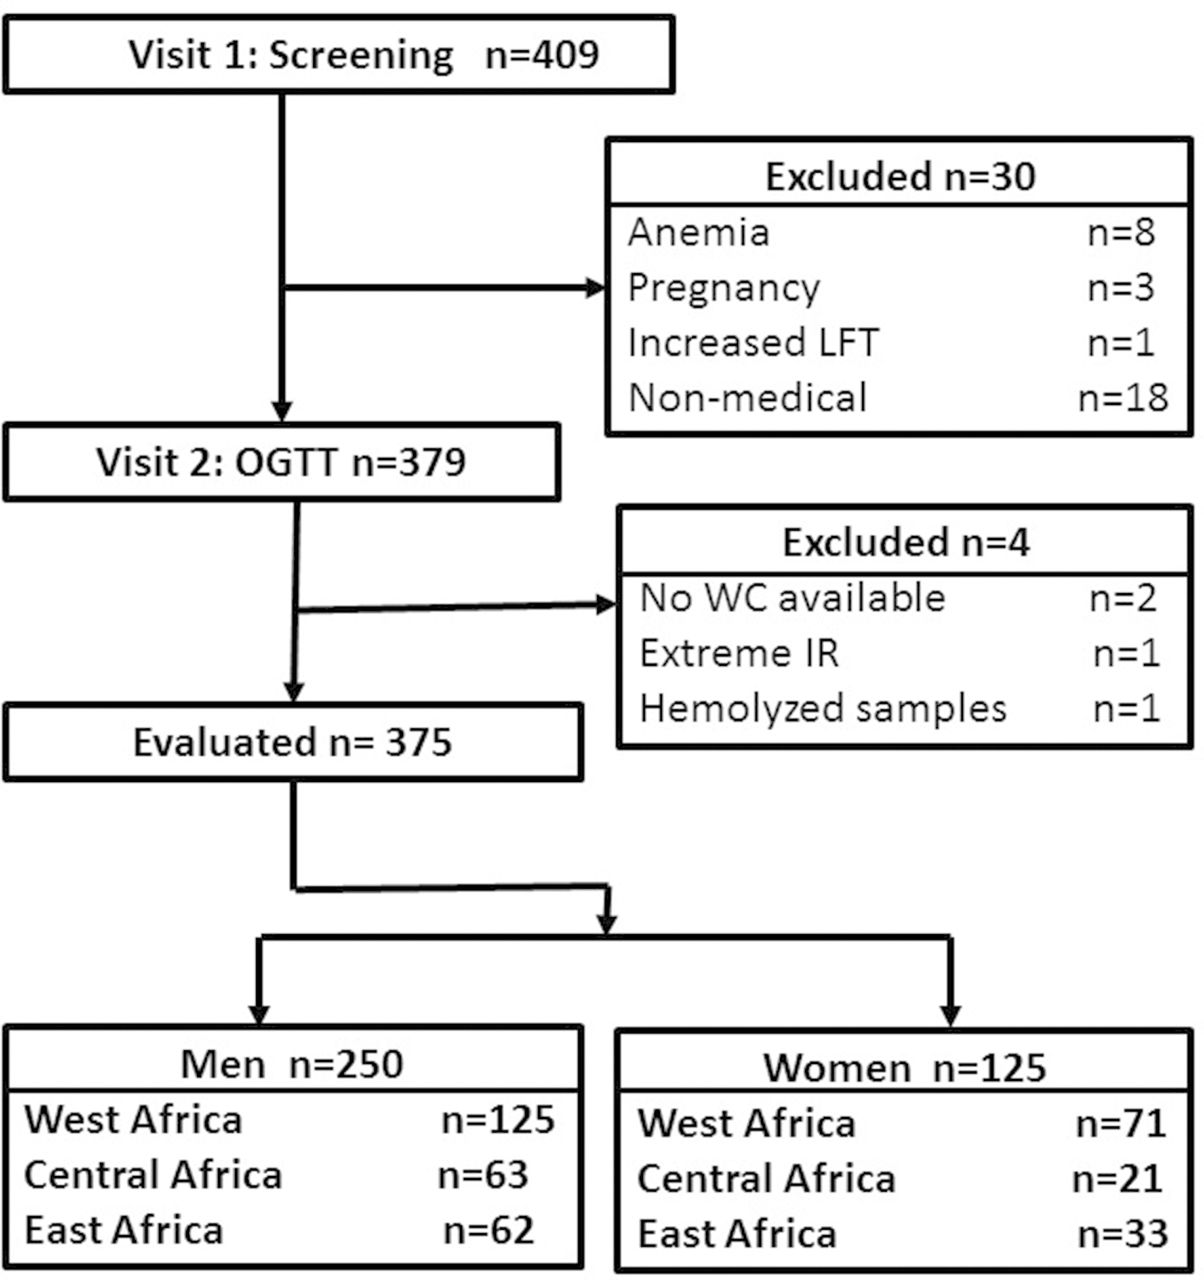
Four hundred and nine African-born black people living in America participated in visit 1 (figure 1). Thirty Africans did not proceed to visit 2 because of anaemia (n=8), pregnancy (n=3), increased liver function tests (LFT) (n=1) or scheduling conflicts with work (n=18). Of the 379 enrollees who did go on to visit 2, two did not have WC measured, one had extreme IR (fasting insulin was 803.6 pmol/L) and one had haemolysed blood samples at baseline so IR could not be calculated by either HOMA-IR or Matsuda index. Therefore, 375 Africans (67% male, age 38±10 (mean±SD), range 20-64 years) were evaluated. The African regions of origin of the participants were: West (52%), Central (23%) and East (25%).

Flow diagram for enrolment. OGTT, oral glucose tolerance test; WC, waist circumference.
All participants had two outpatient visits at the NIH Clinical Center, Bethesda, Maryland. Sixty-six consecutively enrolled participants had three visits.
At visit 1, a history, physical and EKG were performed. The history includes information on alcohol intake. Routine blood tests were performed to confirm the absence of anaemia, kidney, liver and thyroid disease.
For visit 2, participants fasted for 12 hours and came to the Clinical Center at 07:00. Weight was measured using a calibrated digital scale (Scale-Tronix 5702, Carol Stream, Illinois, USA). Height was measured in triplicate with a wall stadiometer (Seca 242, Hanover, Maryland, USA). Then the participant rested quietly in a chair for 20 min. BP was taken three times, 2 min apart with an automated cuff (Critikon BP Cuff, General Electric) and machine (Philips SureSigns vs3). The mean of the last two readings was recorded.
Glucose tolerance was determined by an OGTT (Trutol 75; Custom Laboratories, Baltimore, Maryland, USA) with samples for glucose and insulin taken at −15, 0, 30, 60 and 120 min.
Glucose tolerance status was diagnosed according to glucose concentrations for the OGTT.25 Individuals identified with either prediabetes or diabetes were combined into a single group and referred to as abnormal glucose tolerant (Abnl-GT). After the OGTT was completed, an CT scan (Siemens and Somatom Force Scanner, Munich, Germany) was performed at the level of the L2-3 vertebrae using automated software for the measurement of VAT and subcutaneous adipose tissue (SAT) (figure 2).26
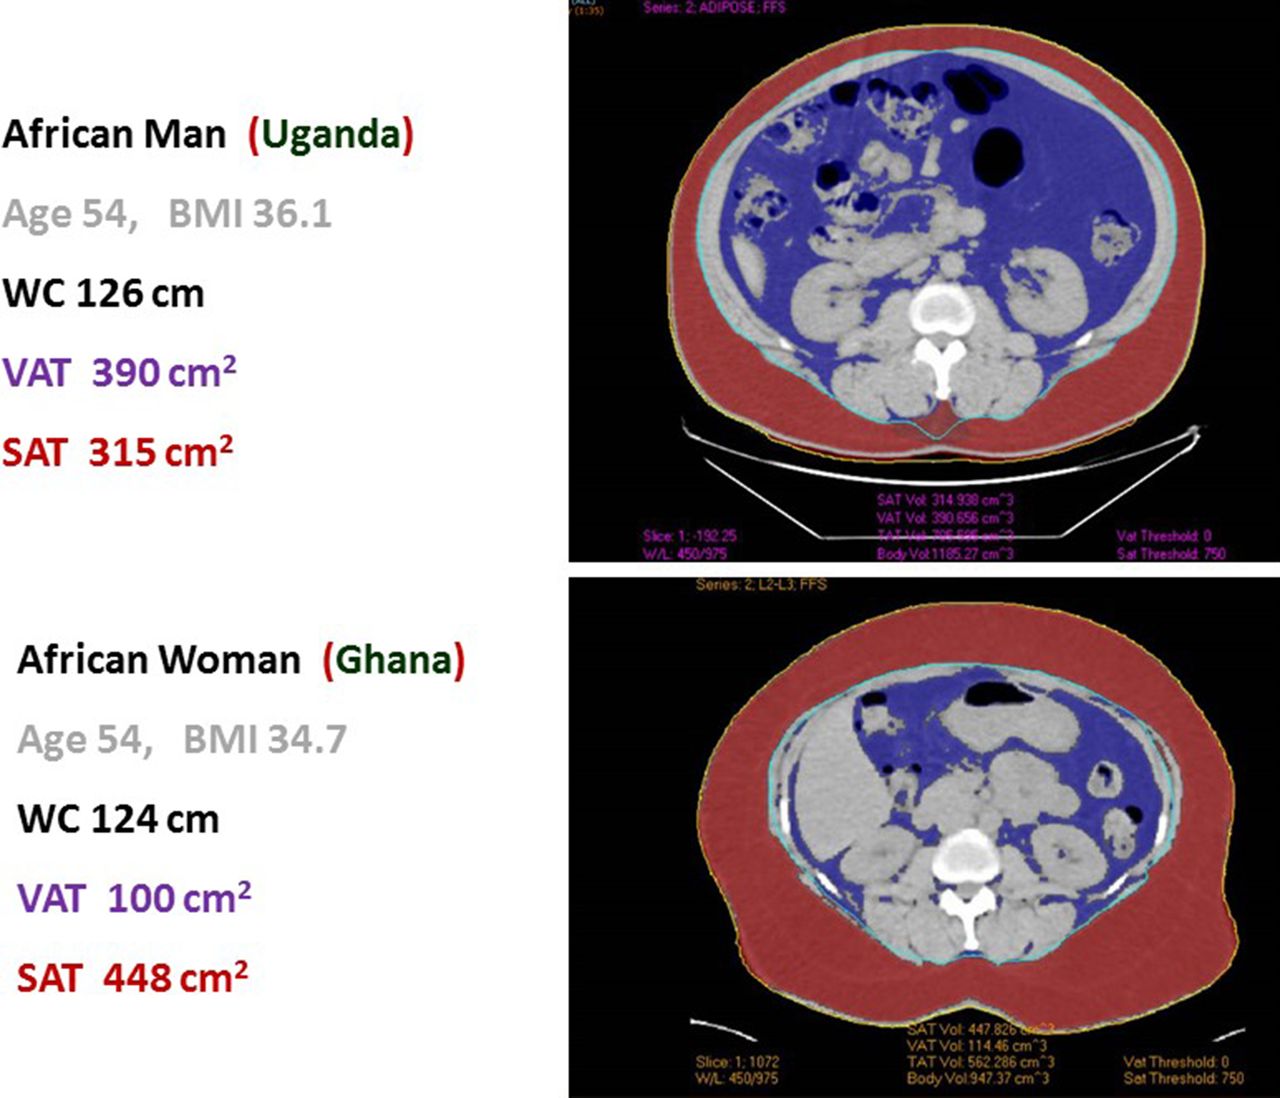
Example of automated VAT and SAT scans in African immigrant man and woman of similar age, BMI and WC. BMI, body mass index; SAT, subcutaneous adipose tissue; VAT, visceral adipose tissue; WC, waist circumference.
At visit 3, 66 consecutively enrolled participants (60% male) had an insulin modified-frequently sampled intravenous glucose tolerance test performed. An intravenous catheter was placed in each antecubital vein. Baseline samples were obtained. Dextrose (0.3 g/kg) was administered intravenously over 1 min. Insulin (0.03 U/kg) was given as a bolus at 20 min. Samples for glucose and insulin were drawn at: −10, –1, 0, 1, 2, 3, 4, 5, 6, 7, 8, 10, 12, 14, 16, 19, 22, 23, 24, 25, 27, 30, 40, 50, 60, 70, 80, 90, 100, 120, 150 and 180 min. Glucose and insulin concentrations were entered into the minimal model for calculation of the insulin sensitivity index (MinMOD Millenium V.6.02).27
Waist circumferences
Immediately prior to the OGTT while the participant was still fasting, WC was measured at two levels: (1) at the superior border of the iliac crest according to National Health and Nutrition Examination Survey protocol and referred to as WC1 and (2) at the midpoint between the iliac crest and the lowest palpable rib according to WHO protocol and referred to as WC2 (6 28). Measurements were taken in triplicate at the end of expiration using a stretch-resistant tape measure with the person standing with feet hip width apart and weight evenly distributed. The mean of three values was recorded.
Insulin resistance
IR was measured in three ways:
Method 1: HOMA-IR:
( ) using the threshold at the highest quartile of the population distribution.
Method 2: Matsuda Index:
 using the threshold at the lowest quartile of the population distribution.
Method 3
Insulin sensitivity index:
Calculated from the minimal model using MinMOD Millenium V.6.02. based on the glucose and insulin concentrations obtained during the insulin modified-frequently sampled intravenous glucose tolerance test performed at visit 3.27
Insulin secretion
The insulinogenic index:
( ).
).
Glucose tolerance status group
The cohort was divided into four groups according to the glucose tolerance status determined at visit 2 by the OGTT:
Group 1: normal glucose tolerant (NGT) (reference).
Group 2: NGT and IR.
Group 3: Abnl-GT and IR.
Group 4: Abnl-GT and not IR.
Assays
Glucose was measured in plasma and insulin was measured in serum (Roche Cobas 6000 analyzer, Roche Diagnostics).
Statistical analyses
Data are presented as mean±SD. Comparisons of Africans born in West, Central and East Africa were by one-way analysis of variance with Bonferroni corrections for continuous variables and χ2 test for categorical variables. With the NGT group (group 1) as the reference group, multiple regression analyses were used to compare characteristics of groups 2, 3 and 4 to group 1.
All analyses for the determination of the WC that predicts IR were performed separately for men and women. Area under the receiver operating characteristic (AUC-ROC) curves were calculated to determine the ability of WC to predict IR. In addition, the optimal WC threshold for the prediction of IR was determined by the Youden index. The Youden index represents the maximum value of 1−(sensitivity+specificity) and is considered to be optimal combination of sensitivity and specificity. Pearson correlations were used to determine relationships between WC and VAT, and SAT and VAT. In multiple regression analyses with WC as the dependent variable, the interaction between sex and VAT and the effect of length of stay in the USA were evaluated.
Study data were collected and managed using Research Electronic Data Capture, an electronic data capture tool hosted by National Instutite of Diabetes Digestive and Kidney Diseases (NIDDK).29 P values <0.05 were considered significant. Analyses were performed with STATA V.15.
Results
At enrolment, the age of the participants were: 38±10 years. The age of immigration was: 26±10 years. Years lived in the USA was: 12±9 years. Independent of whether the participants were born in West, Central or East Africa, there were no differences in body size, fat distribution, glucose metabolism, liver function or demographic and social factors including alcohol intake (online supplementary appendix table 1). Therefore, the participants were combined into sex-specific groups independent of African region of origin.
Supplemental material
Table 2 provides a comparison of the men and women. Degree of IR did not vary by sex. However, men had lower BMI, higher VAT and less SAT than women. Therefore, the WC that predicts IR was determined in a sex-specific manner.
Population characteristics
Glucose tolerance status
With IR defined by HOMA-IR, the cohort was divided into four glucose tolerance categories: (1) NGT (2) NGT and IR (3) Abnl-GT and IR (4) Abnl-GT and not IR.
Men
The frequency of each glucose tolerance category was: 48% (120/250), 9% (23/250), 15%(38/250) and 28% (69/250), respectively.
Women
The frequency of each glucose tolerance category was: 58% (72/125), 14% (18/125), 12% (15/125) and 16% (20/125), respectively.
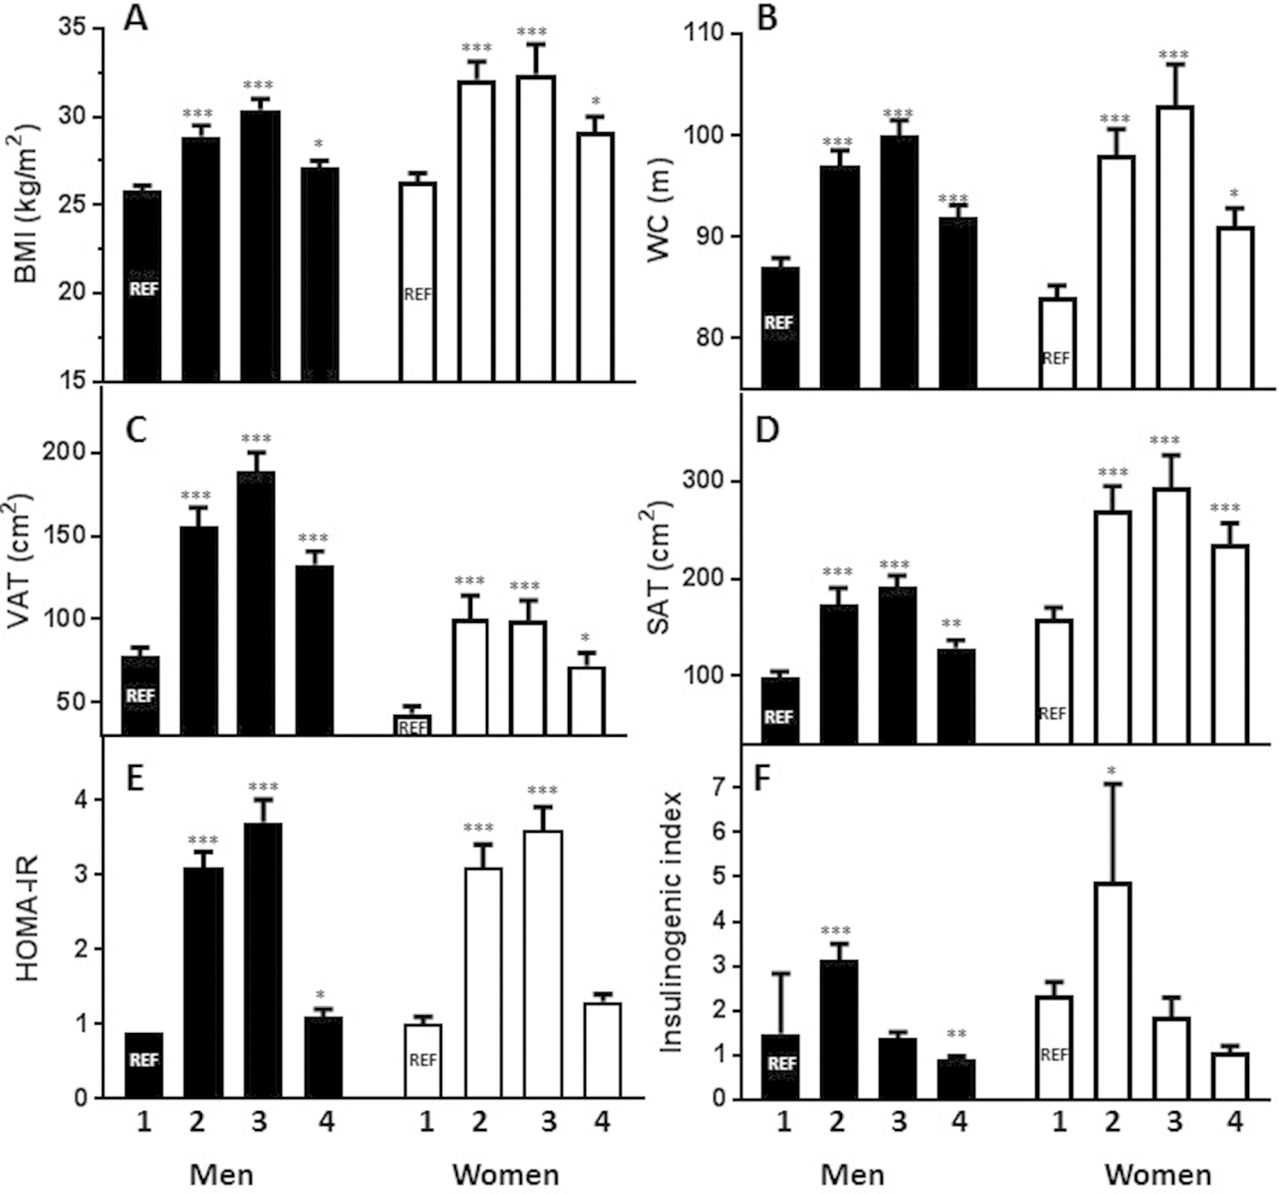
Figure 3 presents by sex and glucose tolerance category the distribution of: (A) BMI, (B) WC, (C) VAT, (D) SAT, (E) HOMA-IR and (F) insulinogenic index.

Metabolic characteristics by glucose tolerance group. Men: solid bars; women: open bars. Group 1: normal glucose tolerant (NGT) (reference group (REF)); group 2: NGT and insulin resistant (IR); group 3: abnormal glucose tolerant (Abnl-GT) and IR; group 4: Abnl-GT and no IR. (A) Body mass index (BMI); (B) waist circumference (WC); (C) visceral adipose tissue (VAT); (D) subcutaneous adipose tissue (SAT); (E) HOMA-IR; (F) insulinogenic index. Comparison with group 1 (NGT): *P≤0.05, **p≤0.01, ***p≤0.001.
Insulin-resistant categories
The insulin-resistant categories include the men and women who were in group 2: NGT and IR, and group 3: Abnl-GT and IR.
Men
Twenty-four per cent (61/250) of the men were insulin resistant (group 2 and group 3).
Women
Twenty-six per cent (33/125) of the women were insulin resistant (group 2 and group 3).
Abnl-GT categories
The Abnl-GT categories include all the men and women in groups 3 and 4.
Men
Forty-three percent (107/250) of the men had Abnl-GT (group 3 and group 4). Of the 107 men with Abnl-GT, 99 had prediabetes and 8 had diabetes. These conditions were not previously known and diagnosed by the OGTT done at visit 2.
Women
Twenty-eight per cent (35/125) of women had abnormal glucose tolerance (group 3 and group 4). Of the 35 women with Abnl-GT, 31 had prediabetes and 4 had diabetes. As with the men, the diagnosis of both prediabetes and diabetes was based on the OGTT done at visit 2.
Abnl-GT without IR
This category represents only group 4. As these individuals did not have IR, they would not be identified by WC.
Men
There are 69 men with Abnl-GT without IR. Insulinogenic index in groups 1 versus 4 were: (1.4±1.0 vs 0.9±0.5, p=0.003, respectively (Figure 3F). Hence, group 4 had significantly lower beta-cell secretion than group 1.
Women
There are 20 women with Abnl-GT without IR. Insulinogenic ndex in groups 1 versus 4 were: 2.1±2.2 vs 1.0±0.5, p=0.215, respectively (figure 3F). While the insulinogenic index was lower in group 4 than group 1, the difference did not reach statistical significance.
All of the results described in this section were similar when IR categories were determined by the lowest quartile of Matsuda index (online supplementary appendix table 2) rather than the highest quartile of HOMA-IR (figure 3).
Optimal WC to predict IR
Men
Optimal WC1 (National Health and Nutrition Examination Survey (NHANES) method) for the prediction of IR was 91 cm for both HOMA-IR and Matsuda index (table 3, part A). Optimal WC2 (WHO method) for the prediction of IR was 92 cm for HOMA-IR and 91 cm for Matsuda index (table 3, part A). In the subset of men who had IR measured by the insulin sensitivity index, optimal WC for the prediction of IR by the insulin sensitivity index was 91 cm.
Women
Optimal WC1 (NHANES method) for the prediction of IR was 96 cm for both HOMA-IR and Matsuda index (table 3, part B). Optimal WC2 (WHO method) for prediction of IR was 95 cm for HOMA-IR and Matsuda index (table 3, part B). The subset of women with IR measured by the insulin sensitivity index was too small for analyses.
Optimal WC to predict insulin resistance (IR) by HOMA-IR and Matsuda index
Sex differences in the relationships between WC, VAT and SAT
VAT was higher in men than women (117±72 vs 63±48 cm2, p<0.001) (figure 3C), but SAT was higher in women than men (203±114 vs 127±74 cm2, p<0.001) (figure 3D). With WC as the dependent variable and VAT as the independent variable (adjusted R2=0.57), there was a significant interaction between sex and VAT (p<0.001), so for every unit increase in VAT, the increase in WC was 0.07 units higher in women than men (figure 4A). With SAT as the dependent variable and VAT as the independent variable (adjusted R2=0.53), there was a significant interaction between sex and VAT (p<0.001), so for every unit increase in VAT, the increase in SAT was 0.94 units higher in women (figure 4B). To determine if length of stay in the USA influenced the relationship of VAT to either WC or SAT, the multiple regression was repeated adding years in the USA as an independent variable. In both cases, adjusted R2 did not change and the p value for years in the USA was >0.50.

Correlations between central fat depots. Men: solid circles, dotted line; women: open circles, solid line. (A) Correlation of WC to VAT, interaction of sex and WC significant p<0.001, equation for men: WC=77.62+0.12*VAT; equation for women: WC=77.43+0.19*VAT. (B) Correlation of SAT to VAT, interaction of sex and WC significant p<0.001, equation for men: SAT=47.56+0.69*VAT; equation for women: SAT=101.44+1.63*VAT. VAT, visceral adipose tissue; WC, waist circumference.
Discussion
This is the first examination of the relationship of VAT to IR and WC in a group of African-born black people living in America. The WC thresholds that optimally predicted IR in men and women were: 91 cm and 96 cm, respectively. Importantly, studies conducted in South Africa, the Democratic Republic of Congo and Benin using less rigorous techniques also found that the WC that predicted IR was higher in women than men.13–20 The WC found to predict IR in these studies was in the range of 80–94 cm for men and 90–99 cm for women.
In short, our work with African-born adults living in America made it possible for us to validate results from studies conducted in Africa. Because we had the opportunity to measure VAT by CT scan, we were able to provide a metabolic basis for why the WC which predicted IR was higher in African women than men. IR is linked to VAT, and at every level of VAT, African women had more SAT than men; therefore, higher WC at the same level of VAT can be accounted for by sex differences in SAT. Interestingly, studies in Japan have also found that at similar levels of VAT, Japanese women have higher levels of SAT and a higher WC of risk than men.30 Hence, our finding that the WC that predicts IR is higher in women than men is not unique to Africans.
In the absence of either expert or consensus statements, the current practice of the International Diabetes Federation and AHA/NHLBI is to use WC thresholds determined in whites for sub-Saharan Africans. For women, IDF uses WC of 80 cm and AHA/NLBI use 88 cm. For African women, these WC thresholds may be too low and will lead to over diagnosis of IR and the unnecessary utilisation of scarce resources. For men, the International Diabetes Federation uses WC of 94 cm and AHA/NLBI use 102 cm. For African men, the International Diabetes Federation threshold of 94 cm may be reasonable. In contrast, the AHA/NHLBI threshold of 102 cm is too high and will lead to under diagnosis of IR and lost opportunity for early intervention.
Comparisons with data published in African-Americans
Depending on gender, there are both similarities and differences between Africans and African-Americans.31 From studies we conducted earlier, we found that the WC that predicts IR is different in African and African-American men.26 However, among women of African descent, the WC that predicts IR does not vary by African descent population.12
We have previously conducted two investigations that enrolled both African immigrant and African-American men.26 32 In the first study, we examined cardiometabolic health and found that African immigrant men had a higher rate of Abnl-GT at a lower BMI and WC than African-American men.32 This study suggests that the WC of risk is lower in African immigrants than African-Americans, but this issue was not directly evaluated.
In the second study, the WC that predicted IR was specifically studied.26 With IR measured by SI and VAT ascertained by CT scan, we found that the WC that predicted IR was 92 cm in African immigrant men and 102 cm in African-American men. The WC that predicted IR in was lower in African immigrant men than African-American men because at every level of WC, African immigrant men had more VAT and less SAT than African-American men.
For women of African descent, the finding that WC of 96 cm predicts IR may be universal. In a pooled analysis of white South African, black South African, African immigrant and African-American women, all of whom had VAT measured by CT, there was a difference by race in the relationship of WC to VAT.12 White women had more VAT at every level of WC than the black women. However, among the black women, there was no difference between the three groups of black women in the relationship of WC to VAT.12 Furthermore, Katzmarzyk et al performed abdominal CT in the participants of the Pennington Center Longitudinal Study and reported that the WC that best predicted IR in African-American women was 96 cm.33 Similarly in a study of African-Americans with IR determined by SI, the WC that optimally predicted IR in African-American women was 98 cm.34
WC versus BMI
Both cross-sectional and prospective studies of group of white people, Asians and Africans have found that as a predictor of risk for diabetes and heart disease, WC is equivalent or superior to BMI.35–37 Furthermore, WC is culturally acceptable and less costly to obtain than BMI. Measuring WC requires minimal training and only a non-stretch tape measure. In contrast, obtaining BMI requires two pieces of equipment both of which require calibration. This equipment is a scale placed on a level surface and a stadiometer mounted on a wall. In contrast to BMI, WC can be measured at virtually any indoor or outdoor event and most community gatherings. Furthermore, WC measurements are robust. In this study, WC was measured at two sites (ie, iliac crest and midway between the inferior rib and iliac crest), and the results, meaning the WC that predicted IR, varied by 1 cm or less.
Abnl-GT in the absence of IR
This investigation was designed to determine the relationship between WC and IR in Africans. However, in conducting this investigation, we discovered that 28% of men and 16% of women had Abnl-GT without IR. Presumably, the aetiology of Abnl-GT in this group is beta-cell failure. These individuals may be at higher risk for a type of diabetes known as ketosis-prone atypical diabetes. Other names for this type of diabetes include idiopathic type 1 diabetes, type 1B diabetes, tropical diabetes and malnutrition-associated diabetes.38 39 The aetiology of ketosis-prone atypical diabetes is uncertain but theories include epigenetic changes due to early life undernutrition, exposure to infectious agents such as human herpes virus 8, autoimmunity and primary genetic factors.38–41
Both the prevalence and natural history of asymptomatic individuals with Abnl-GT without IR are unknown. We were able to detect these individuals because we performed multisampled OGTT, which allowed us to measure both IR and estimate beta-cell secretion. We speculate that the individuals in group 4 may be experiencing the asymptomatic prodrome of ketosis-prone atypical diabetes. Going forward, it is important to design studies to prospectively determine the natural history of Africans with Abnl-GT and no IR.
Strengths and weaknesses
The participation of a group of African-born black people from countries spanning West, Central and East Africa is a strength of this study. Yet, we recognise that there was virtually no participation of Africans from South African countries. However, our results are consistent with publications from South Africa.14 16 18–20 Another strength is that to evaluate IR, we used both HOMA-IR and Matsuda index and in a subset of the men we had access to SI data. Plus we measured WC at two levels. In addition, we had opportunity to perform CT scans in African-born men and women and directly visualise VAT and SAT. Data from the CT studes provided critical insight into why the WC of risk is higher in African women than men.
The investigation has four weaknesses. Although this is the largest most intensive study of WC thresholds in an African population, the sample size is 375. Nonetheless, this sample size is large enough to change the dialogue, initiate debate and ultimately contribute to the formation of African-specific guidelines for WC. The second challenge is the cross-sectional design. A cross-sectional study can be used to identify the WC associated with IR in Africans but not the clinical consequences. Third, this investigation was designed to determine the association between IR and WC and not the cause of IR. Fourth, this study enrolled a group of African-born black people living in America rather than Africa. However, our study results were similar to studies conducted in Africa. Furthermore, multiple regression analyses revealed that the variable ‘years in the United States’ had no significant effect in either men or women on the relationship between IR, WC and VAT.
Conclusions
For preventing IR-related disease in Africans, the best way forward is to use African-centred thresholds for biomarkers such as WC. Working with a group of African-born black people living in America, we found that the optimal WC for the prediction of IR in Africans was 91 cm in men and 96 cm in women. Overall, our results validate earlier studies that were conducted in Africa and depended on less rigorous technology (table 1).13–20 Now may be the time to call for a systematic review of the literature and the development of a consensus statement, so current practice on the use WC to predict IR in Africans can be updated.
References
Footnotes
JDK and RLB are joint first authors.
JDK and RLB contributed equally.
Handling editor Seye Abimbola
Contributors JDK, RLB, RHE and AES did the literature search. ABC and AES designed the study. JDK, RLB, SMB, LSM, CWD, STC and AES contributed to enrolment. JDK, RLB, SMB, ABC, LSM, CWD, STC and AES collected the data. JDK, RLB, SMB, ABC, LSM, CWD, STC and AES analysed the data. JDK and AES made the figures. JDK, RLB and AES made the tables. JDK, RLB, SMB, ABC, LSM, CWD, STC, RHE and AES wrote the manuscript and JDK, RLB, SMB, ABC, LSM, CWD, STC, RHE and AES provided critical rewrites of the manuscript.
Funding The study was funded by the intramural research program of two NIH institutes: NIDDK, NIMHD and the NIH Clinical Center. JDK and AES are supported by the intramural programs of both NIDDK and NIMHD. RLB, SMB, CWB, LSM and STC are supported by the intramural programme of NIDDK. ABC is supported by the NIH Clinical Center.
Competing interests None declared.
Patient consent Not required.
Ethics approval NIDDK Institutional Review Board.
Provenance and peer review Not commissioned; externally peer reviewed.
Data sharing statement We do not refer to any unpublished data.