Article Text

Statistics from Altmetric.com
- child health
- indices of health and disease and standardisation of rates
- paediatrics
- community-based survey
- cross-sectional survey
Key questions
What is already known?
The United Nation’s fourth Sustainable Development Goal includes targets to improve access to quality early child care and preprimary education for young children.
The targets highlight increased need for indicators to monitor achievement, but few population-level measures have demonstrated clear compatibility of items across multiple contexts.
What are the new findings?
We meta-analysed data sets on 21 083 young children from 10 low/middle-income country (LMIC) settings containing 874 items from seven tools, and mapped items to create a 120-item prototype tool measuring motor, language and socioemotional skills.
Together the linked data from the seven tools demonstrate a curvilinear trajectory of child development, and remarkable coverage by age and consistency of measurement.
What do the new findings imply?
Applying novel and robust empirical methods we have created a first version of a culturally neutral, caregiver report tool that can be used to monitor children in the early most influential years across multiple LMIC settings.
Introduction
Over the past 30 years, the major effort of the Millennium Development Goal in reducing child mortality has been largely successful, demonstrating how possible it is to affect global change. Nevertheless, over 250 million children worldwide are still not reaching their developmental potential despite positive changes in the economies of many nations.1 2 As we move further into the 21st century, we need to move away from focus primarily on child survival to improving health and psychosocial well-being and the learning potential of children—particularly in the early years of life. Reducing poverty-based inequality is well reflected in the formulation of United Nations (UN) Sustainable Development Goals (SDG), with explicit inclusion of early child development as part of its fourth major goal.3 This SDG aims to ensure inclusive and equitable quality education and includes specific targets to improve access to quality early child care and preprimary education for children under 5. It is intended to be supported by indicators monitoring children’s achievement of healthy early development.
Adequate support of development when a child is very young can influence motor, language, cognitive, social, emotional and behavioural development, affect longer term health outcomes, and reduce health and socioeconomic inequalities.1–7 UN organisations, international funding agencies and governments are therefore actively promoting both preventive and interventional efforts in order to affect change. One major requirement from policymakers and stakeholders has been the need to create tools to measure indicators of early child development across cultures and settings to monitor developmental progression within and between countries.8 Reliable measurement of early childhood development is crucial in order to evaluate how effective these efforts are for children and families, and to establish which initiatives should be scaled up and for whom. This is needed most urgently for children under the age of 3 years, where interventions can have the largest effect.9
There has been long-term debate as to whether one can reliably compare developmental milestones across settings and cultures.10–12 There are few population-level child development measures with items which have demonstrated clear compatibility in attainment across multiple contexts across all domains of interest. For children 3–5 years of age, the Early Development Instrument13 and the Early Child Development Index included in Unicef’s Multiple Indicator Cluster Surveys14 are widely used, although either in limited numbers of countries, or with a limited number of items. Most tools measuring development in children aged 0–3 years have been created in high-income settings and are high-cost direct assessments,15–18 which are proprietary and require extensive training. They also contain items (and materials) which are unfamiliar to children in many cultures.10 Other caregiver report tools exist which are less expensive, require less training and are recommended for developmental surveillance.19 20 Some teams have created or adapted tools for use in specific low/middle-income countries (LMIC) with culture-specific items,11 particularly in social and language development.21–28 Most importantly there has been little consideration as to how these tools overlap and compare on a common global scale.15 19 21–26 We found only three initiatives: the WHO Gross Motor Milestones project,29 which has demonstrated compatibility of motor items across settings, a recent review showing compatibility of the Ages and Stages Questionnaires (ASQ) across cultures, countries and linguistic contexts,30 and the Guide for Monitoring Child Development showing compatibility across four different LMIC settings.31
In 2013, WHO commissioned a team at London School of Hygiene and Tropical Medicine (LSHTM) to lead the development of a conceptual framework for recommending a set of constructs and items that were considered to represent aspects of child development that could be measured universally. The work was presented during a WHO expert meeting and consensus was achieved. The conceptual elements were categorised into four developmental domains: cognitive, motor, language and socioemotional as shown in table 1.32 The key question, following on from this conceptual framework, was whether there are items that regardless of how and where they are asked, will identify the same developmental domains, across and between countries and cultures. If so, then a tool could be built around them and consistently used at the population level.
ECD conceptual elements by domain: ages 0–3 years
In this project, building on the previous work, we aimed to identify common items from existing developmental tools for children aged 0–3 years that have been used in LMIC settings, demonstrate good psychometric properties and have similar developmental trajectories across countries and settings, in order to create a new prototype tool for measuring early development across contexts. This paper describes the process of identifying this universal and robust set of items that comprised the first version of the WHO’s indicators of Infant and Young Child Development tool. The overarching objective was to synthesise empirical data from a collection of existing and validated tools that have been widely used to assess child development in LMIC settings. We hypothesised that our methodological approach would identify a robust set of items that reflected development in the first 3 years of life. We expected that there would be some variability between countries in terms of the average age at which an item might be attained, but that these differences might be explained by the country-specific context.
Methods
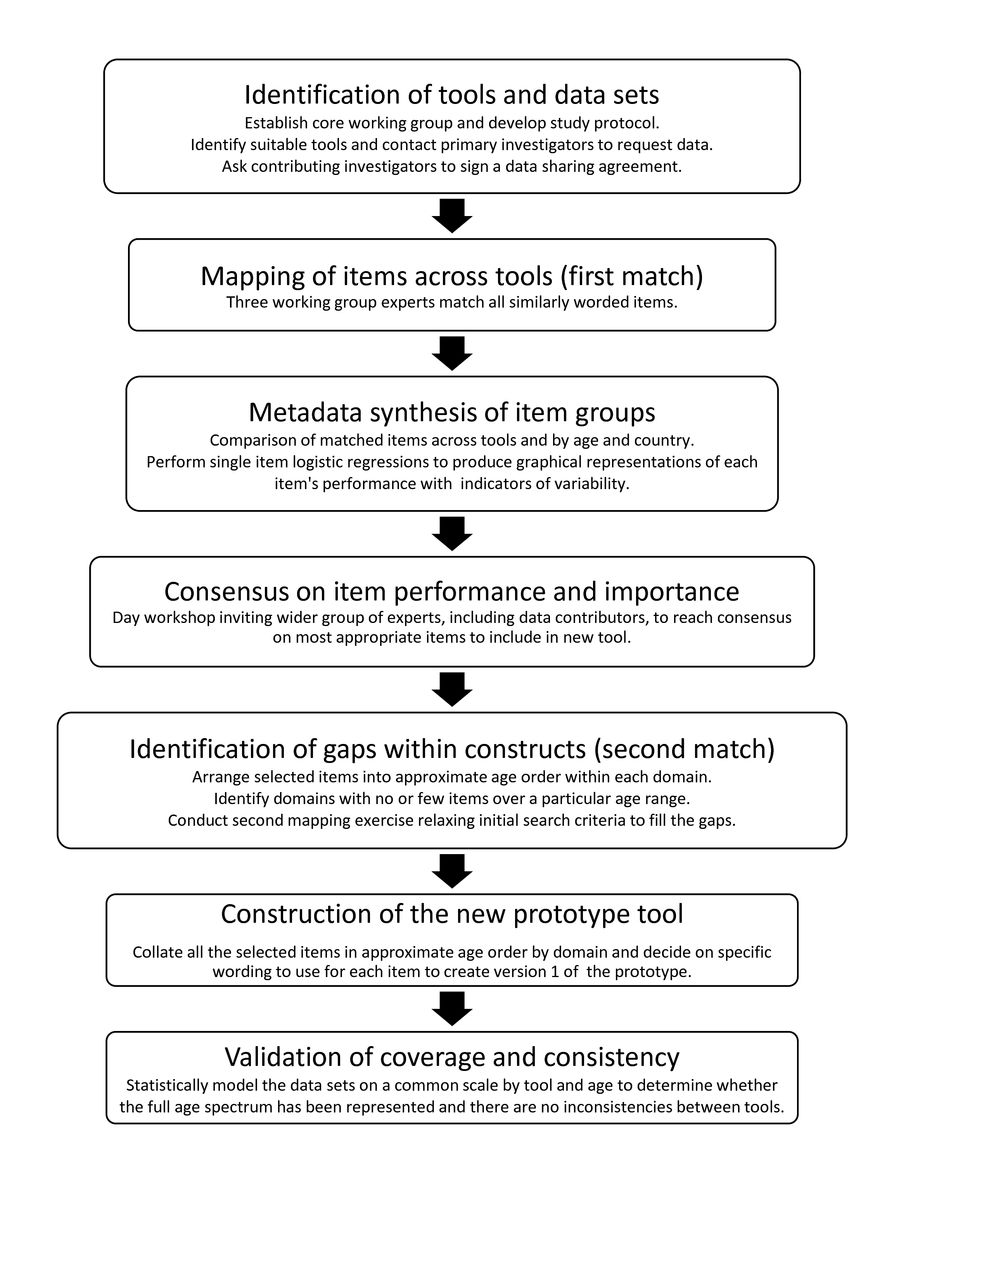
This study began in 2014 and consisted of seven key components described in the flow chart in figure 1.

Flow chart of study processes.
Identification of tools and data sets
Cross-sectional data sets originating from diverse settings in Latin America, Asia and Africa using tools that measured development in children 0–3 years of age were identified through a convenience sample of primary investigators identified in previous work or known to the research team.32 Candidate data sets were included if they met the following criteria: assessed over 300 children from 0 to 3 years; employed tools developed or used in at least one LMIC33; contained demographic information on children sampled and had reported good reliability, and face, content and construct validity for sites used. Data sets could contain items from one or more of the four key domains (cognitive, motor (divided into gross motor and fine motor), language and socioemotional skills). Investigators were asked to provide a manual or published evidence of reliability and validity of the items used to assemble their data set. This evidence was reviewed to ensure that the inclusion criteria had been met. Databases were received after the investigator had signed a data sharing agreement with the study team. To ensure protection of study participants, data were anonymised with all individual identifiers removed before transfer. Investigators confirmed in writing that any requirements by governing institutional review boards within contributing countries were met and that data could be shared for secondary analysis.
Mapping of items across tools (first match)
While all included data sets measured early child development, there was marked heterogeneity in age groups included, how various domains were measured, whether items were directly observed (by a trained assessor) or caregiver reported and in item wording. In order to identify similar items, a mapping exercise was carried out by three experts in child development (MG, PK, MJ) to identify which items from different instruments measured the same skill or concept in the same or a comparable manner. The assumption was that if the item was listed on more than one tool then it was more likely to be suitable for adoption or adaptation. To facilitate this, a square matrix of all items listed by row and column was produced in Excel for use in the matching process. Each expert independently matched items by placing a cross in the appropriate cell. The matrix was analysed by collating the candidate item groups according to the criterion of being matched by at least two out of the three experts.
Metadata synthesis of item groups
Each item had a pass/fail binary response. The test author’s exact wording or description for each item was retained in data analysis. A logistic regression model was used to represent the probability of passing each matched item in each data set to enable comparison of mapped item groups across tools and countries by age. Graphs of the fitted curves were produced as a visual aid with groups of items measuring the same skill overlaid on the same graph and labelled by country. These developmental trajectories were used to aid decision-making, and were interpreted based on the empirical data, the modelled probabilities for age at which a child in a particular country had a 50% chance of passing the item, and the width of the age range for which 10% and 90% of the children were passing the item.
Consensus on item performance and importance
A consensus workshop was organised in Geneva in April 2015 with working group members and principal investigators of projects that contributed data. Each workshop participant was given a booklet of grouped item graphs, and asked to judge (1) item performance (good, adequate, poor) across tools and countries based on similarity and overlap of developmental progression on the logistic curve, and (2) importance for inclusion (yes, no, maybe) in the new tool based on perceived coverage of a relevant domain of child development, no or little overlap with other items in that domain, potential to be asked as caregiver report, no specific materials required, and perceived understanding of item across countries. After final decisions, selected items were placed in approximate age order in a spreadsheet to determine whether coverage had been consistent across all domains.
Identification of gaps within constructs (second match)
A second matching process within available data sets was conducted in order to identify items which might potentially fit within gaps in the conceptual framework32 as we were aiming to ensure its full coverage (table 1). Additionally two further data sets from one study had become available from Bangladesh, and these were added to the analysis. A new matrix of potential items was constructed as before. Rules for matching were ‘loosened’ (in that item wording did not have to be so exact or similar) to identify more items that might measure a similar construct with different wording or questions. As well, single items – those that were not necessarily present in more than one tool, were allowed, if they showed developmental trajectories. A new booklet of graphs was produced and a similar consensus process was conducted virtually.
Construction of the new prototype tool
The new prototype tool was designed to be based on a caregiver report for feasibility of administration in the field. Items chosen through the two-stage mapping and consensus were arranged in ascending order of age at which 50% of children were passing to create a first version of the prototype tool. Each domain was labelled according to the predefined constructs of gross motor, fine motor, language and socioemotional skills. As cognitive items were not equally distributed across the age range, we inserted them either into the language or fine motor domains, depending on where they best fit conceptually. One expert created the first draft of the prototype selecting or producing appropriate wording for administration by caregiver report. Any items originating as directly observed would be tested for suitability as caregiver report in future piloting of the tool. The wording and age ordering were then reviewed by the working group and any anomalies resolved by discussion. The prototype contained instructions and probes on how to administer items to the caregivers to overcome any confusion with the questions, particularly those that had been adapted from a directly observed tool.
Validation of coverage and consistency
In order to determine how well the contributed data sets (and tools) provided consistent assessment and coverage of child development across the age spectrum of 0–3 years, we carried out a metadata analysis of the combined data sets. Since the data sets used in this research came from a range of tools applied to different age groups of children sampled from multiple countries, we needed to adapt current test linking procedures that require all tools to be used on the same group of children.34 Therefore, in order to provide the necessary ‘anchoring’ of common items between tools, 10 sets of items that were judged to perform very similarly across countries and that had been shown, in the main analyses, to operate similarly to each other with respect to child’s age were selected and constrained to be of equal difficulty. An item response theory (IRT) statistical model was constructed to link tools onto the same scale and fitted using the Stan package35 (see online supplementary file 1). The probabilities of passing from the model were plotted to determine coverage by age.
Supplemental material
Results
Investigators provided 14 eligible data sets totalling 21 083 children from 10 countries on four continents: Central and South America (Costa Rica, Nicaragua, Paraguay, Peru), Asia (Bangladesh, India, Indonesia) and Africa (Kenya, Malawi, Tanzania). Seven different tools were used including the ASQ,19 36 37 Bayley Scales of Infant Development III (BSID III),15 the Developmental Milestones Checklist (DMC),38 Kilifi Developmental Inventory (KDI),24 Malawi Developmental Assessment Tool (MDAT),21 Regional Project on Child Development Indicators (PRIDI, now known as Engle Scale for Child Development)25 39 and the Saving Brains Early Childhood Development Scale (SBECDS, now known as the Caregiver Reported Early Development Index).26 Data provided from Bangladesh using the Rapid Neurodevelopmental Assessment tool27 and the Developmental Screening Questionnaire23 were not included because of data compatibility issues. Each investigator provided information about their tools, the number of children assessed in each country and any additional contextual data collected. Figure 2 displays the distribution of participants by tool and country for the data sets provided, some containing children up to 5 years. A summary of the eligible data sets (table 2) highlighted several characteristics; first that authors were in broad agreement as to the important domains of development, which aligned with the review findings; second that where specified, sampled children came from diverse socioeconomic backgrounds with the highest proportions classified as ‘normal’ by height for age z-score (HAZ) and weight for age z-score (WAZ); and third, most mothers had been educated to at least primary level (see table 2).

Number of participants by (A) age group* and tool, and (B) age group and country. ASQ, Ages and Stages Questionnaires; DMC, Developmental Milestones Checklist; KDI, Kilifi Developmental Inventory; MDAT, Malawi Developmental Assessment Tool; PRIDI, Regional Project on Child Development Indicators; SBECDS, Saving Brains Early Childhood Development Scale.
Summary characteristics of contributed tools and data sets
Overall, 789 individual items from the seven tools were included in the mapping exercise (first match); 106 from the ASQ, 61 from the BSID III cognitive domain, 180 from BSID III non-cognitive domain (cross-matching of cognitive and non-cognitive domains was allowed), 66 from the DMC, 85 from the KDI, 158 from the MDAT (included 22 extra items from the author), 63 from the PRIDI and 70 from the SBECDS. A 789×789 item matrix was created, and to avoid duplication the lower diagonal only was used by the experts. Using selection criteria of agreement between two out of three assessors a total of 136 item groups (129 after combining very similar groupings) comprising 344 items were selected for inclusion in the statistical analysis, leaving 445 not included. No matches were made for a total of 263 664 item pairs across all data sets.
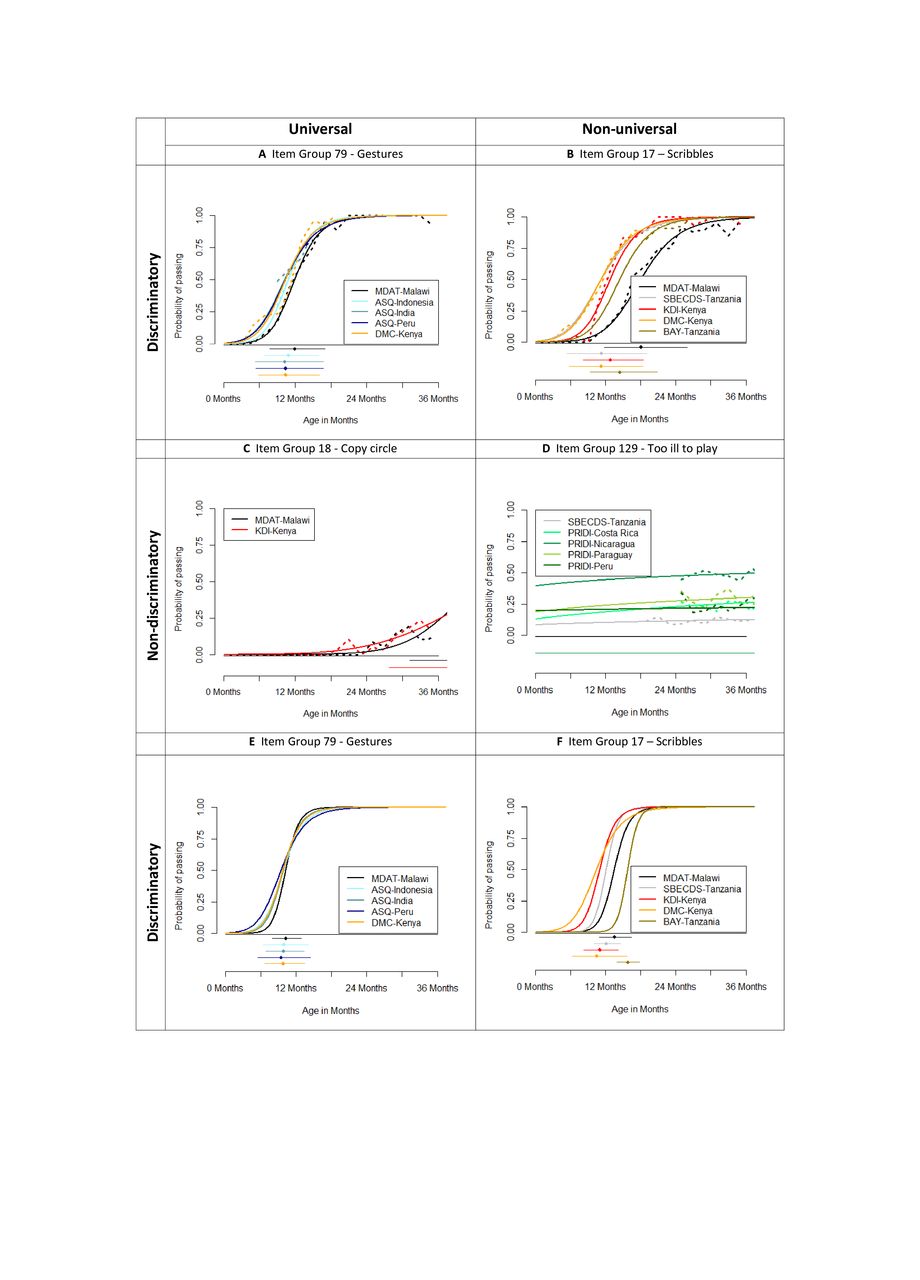
Table 3 shows different wording of items for four examples of item groups and figure 3 shows a visual example of the logistic curves for the same four groups. The examples demonstrate the very different levels of discrimination (slopes) and universality (similar performance across countries) between items. Graphs (A) and (B) show items which have sufficient levels of discrimination, but while items on graph (A) perform similarly across countries, items on graph (B) do not as the curves are quite separated indicating different ages of attainment for example for a probability of passing of 50%. Similarly, items on graph (C) show sufficient universality but items on graphs (C) and (D) have very poor discrimination. Graph (A) shows an ideal item group (for the item ‘gestures’), where all items from all tools in all countries discriminate well with age, with 10% of children being able to do this skill at about 6 months and 90% at about 16 months. If a child aged 7 months could demonstrate this skill, then they would be considered advanced for their age. But if a child aged 18 months could not demonstrate this skill, then they would be considered delayed in their development of this skill. In contrast, the item in graph (D) (‘too ill to play’) is a very poor developmental item; given that child development is age dependent, it does not vary with age and therefore shows little about the child’s development. Graphs (E) and (F) are discussed below and in figure 3.
Examples of different item wordings for four item groups

(A–D) Logistic curves for example of item groups showing varying levels of universality and discrimination with age. (E, F) Item response theory (IRT) curves from fitted models for same two discriminatory item groups. Graphs (A)–(D) show the (grouped by age) empirical responses as dashed lines and the logistic curves fit to the empirical data as solid lines. Graphs (E) and (F) show the fitted curves from the IRT model. All graphs show the ages at which 10% (lower limit), 50% (diamond) and 90% (upper limit) of children pass the item for each item group.
At the consensus workshop the 129 item groups (online supplementary file 2) were reviewed and each graph discussed, to reach consensus on item inclusion or exclusion, irrespective of choice of wording. In most cases, it was agreed that items that did not perform consistently well across countries should be excluded from the new tool. The expert participants therefore identified 70 candidate item groups for inclusion. A few specific items were considered important milestones by the experts and were included as long as they performed well in at least one or two countries. While the analyses and consensus discussions revealed considerable agreement among experts, it was acknowledged that some conceptual areas identified in the initial review were either under-represented or not represented at all. For example, an item about emotional regulation such as ‘does your child have difficulty taking turns when playing with others?’ was not found but felt to be important. Many of the items/skills deemed important and which showed acceptable developmental progression across instruments and countries had been administered originally on tools through direct assessment. The feasibility of reframing these items into caregiver reported items would therefore need to be considered when testing the prototype. Expert participants at the consensus workshop also recommended that the applicability of all items should be evaluated at the next stage and it was stressed that all items must be practical for use in large surveys, with an emphasis on feasibility testing. Finally, the consensus participants also pointed out that potential candidate items for measurement of environmental factors known to contribute to child development should also be collected during piloting.
Supplemental material
In the second match, two additional data sets36 added a further 85 BSID III items pertinent to younger children and ASQ data for Bangladesh. Out of a total 874 items across all domains, 597 further potential items were selected to fill identified gaps. At this stage, the five domain constructs were retained and a second booklet of graphs constructed comprising 413 ‘looser’ item groupings. For example, grouping 51 included ‘Identifies 2 objects in a box’ (MDAT), ‘Identifies object in the environment’ (BSID III), ‘Identifies object series: 1 correct/3 correct’ (BSID III) and ‘Names pictures’ (ASQ). To create consensus about these additional items, a virtual meeting was held to discuss each item grouping. At this stage, a second redrafting of the tool was made to create a first version of the prototype tool, comprising 120 items (23 fine motor, 23 gross motor, 20 receptive language, 24 expressive language, 30 socioemotional) (see online supplementary file 3). Due to the different wording and target numbers required in some items across the different tools, for example (see online supplementary file 2, p 118), ‘Does the child say five or more words?’ (SBECDS), “Does your child say 4 or more words in addition to ‘Mama’ or ‘Dada’?” (ASQ) (and similarly for identifying number of body parts and stacked objects), five additional items (see online supplementary file 3), which enabled caregivers to provide variable numeric answers, were added to the end of the prototype, to allow the maximum number that a child could achieve to be observed during piloting to help in deciding the maximum target and best age at which to place these items in the tool.
Supplemental material
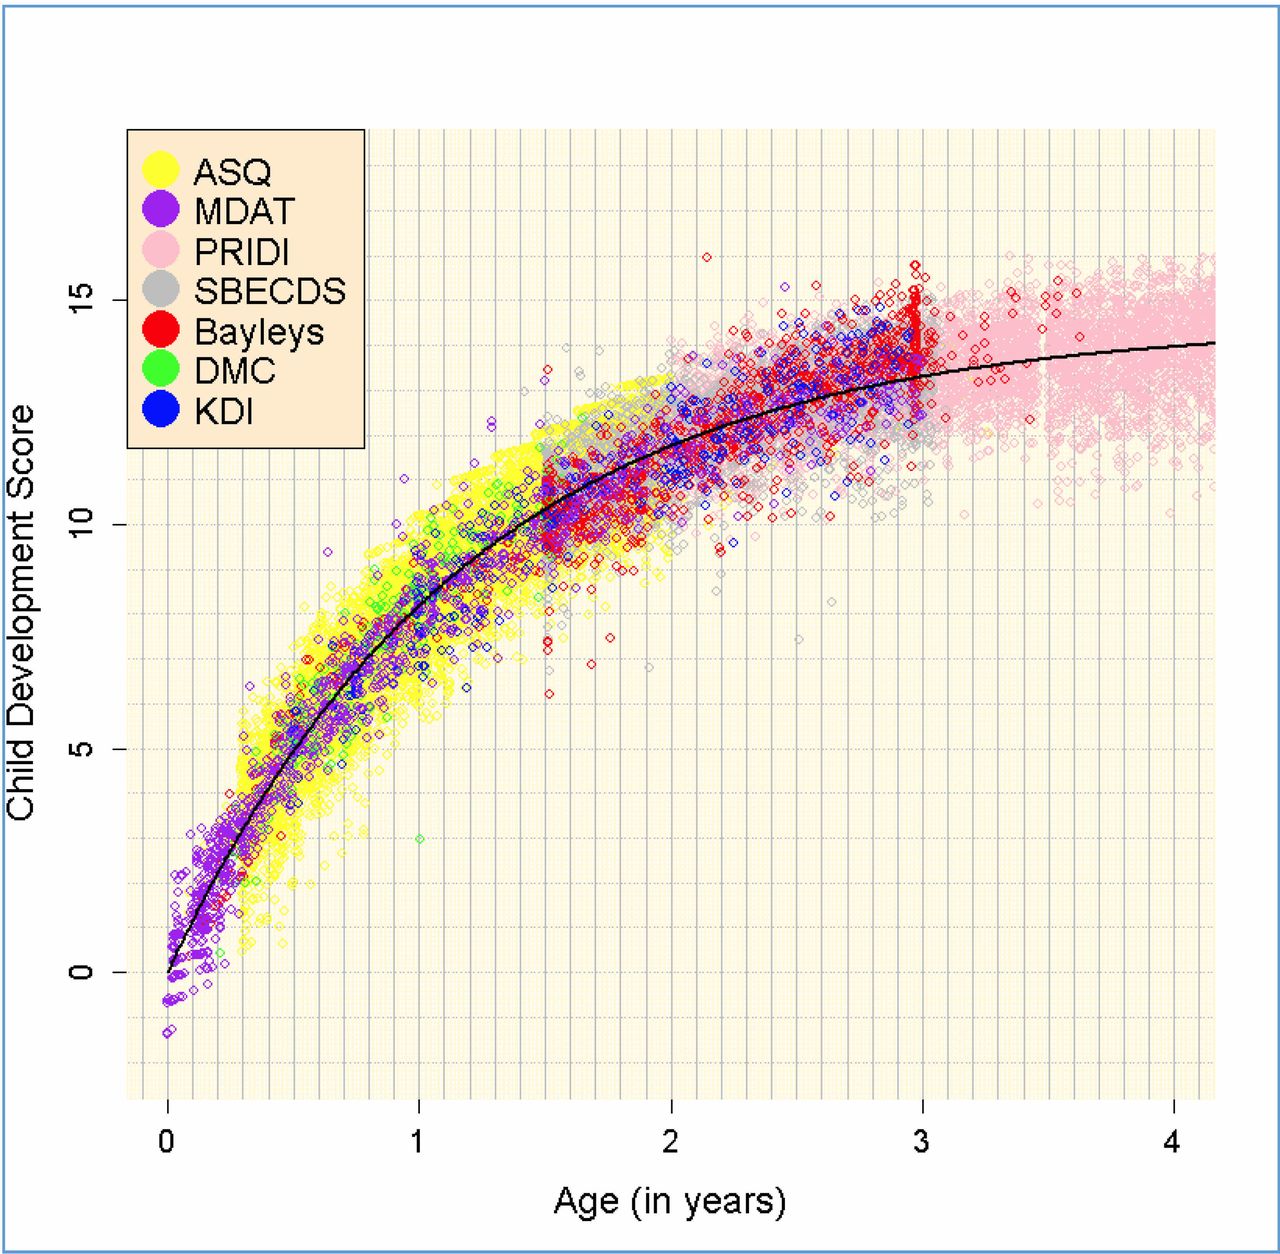
Figure 4 shows a visual representation of the linking of data sets onto a single common scale through the IRT statistical modelling process. The y axis ‘child development score’ shows the developmental ability of the children, which is the latent ‘ability’ parameter (or score) estimated from the IRT model using the data from all the items in all the data sets. The figure displays a curvilinear relationship between development and age with more rapid development occurring in the first year of life, and then a slowing down in the subsequent years. The graph illustrates the excellent coverage across all ages and domains of the different contributed data sets as well as consistency of measurement between different tools. It shows that no matter which country or tool the data come from, each study’s child development scores lie on the same overarching curve representing child development from 0 to 3 years. Figure 3E, F provides two examples of item characteristic curves from the IRT model to contrast with those in figure 3A, B produced using logistic regression. The slopes are marginally steeper using IRT but show very similar results in item performance overall, thus justifying our simpler item by item graphical approach in the initial stages for gaining consensus. We can see that the IRT model has corrected for differing ability levels seen in the different data sets because they contain samples of children of varied age ranges. This correction could be done more crudely in the logistic regression models using additional covariates.

Plot of developmental ability by age (years) and by tool. ASQ, Ages and Stages Questionnaires; DMC, Developmental Milestones Checklist; KDI, Kilifi Developmental Inventory; MDAT, Malawi Developmental Assessment Tool; PRIDI, Regional Project on Child Development Indicators; SBECDS, Saving Brains Early Childhood Development Scale.
Discussion
The purpose of the WHO Child Development Indicators Project was to examine items potentially suitable for assessing child development at population level for 0–3 years. We identified items within well-validated developmental assessment tools which worked best in context. As a result we have constructed a first version of a prototype tool for assessment of indicators of child development using a theoretically driven and empirically based methodology on data from over 21 000 children assessed across 10 countries. Items were selected from a metadata synthesis of seven existing tools for which 14 data sets were provided by the original study authors. The majority of items in the new tool are those that demonstrated excellent performance across countries and tools. Through our approach, we have clearly shown that there are items which have very similar developmental trajectories and age of attainment when used in different validated tools across a number of different countries and sites. This was to be expected and more common with motor items, but we have also demonstrated this for a number of language, cognitive and socioemotional items. Most markedly, despite the differences between tools, the items, the wordings used, the country locations and the types of data sets, the items in the data sets together show remarkable overall coverage and consistency of measurement across the age range. The data points all lie on the same developmental trajectory, indicating cohesion across tools in the underlying construct that is being measured. This was demonstrated by an IRT model (figure 4) and is a novel finding that has not been illustrated in this way before.
All tools had good evidence of validity and reliability and most had been identified by the LSHTM review of the literature (and the World Bank Toolkit) as being reliable and valid. This was demonstrated to us either by citation of the relevant paper (table 2) or in the case of the SBECDS by producing evidence of this (now published).26 Initially, items which assessed cognitive functioning were considered separately as a domain when reviewing tools and items. In our consensus meeting, we ensured that there were enough items which spanned all areas of cognitive functioning for children aged 0–3 years as determined by the conceptual framework. Once this was established, we decided to simplify the tool and place these items in one or other of the domains of the present tool. Developmentally, there are few items between the ages of 0 and 3 years which solely assess cognitive functioning. This was seen within our matched groups of items where some of the items appeared in personal-social, cognitive, language or fine motor subscales (table 2).
Where items performed well in some but not other countries, we reviewed the wording of the item as well as its mode of administration (whether the item had been caregiver reported or directly assessed). It was apparent in some cases that the wording of the item was not specific enough (rather than it being an issue with cultural appropriateness) and that this accounted for the variable responses across countries. Subject matter specialists from the wider consensus group reviewed these milestones carefully and if it was clear that the item fell in the conceptual framework of domains of development and there was no other item covering this skill at the same age, then it was considered ‘important’. We took advantage of the opportunity to include them in the resulting list of items described in this paper knowing that they would be further tested in our subsequent studies. While the items are separated into theoretical domains to ensure content validity, when we have data available on the specific item wordings used in the new tool, we will assess the possibility of establishing empirically justified domains. Based on our experience it is likely that a few items will need to be minimally adapted for country-specific use in terms of slight amendment of the example or the prompt. However, we do not envisage major adaptation of items since their inclusion was based on such an extensive review, nor do we recommend major adaptation as this would alter the properties of the tool.
Our goal was to create a tool to measure child development at the population level and therefore we would not stipulate that it be used for individual-level direct assessment. It may be used in conjunction with other tools that measure direct observations at the individual level; however, our tool is there to give an indicator of development of milestones across a population, whether for monitoring purposes or as an outcome in intervention studies. Many item groups included both caregiver report and directly administered items that seemed to perform fairly consistently. While it is true that caregiver reporting can incorporate bias, it is also true that children aged 0–3 years are difficult to test, and may not perform when asked to do so. We will be making further comparisons of caregiver versus direct assessment in a future study.
Regardless of whether we are devising a new tool or revising an existing one, a proper rigorous empirical approach is required. The principal developmental study domains and items were informed by the conceptual framework (table 1) derived by a group of experts led by WHO and LSHTM. The added value of our process ensured that we checked between a number of tools, that there were no other items that could have or should have been included in a universally applicable tool. In this age range, our guiding framework and selection across tools (some widely used, some developed within a particular country) and samples cast a wide net to capture those items that seem to measure something in common and also identify items with strong cultural bias. We found that nearly all tests had at least a core set of items in common that appear to have been selected for their importance in child development and their capacity to be effective measures of some specific domain. If we had included multiple frameworks, we would likely not have reached agreement across items, or if we used a framework emphasising the need for culture-specific tools, then that would have been at odds with the goal of creating a universal tool that has items deemed to be important indicators (according to literature review) of developmental status.
Strengths and limitations
We consider having data from 10 countries across four continents to be a strength of this study, but this could also be viewed as a limitation. The implications are that the included items do need further testing in other countries to ensure that they are clearly understood and to identify items, if any, where some country-specific adaptation may be necessary. The studies from which the data were sampled represented a good cross section of the LMIC population, the majority using either quota or stratified random sampling of children from urban and rural settings. Most mothers were educated to at least primary level (range 28%–88%), the least educated coming from Kenya,38 India37 and Latin America,25 and the majority of children in each sample were classified as ‘normal’ by HAZ (56%–91%) and WAZ (57%–92%). Several studies were substudies of larger cohort studies (eg, World Bank’s Water and Sanitation Program Global Scaling Up Initiatives25) or clinical trials.21 26
Our cross-country comparisons highlight how certain milestones are attained at different ages in different countries. This is particularly pertinent to the social and language domains and suggests that context may play an important role in understanding the interplay between culture and child performance. Measurement of contextual factors (eg, household support for learning and development, nutritional indices and wealth) should therefore go hand in hand with child developmental assessment so that any country-specific differences can be explained. Integrating contextual factors into existing data collection platforms that collect developmental data will also ensure the political agenda is better informed when listing priorities. These are considerations that we will take forward to the next stage of piloting the prototype in the field in several LMIC settings.
A key feature of our work as set out by the WHO remit was to create a caregiver report for use by multiple countries in measuring early child development. The cost and time required to directly observe children makes it particularly prohibitive in some country locations and for this reason a caregiver report was required. We realise that this may be a limitation and the next part of our research programme will address the extent to which directly assessed items can be made into caregiver reported items. The advantage of caregiver report over direct assessment is its cost-effectiveness and its non-reliance on the availability of developmental experts for delivery. We have set out to show that it is possible to develop a caregiver report that performs well and this will be investigated in our future work. While our tool comprises 120 items, not all items will be administered to all children; items are age ordered into overlapping age groups.
We have demonstrated that it is possible to take a standardised measurement approach for children aged up to 3 years in order to propose a set of indicators for an assessment tool based on comprehensive statistical analyses of existing databases. The graphical analysis of item performance enabled cross-country comparisons to be made in order to select the most appropriate items by consensus agreement of experts in the field. In utilising logistic regression models to plot the probability of passing an item by age, and overlaying items that were addressing similar skills in matched item groups, we created a straightforward methodology for making value judgements across countries. This was an extension of a previous approach10 21 and is an easy to use methodology that the consensus meeting participants understood and found helpful in making their decisions.
We also fitted a generalisation of the logistic models using IRT with an integrated exponential decay function, in effect modelling all items together across countries. This novel approach allowed us to model the underlying ‘development’ of the children across all items and domains, in order to see how each individual tool and data set contributed to the overall picture. The resulting graph showed remarkable cohesion across tools with a trajectory that followed the expected developmental progress of children aged 0–3 years, with a steeper trajectory of initial development in the first 12 months of life slowing down as they get older. This highlights that each tool is measuring early child development in the way we would expect in the subgroup of children to which it has been applied, and that this consistency is shown to extend across countries. The tools and data sets that we have used therefore validate our approach in terms of coverage and consistency of measurement and with respect to the items we have assessed and compared.
Item group 17 (‘scribbles’, figure 3B) is an interesting example because it was not working consistently across countries in either modelling approach. There are three reasons why these items may be operating differently: (1) the items are subtly but meaningfully different, (2) the behaviour is not typical for children in one country compared with another until they are older, or (3) the children in one country are more advanced in development per age than those from other countries. Since the IRT model takes care of the latter point and the wording does not seem inappropriate then in this case the most likely reason is the second, indicating that in some countries children may not be privy to drawing materials until older, which we have subsequently found to be the case. This highlights the importance of consulting with country experts when conducting these kinds of analyses.
Conclusion
We have demonstrated that there are early childhood development items that can work consistently well across tools and across LMIC settings. Even though we have created a set of items that has high potential to be a reliable global tool, a number of issues need to be considered before the prototype tool can be recommended for global measurement. This includes identifying whether it has good discriminatory validity and whether the tool as a whole is feasible and reliable to use by caregiver report. These issues will be addressed in the next stage of feasibility testing and piloting the tool. Discriminatory validation will be examined through the use of contextual information (eg, nutritional status, family care indicators, maternal education, maternal socioeconomic status) in our next stage of work. Future testing will be needed to establish how well the tool identifies children with broad developmental problems. A separate set of studies will need to examine the tool’s discriminatory validity using gold standard diagnoses for children with specific developmental disorders. Currently, the tool’s use is meant for population-level monitoring and not for screening or individual diagnostic assessment; therefore, for example, it is to identify poorer development in groups of children with nutritional or socioeconomic difficulties.
Acknowledgments
We thank Naila Khan and Aimee Verdisco for contributing data sets to this project, and Abbie Raikes for participation in the consensus workshop.
References
Footnotes
MG and MJ contributed equally.
Handling editor Seye Abimbola
Contributors GAL, MG, MJ, PK and TD planned and designed the study, with assistance throughout from GMC and JC, and comprise the core working group. PK, MJ and MG carried out the mapping exercises. GM conducted the statistical analysis with contribution from GAL and AT. MG, PK, DMC, GF, AA, JDH and FT contributed data sets. AA, AT, DMC, GAL, GMC, JC, JDH, MG, MJ, PK and TD participated in the consensus workshop. GAL wrote the first draft. All authors contributed to the critical revision of the manuscript and approved the final draft.
Funding This work was funded by the Grand Challenges Canada and the Bernard van Leer Foundation as an agency grant to the World Health Organization.
Competing interests GAL, GMC, AT, PK, MG, MJ, JC and TD were funded by an agency grant to WHO from Grand Challenges Canada and Bernard van Leer Foundation.
Patient consent Not required.
Ethics approval Ethical approval was given at each site for the original studies. Approval was also obtained from the ethics committee of the WHO in Geneva. Data were anonymised with all individual identifiers removed before transfer. Investigators confirmed in writing that any requirements by governing institutional review boards within contributing countries were met and that data could be shared for secondary analysis.
Provenance and peer review Not commissioned; externally peer reviewed.
Data sharing statement The ASQ data sets for India, Indonesia and Peru are available from the World Bank Water Sanitation Impact Evaluations at: http://microdata.worldbank.org/index.php/catalog/1554/data_dictionary#page=F2&tab=data-dictionary http://microdata.worldbank.org/index.php/catalog/1555/data_dictionary#page=F2&tab=data-dictionary http://microdata.worldbank.org/index.php/catalog/2033/data_dictionary#page=F3&tab=data-dictionary. We had approval to access all data we used for the purposes of this study. The PRIDI data are publicly available at: http://www.iadb.org/en/topics/education/initiative-pridi/about,20396.html. Secondary use of all other contributed data sets should be requested from the original site-specific chief investigators.