Article Text

Abstract
Introduction Despite an estimated one-third of the global burden of disease being surgical, only limited estimates of accessibility to surgical treatment in sub-Saharan Africa exist and these remain spatially undefined. Geographical metrics of access to major hospitals were estimated based on travel time. Estimates were then used to assess need for surgery at country level.
Methods Major district and regional hospitals were assumed to have capability to perform bellwether procedures. Geographical locations of hospitals in relation to the population in the 47 sub-Saharan countries were combined with spatial ancillary data on roads, elevation, land use or land cover to estimate travel-time metrics of 30 min, 1 hour and 2 hours. Hospital catchment was defined as population residing in areas less than 2 hours of travel time to the next major hospital. Travel-time metrics were combined with fine-scale population maps to define burden of surgery at hospital catchment level.
Results Overall, the majority of the population (92.5%) in sub-Saharan Africa reside in areas within 2 hours of a major hospital catchment defined based on spatially defined travel times. The burden of surgery in all-age population was 257.8 million to 294.7 million people and was highest in high-population density countries and lowest in sparsely populated or smaller countries. The estimated burden in children <15 years was 115.3 million to 131.8 million and had similar spatial distribution to the all-age pattern.
Conclusion The study provides an assessment of accessibility and burden of surgical disease in sub-Saharan Africa. Yet given the optimistic assumption of adequare surgical capability of major hospitals, the true burden of surgical disease is expected to be much greater. In-depth health facility assessments are needed to define infrastructure, personnel and medicine supply for delivering timely and safe affordable surgery to further inform the analysis.
- spatial modelling
- geospatial analysis
- catchment population
- global surgery
- universal health coverage
- sub-Saharn Africa
This is an open access article distributed in accordance with the Creative Commons Attribution Non Commercial (CC BY-NC 4.0) license, which permits others to distribute, remix, adapt, build upon this work non-commercially, and license their derivative works on different terms, provided the original work is properly cited, appropriate credit is given, any changes made indicated, and the use is non-commercial. See: http://creativecommons.org/licenses/by-nc/4.0/.
Statistics from Altmetric.com
- spatial modelling
- geospatial analysis
- catchment population
- global surgery
- universal health coverage
- sub-Saharn Africa
Key questions
What is already known?
An estimated 5 billion people do not have access to basic, safe surgical care.
The proportion of the population that can access, within 2 hours, a health facility with capacity to perform caesarean delivery, laparotomy and treatment of open fracture (the bellwether procedures) is unknown in sub-Saharan Africa.
What are the new findings?
The majority of the population in sub-Saharan Africa resided in areas within 2 hours of a major hospital that could theoretically carry out the bellwether procedures.
The estimated need for surgery in sub-Saharan Africa lies between 257.8 million and 294.7 million people.
The estimated burden in children under 15 years was 115.3 million to 131.8 million and had similar spatial distribution to the all-age pattern.
What do the new findings imply?
Sub-Saharan countries need to overcome barriers of access to safe surgery to reduce negative outcomes such as deaths.
Introduction
In the report ‘Global Surgery 2030: Evidence and Solutions for Achieving Health, Welfare, and Economic Development’, the Lancet Commission on Global Surgery (LCoGS) highlighted that 5 billion people globally do not have access to safe, affordable surgical and anaesthesia care.1 It is estimated that approximately one-third of the global burden of disease constitutes surgical disease.2 3 Surgical disease encompasses any illness where outcomes can be improved through surgical care.1 4 Inequality in surgical care is distinctive; of the 313 million estimated global surgical procedures undertaken each year, only 6% were estimated to occur in low/middle-income countries (LMICs).5 This disparity is, however, contributed by lack of quantity and quality data on surgery in these countries. Untreated, many surgical conditions are a source of lifetime disability and can cause premature mortality estimated at 16.9 million in 2010.6–8
For a long time, surgery has not been included in the discussion on how to improve global healthcare and strengthen health systems, especially in the most remote regions of the world. Only in 2008 did surgery become the focus of attention when it was called the ‘forgotten stepchild of global health’. Today, there is an increasing awareness to include surgical care as part of a wider strategy for improving universal healthcare delivery globally.8–11 Systematic reviews suggest that surgery is as cost-effective in LMICs as other health interventions, for example, oral rehydration therapy, vitamin A supplementation or antiretroviral therapy promotion.12 13
Physical accessibility, including distance to hospitals, availability and cost of transportation; poor state of roads and infrastructure as well as geographic conditions, are important factors that determine whether a patient seeks care and health outcomes in these settings.1 In 2015, the Lancet Commission1 recommended measuring access to timely surgical care (indicator 1 on percentage of population within 2 hours of access) as part of six indicators that measure a healthcare system’s ability to provide safe surgery. The other five indicators include: the number of specialist surgical providers (surgeons, anaesthetists and obstetricians) per 1 00 000 population, the number of surgical procedures per 1 00 000 population, perioperative mortality rates, risk of impoverishing expenditure when surgery is required, and risk of catastrophic expenditure when surgery is required.
There have been a few studies that assessed these indicators since 2015, when the Lancet commission report was released. An attempt has been made to define global estimates on surgeons, anaesthesiologists and obstetricians14 15; surgical volumes4 16; financial burden on surgery17; and perioperative mortality.18 19 While there are major gaps in surgical access across sub-Saharan Africa (SSA), understanding these gaps would support global and country-level decision-makers to plan and programme for improvements. Regarding indicator 1, Alkire et al’s study20 used country-level data to measure timeliness based on the proportion of serious injuries transported by an ambulance. Provision of ambulatory and emergency services is low in SSA.21 22
Further, data on hospital capacity to perform surgery in SSA are not always available without an independent facility assessment at country level. For example, Esquivel et al mapped access to safe, timely and essential surgical care in Zambia23 and estimated that 15% of the population lived in areas that were outside of the 2-hour threshold of distance to a hospital with surgical capacity, regardless of its human resource capacity or infrastructure. Another assessment showed that only 34% of the population was within 2 hours of a hospital with capacity to perform safe surgery while adhering to guidelines by the WHO.24 Barriers to accessibility to surgical services have been predicated based on several factors, including geographic proximity, cost and safety.20 There has been evidence that greater physical distance or travel time (eg, >1 hour) impacts health outcomes before and after surgery.25 26
The recent publications of hospital locations in relation to emergency care25 27 provide a platform for assessing indicator 1 from the Lancet commission for countries in SSA. The aim was to provide first-stage estimates of indicator 1 by measuring access to major hospitals for all of SSA based on these hospital locations. This objective has been undertaken in the present study in 47 countries. The secondary objectives were to assess the population dropout rate at 30 min and 1 hour of a hospital as well to estimate the need for surgery in children under the age of 14 based on estimated catchment populations.
Methods
Health facilities/hospitals’ data
In an effort to understand distribution and provision of emergency services in SSA, an inventory of public hospitals was conducted elsewhere, and data on their locations are now available publicly.28 These data29 were assembled mainly from national governments (ministries of health and statistical agencies), regional WHO websites, Demographic and Health Survey (DHS) Service Provisional Assessment (SPA), United Nations Office for Humanitarian Country Assistance data exchange portal (https://data.humdata.org/group) and other publicly available lists from international organisations such as the Unicef. From this list we compiled a dataset of major regional and district-level hospitals (n=4900) to conduct a first-stage estimate of indicator 1 by measuring access to major hospitals for all of SSA.28 An underlying assumption of the present study is that these major regional and district hospitals can provide all three basic surgical procedures, that is, bellwether procedures (laparotomy, caesarean section and treatment of an open fracture).16 23 30 Only a baseline assessment of all hospitals in a given country using, for example, the WHO surgical assessment toolkit31 would provide the detail needed to validate this assumption.
The majority of the hospitals assessed in the study were managed by local governments (86%) independently, while the remaining 14% were managed by non-governmental organisations or faith-based institutions. The listing excluded private-for-profit facilities or specialised hospitals, which may provide basic surgical care but were difficult to audit at a national level. Just over half (54%) of these hospitals were georeferenced using global positioning system (GPS) receivers. For those that had not been georeferenced, coordinates were derived by address geocoding of place names from web-based geodatabases and Google Earth.32 Online supplementary figure S1 shows sub-Saharan hospital locations.
Supplementary file 1
Spatial ancillary data and population
A spatial dataset of roads in SSA was assembled from OpenStreetMap (OSM, 2017). In this analysis, only roads classified as a motorway, primary or secondary were included. To allow for a consistent comparison, we excluded lower-tier roads (tertiary roads, streets, link roads and footpaths) due to uncertainty of their completeness across countries. Motorised transport was, therefore, used in the analysis of travel times along the major roads.
A land cover map from Medium Resolution Imaging Spectrometer GlobCover product (http://ionia1.esrin.esa.int/)33 at a 300 m spatial resolution for SSA was used to demarcate all other topographical characteristics (ie, the land use or land cover classifications). Digital elevation data (topography) was downloaded from the National Aeronautics and Space Administration’s Shuttle Radar Topography Mission (SRTM) (https://www2.jpl.nasa.gov/srtm/). SRTM has a spatial resolution of 90 m approximately at the equator and is archived using 5° by 5° tiles.
Lastly, age-structured maps of population distribution were downloaded from WorldPop (www.worldpop.org)34 including 2015 estimates of all-age population and children under the age of 15 years. The methodology for modelling population is described elsewhere35 and combines data from various population and housing censuses and human settlements using machine learning approaches to generate a gridded prediction of population density at 100 m spatial resolution approximately.35 For this analysis, the population data and all raster layers were resampled to a spatial resolution of 1 km by 1 km.
Developing gridded layers of travel times to hospitals in SSA and zoning hospital catchments
A bimodal model that include walking across land cover and motorised travel along major roads was built in AccessMod version 5 software to generate a raster surface of travel times to the hospital location.36 This platform has been used in many studies deriving travel times.36–39 First, 23 classifications for broad land use or land cover in GlobCover were reduced to six major classes of crop cover, forest, grassland, urban areas, bare ground and permanent water or snow. Second, a secondary land cover map was created by combining the broad six land use or land cover classification with the major roads. An anisotropic analysis was used to allow influence of slope on travel speed. Travel speed (impedance) was then assigned to the seven resulting classes (80 km/hour) for a major road with motorised travel, 4 km/hour with walking correction on vegetation patches, 30 km/hour for urban areas, and for desert landscapes, a 2 km/hour speed was used.36 The algorithm for deriving travel time in each class included a slope correction derived from elevation data with travel speeds calculated for each degree rise of slope based on Tobler’s equation (V=6*exp(−3.5abs[Tan(slope in degrees/57.296)+0.05]),40 where V is the calculated speed. Hence, on flat terrain, the walking pace is about 5.0 km/hour while for a 20° rise in slope, the pace is lower (1.4 km/hour).
Catchment areas (hard boundary) were defined from the gridded travel times within which people should have access to a healthcare facility capable of essential safe surgical and anaesthesia care within 2 hours, 1 hour and 30 min. To estimate the size of hospital catchment, a mean radius for these catchment zones was calculated. From previous literature, these thresholds have been used as proxies for emergency services (30 min to 1 hour), acute inpatient services (1 hour to 2 hours) and specialty services (2 hours).41 The 2-hour cut-off was used to align with evidence related to time between onset of bleeding and death if medical intervention is not received.42 The use of the 2-hour time frame does not suggest that all surgical conditions need to be treated within this period. The critical window for morbidity and mortality may be shorter or longer than 2 hours, depending on the medical condition. For example, surgery to treat a ruptured uterus must be secured within 2 hours to avoid death due to haemorrhage, whereas surgery to treat cataracts is not as time sensitive; however, for all conditions, proximity to surgical care may impact whether a patient accesses. Additional bands of travel within 30 min and 1 hour were also derived. Population needing surgery was estimated based on aggregated population within 30 min, 1 hour and 2 hours of a hospital.
Estimating the need for surgery in SSA
The need for surgery at the population level was estimated based on aggregated populations within 30 min, 1 hour and 2 hours of a hospital with assumed surgical capacity at the subnational level. The sum of the population was multiplied by the estimated constant rate of burden of surgical disease from previous studies.2 To estimate the surgical burden of disease relating to deaths or disability-adjusted life years, a lower proportion estimate of 0.28 and the upper proportion estimate of 0.32 was used following Shrime et al (2015).2
Results
Accessibility to surgery in SSA for all-age population
On average, there were 0.5 regional or district hospitals per 1 00 000 population. The largest hospital to population ratio per 1 00 000 population was in geographically smaller or sparsely populated countries such as Djibouti, Namibia, Botswana or Small Island states such as Sao Tome and Principe.
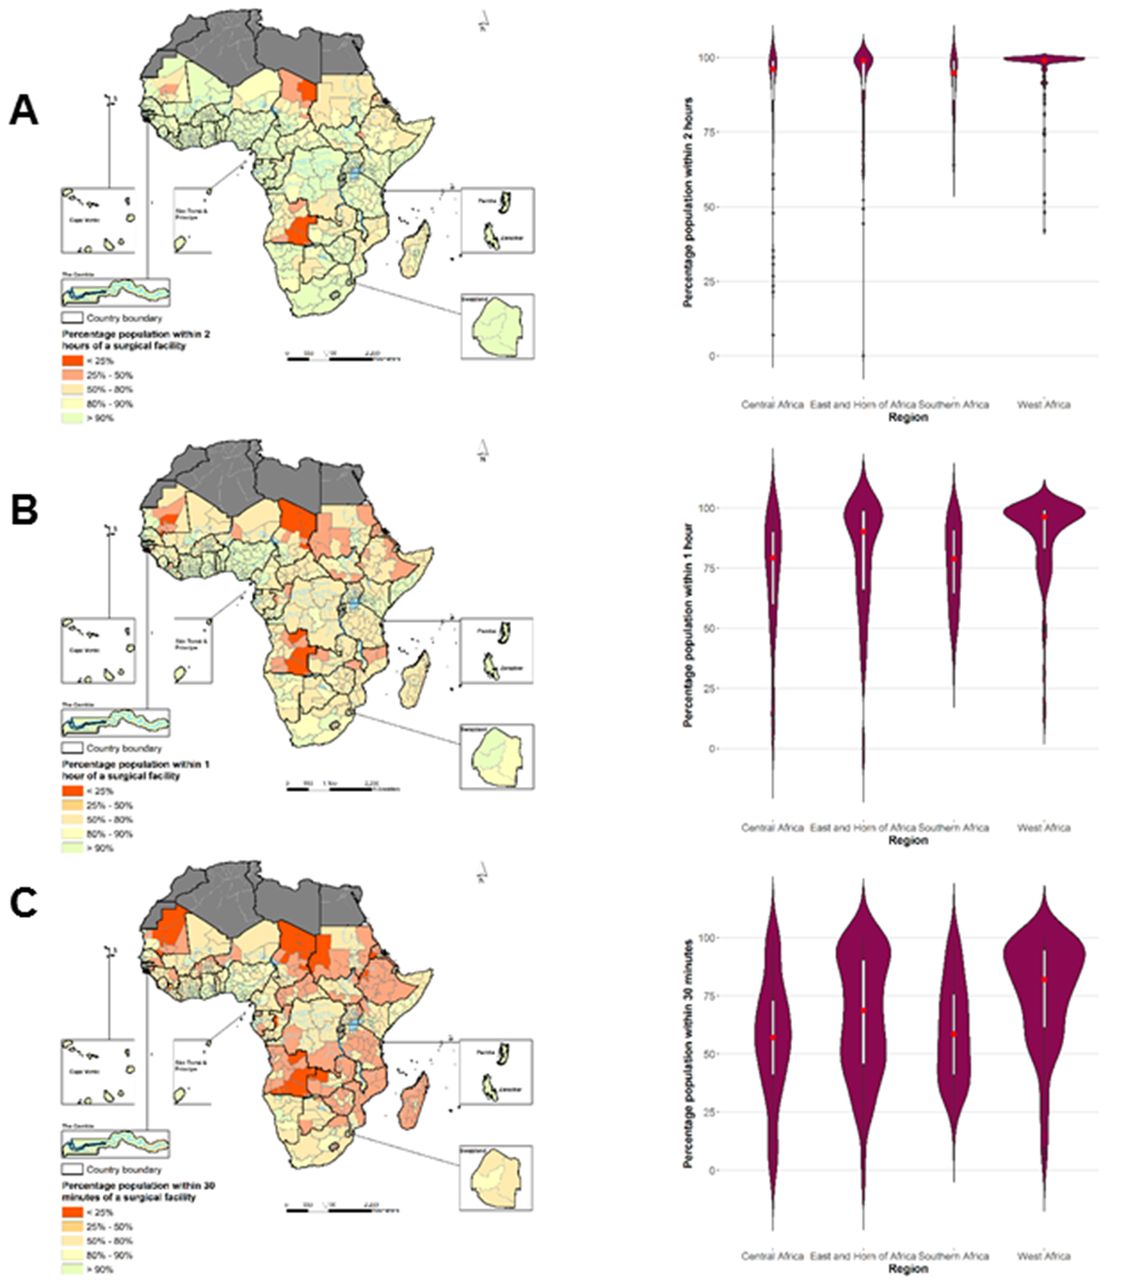
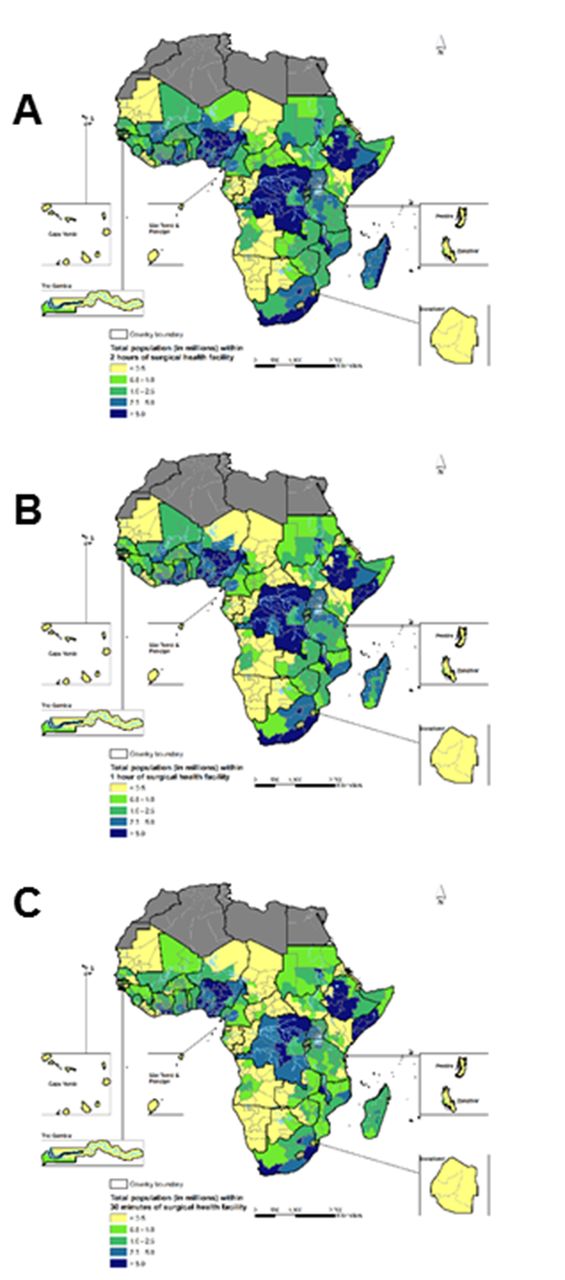
Figure 1A–C show the proportion of the population at administrative level 1 within the catchment area of 2 hours of a hospital with the assumed capacity to provide surgery. The violin plot shows regional variations for Central Africa, East and Horn of Africa, Southern Africa and West Africa. Table 1 and table 2 show regional and country level summary of population estimates for the three classifications of travel times (<30 min, 1 hour and 2 hours), respectively. The absolute number of people within each administrative level within the catchment area of 2 hours are shown in figure 2A–C.

Percentage of population by administrative level 1 in sub-Saharan Africa with access to major surgical facility.

![[bmjgh-2018-000875-SP1.jpg]](https://gh.bmj.com/content/bmjgh/3/4/e000875/DC1/embed/inline-supplementary-material-1.jpg?download=true)
Population by administrative unit 1 in sub-Saharan Africa with access to major surgical facility.
Regional level estimates of all-age population within travel time of 30 min, 1 hour and 2 hours (catchment) of surgery at a national level in sub-Saharan Africa
Country level estimates of all-age population and children under 15 years within travel time of 30 min, 1 hour and 2 hours (catchment) of surgery at a national level in sub-Saharan Africa
First, there was regional variation in estimate of population within 30 min, 1 hour and 2 hours of a major hospital with surgical capacity as shown by the violin plot. For example, at 30 min, the median proportion of population within a major hospital was 56% in central Africa compared with 75% in West Africa. There were further differences at a national and subnational levels. In Zambia, our estimates suggest that 86% of all-age population was within 2 hours of a major hospital but that reduced to 66% and 49% for 1 hour and 30 min, respectively. In contrast, in Ethiopia a country with significantly higher population, 79% were within 2 hours and that reduced to 61% and 42% for 1 hour and 30 min, respectively. While there was a variation in access at administrative 1 level (figure 1C), most of the all-age population (>55%) in Angola, Chad, Eritrea, the Sudan, Zambia, Ethiopia, Madagascar and Mozambique lived in areas greater than 30 min of the nearest hospital assumed to have the capability to perform basic surgical bellwether procedure.
Overall from figure 1A, 92.5% of the population in SSA resided in areas within 2 hours of a hospital with surgical capability, assuming that these hospitals had the adequate infrastructure and workforce.
Estimated burden of surgery relative to geographic proximity in SSA
By assuming that all the population within catchment area to major hospitals was at risk of surgical disease, the estimated burden of surgery was between 257.8 million people (lower estimate) and 294.7 million people (upper estimate) of all ages within 2 hours of travel time (figure 2A–C). This, however, declined to 187.2 million–213.9 million based on the 30 min catchment and 227.8 million–260.3 million people based on the 1-hour cut-off. At a national level, these estimates were highest in countries with high-population density such as the Sudan, the Democratic Republic of Congo (DRC), Ethiopia, Nigeria and in Tanzania and lowest in sparsely populated and geographically smaller countries or islands including Swaziland, Djibouti, Sao Tome and Principe, and Cape Verde. From table 1, the burden in all-age population within 2 hours of a hospital was 3.9 million to 4.5 million people in Zambia, 1.2 million to 1.4 million people in Liberia and 3.2 million to 3.7 million people in Rwanda. In 2015, 42% of SSA’s population was under the age of 15 years, and there were 1.2 billion young people between the age of 15 and 24 years. For children (<15 years), an estimated burden was 115.3 million to 131.8 million children based on a 2-hour catchment and 82.9 million to 94.77 million children based on 30 min travel time to a hospital with surgical capacity.
Accessibility to surgery for children under 15 years
Of the total population in SSA in 2015, 432.4 million (43.2%) were children under the age of 15 years (table 1). Of these, 414.8 million (95.9%) were estimated to be within the 2-hour catchment of a surgical hospital. In most countries, except for two (Angola and Eritrea), over 80% of all children were within 2 hours of a major surgical hospital. However, the number of children within catchment of a major regional or district hospital reduced significantly when estimating catchment within the 30 min travel time to approximately 295.8 million (68.4%). While the proportion of children residing in areas within 30 min of a facility with surgical capacity was greater than 80% in at least 12 countries, that proportion was 50% or less in 11 countries (Angola, Chad, Eritrea, Ethiopia, Lesotho, Madagascar, Mauritania, Mozambique, South Sudan, the Sudan and Zambia).
Discussion
This study evaluated geographic accessibility to essential surgery and estimated the burden of surgery in SSA based on regional and district level hospitals with the potential capacity to perform bellwether procedures. Travel times to a hospital adjusting for mode of travel and topography were combined with population maps to estimate the surgical burden. There was a large variability in accessibility at the subnational level.
Estimates from this study showed that approximately 93% of the all-age population in SSA lived within 2 hours of a major hospital that could theoretically carry out the bellwether procedures, reflecting trends of urbanisation in the region. Urban population in SSA varies between 60% and 80% in Angola, Botswana, Congo, South Africa; between 40% and 60% in DRC, Eritrea, Namibia, Somalia, Zambia and most Western and Central African countries; and between 20% and 40% in Sudan, Chad and most of Eastern African countries. At the same time, indeed, major hospitals are largely located in urban areas.43 In most countries, more than 80% of children (<15 years) were within 2 hours of a hospital, with the exception of Angola and Eritrea. Further, the proportion of population within 30 min in SSA reduced to 67% for all-age population and to 68% for children less than 15 years of age.
The burden for surgery, based solely on travel time estimation, in SSA was estimated between 115.3 million and 131.77 million in the 2-hour health facility catchments and was highest in densely populated countries like Nigeria, DRC, Ethiopia and Tanzania. The burden for all-age population and children under 15 years was lower in sparsely populated countries, including Botswana, Djibouti, Equatorial Guinea and the islands of Cape Verde as well as Sao Tome and Principe. These estimates could be combined with the data on the remaining five indicators as well as other demographic and epidemiological data to provide for a comprehensive assessment of health system capacity to plan for the provision of timely and safe surgical care.
This study provides a first-level assessment of indicator 1 of the LCoGS on estimating the proportion of the population within 2 hours of a facility capable of providing the bellwether procedures. These estimates provide a foundation for estimating absolute access in SSA when hospital infrastructure is assessed based on surgical assessment modules.31 Health facility-level data on infrastructure, workforce and medicine are essential to providing true indicator 1 as defined by the LCoGS.1 They can also be useful for strategic planning and increase service provision.
A major assumption of our study was that major district hospitals could perform the three bellwether procedures, chosen to represent surgical capacity. Previous evidence from Zambia23 and Ghana30 suggest that only 17% and 23% of the major hospitals, respectively, have the capability to provide such basic essential safe surgery when infrastructural and human resource capacity were considered. A further assessment in East African countries suggested deficiencies in infrastructure and health worker training.21 Thus, a realistic view is that the true coverage rate of population for indicator 1, controlling for infrastructural and human resource capacity, is much lower than that estimated here and only a few hospitals at a country level in SSA have the actual capacity to perform all the bellwether procedures based on reviews conducted in few countries in Africa. Therefore, further research must refine these findings with information on facility capacity to adequately and safely provide the bellwether procedures.
Travel times were derived by varying modes of travel and speeds based land use or land cover characteristics (eg, road, forest, bare land or urban areas), and topography (elevation). A basic assumption was that travel is multidirectional and influenced by the availability of roads. The results may, therefore, be biased because the actual travel patterns, access to motorised vehicles and accessibility for patients including the volume of referrals, road conditions (only motorway, primary or secondary roads) and speeds (using vehicles or motorcycles) are unknown. Empirical data for modelling these effects are not available for all countries in SSA, and future improvement on road quality data would impact calculation of travel times. Moreover, other financial, cultural and social factors, including costs, may impact the decision to go to the hospital, leading to bypassing phenomenon.44
There are other possible errors related to positional errors for hospital locations (up to 10 m for GPS georeferencing) or where address geocoding of place names were used as well as exclusion of private for hospitals. The estimation of access to surgery may be underestimated where private hospitals are often used compared with public-based hospitals. Further, a 1 km spatial resolution was adopted at country level for travel time estimation. This spatial resolution is probably not ideal for fine-scale mapping of the transport network and may overestimate access in remote rural areas or locations close to major roads. Mapping of road networks in Africa is not complete in all countries or better road data may exist for some countries but only for commercial purposes. There was also less control on the overall quality of other spatial ancillary data including elevation, complete mapping of all major roads and classification of land uses or land cover.
As a consequence, the need for essential surgery is expected to be much higher if all aspects of physical or geographic access, safety and financial risk protection are included in the definition of accessibility. This highlights the inadequacy of using a single metric for estimation of access to surgery. In general, the estimation of access to essential coverage requires a simultaneous assessment of human resource and infrastructure at the hospital level, which would require expanding hospital level assessments for each individual country, for example, through SPA implemented by the DHS with additional questions or a specific module on surgical procedures.21 The most recent SPA surveys include indicators on minor surgery or caesarean section at best. To date, they have been conducted in six countries: Namibia (2009 complete census of all health facilities, n=446),45 Kenya (2010 sample of health facilities, n=695),46 Malawi (2013–2014 complete census of health facilities, n=977),47 Senegal (2016 sample of health facilities, n=371),48 Tanzania (2014–2015 sample of health facilities, n=1188)49 and Uganda (2007 sample of health facilities, n=491),50 where data are not available in public domain.
Using a triangulation of hospitals data, geographic information systems and population data, this study estimated coverage at subnational levels for countries in SSA to provide a rapid assessment of geographic access. Although results suggest that all-age population within 2 hours was greater than 80% in most countries, it is observed that, with exception of small Island countries (eg, Mauritius, Seychelles, Cape Verde, Sao Tome and Principe, Equatorial Guinea), none of the sub-Saharan countries would meet the 80% and 2-hour threshold for actual safe and essential coverage on indicator 1 of the Lancet commission recommendation if surgical infrastructural and workforce differences are considered. For Sao Tome and Principe, for example, the main Island has one major public hospital whose population are within the 2-hour threshold (map not shown). Thus, while this may meet the threshold in terms of 2-hour geographic access, it is not known whether the main hospital has the capability to perform all bellwether procedures. This is also true for all the hospitals used in the study. There is, therefore, a need for future studies to explore the development of a hospital capacity index from national hospital surveys to scale coverage estimates developed here. That will also require continuous improvement in geolocation of hospital data surveys linked to health information systems.
Acknowledgments
RWS is grateful to the UK’s Department for International Development (DFID) for their continued support to a project Strengthening the Use of Data for Malaria Decision Making in Africa (DFID Programme Code no. 203155) that provided support to POO. POO acknowledge support under the IDeAL Project (no. 107769). All authors acknowledge the support from the Wellcome Trust to the Kenya Major Overseas Programme (no. 203077).
References
Footnotes
Handling editor Seye Abimbola
Contributors SJ, VAA and AJT conceived and designed the study. SJ and VAA were responsible for data management, analysis and production of the first draft of manuscript. PNB, SJK, EAO, POO, JGM reviewed and edited drafts of the manuscript. All authors reviewed, edited and approved the final manuscript.
Funding AJT is supported by a Wellcome Trust Sustaining Health Grant (no. 106866/Z/15/Z) and Bill & Melinda Gates Foundation (nos. OPP1106427, 1032350, OPP1134076). RWS is supported by the Wellcome Trust as Principal Research Fellow (no. 103602) that part supported POO.
Competing interests None declared.
Patient consent Not required.
Provenance and peer review Not commissioned; externally peer reviewed.
Data sharing statement A full database of hospital location data is available open access through the Harvard Dataverse under a CC-BY 4.0 license. All the ancillary spatial datasets and are available online.