Article Text

Abstract
Introduction Hypertension has become a major cause of morbidity and premature mortality in South Africa, but population-wide estimates of prevalence and access to care are scarce. Using data from the South African National Health and Nutrition Examination Survey (2011–2012), this analysis evaluates the national prevalence of hypertension and uses a care cascade to examine unmet need for care.
Methods Hypertension was defined as blood pressure over 140/90 mm Hg or use of antihypertensive medication. We constructed a hypertension care cascade by decomposing the population with hypertension into five mutually exclusive and exhaustive subcategories: (1) unscreened and undiagnosed, (2) screened but undiagnosed, (3) diagnosed but untreated, (4) treated but uncontrolled and (5) treated and controlled. Multivariable logistic regression models were used to explore factors associated with hypertension prevalence and diagnosis.
Results In South Africans aged 15 and above, the age standardised prevalence of hypertension was 35.1%. Among those with hypertension, 48.7% were unscreened and undiagnosed, 23.1% were screened but undiagnosed, 5.8% were diagnosed but untreated, 13.5% were treated but uncontrolled and 8.9% were controlled. The hypertension care cascade demonstrates that 49% of those with hypertension were lost at the screening stage, 50% of those who were screened never received a diagnosis, 23% of those who were diagnosed did not receive treatment and 48% of those who were treated did not reach the threshold for control. Men and older individuals had increased risks of being undiagnosed after controlling for other factors.
Conclusions There is significant unmet need for hypertension care in South Africa; 91.1% of the hypertensive population was unscreened, undiagnosed, untreated or uncontrolled. Data from this study provide insight into where patients are lost in the hypertension care continuum and serve as a benchmark for evaluating efforts to manage the rising burden of hypertension in South Africa.
- hypertension
- blood pressure
- South Africa
- health disparities
- non-communicable diseases
- cascade of care
- treatment cascade
- care continuum
- south african national health and nutrition examination survey
- sanhanes
This is an Open Access article distributed in accordance with the Creative Commons Attribution Non Commercial (CC BY-NC 4.0) license, which permits others to distribute, remix, adapt, build upon this work non-commercially, and license their derivative works on different terms, provided the original work is properly cited and the use is non-commercial. See: http://creativecommons.org/licenses/by-nc/4.0/
Statistics from Altmetric.com
- hypertension
- blood pressure
- South Africa
- health disparities
- non-communicable diseases
- cascade of care
- treatment cascade
- care continuum
- south african national health and nutrition examination survey
- sanhanes
Key questions
What is already known about this topic?
South Africa is said to have a quadruple burden of disease with infectious diseases, maternal and child mortality, trauma and non-communicable diseases all contributing significantly to disability and mortality.
Prior estimates of levels of diagnosis, treatment and control for hypertension in South Africa vary significantly, while national estimates of screening remain unknown.
What are the new findings?
Analysis of the 2011–2012 South African National Health and Nutrition Examination Survey reveals an age-standardised prevalence of 35.1% for hypertension in South Africans aged 15 and above.
Among those with hypertension, 48.7% were unscreened, 23.1% were screened but undiagnosed, 5.8% were diagnosed but untreated, 13.5% were treated but uncontrolled and 8.9% were controlled, suggesting that 91.1% of the hypertensive population has an unmet need for care.
The hypertension care cascade reveals that 51% of those with hypertension had ever been screened, 50% of those screened were diagnosed, 77% of those diagnosed were treated and 52% of those treated were controlled.
Recommendations for policy
Data from this study provide insight into where patients are lost in the hypertension care continuum and serve as a benchmark for evaluating efforts to manage the rising burden of hypertension in South Africa.
The most problematic transitions in the cascade of care occur before the screening stage, between screening and diagnosis, and between treatment and control, suggesting these aspects of the care continuum as possible points for future intervention or national policies.
Introduction
Although traditionally considered a burden common to high-income countries, hypertension is a growing health concern in all regions of the world, regardless of income level.1 By 2010, high blood pressure, a major risk factor for stroke and cardiovascular disease, had become the single largest contributor to premature mortality globally,1–3 causing 9.4 million deaths and 7% of global disablity-adjusted life years (DALYs).4
The prevalence of hypertension has been in steady decline since 1980 in the high-income countries of North America, Western Europe, Australasia and the Asian-Pacific region. However, blood pressure levels in Southeast Asia, Eastern Europe, Latin America and Africa are increasing.5 6 Over 80% of the disease burden associated with high blood pressure globally is now in low/middle-income countries.5
The prevalence of high blood pressure among adults in Africa is the highest in the world.4 Pooled estimates suggest that the prevalence of hypertension in Africa increased from 19.7% in 1990 to 30.8% in 2010, a trend typically attributed to increased urbanisation, population ageing and behavioural risk factors including tobacco and alcohol use, poor diet and physical inactivity.7 In South Africa, where nearly two-thirds of individuals reside in urban areas and the population is the oldest in sub-Saharan Africa,8 the most recent national survey, in 2008, estimated a prevalence of hypertension of 31% for men and 36% for women aged 15 and above.9 Estimates of awareness/diagnosis of hypertension in various studies reviewed in 2015 ranged from 19.1% to 56.4% of those with hypertension.10 Rates of treatment and control also varied considerably in previous cohort studies, from 16.7% to 40.9% for treatment and 4% to 33.1% for control.10
Few prior surveys or studies provide robust, recent evidence of the range of hypertension prevalence among different sex, age and population groups or, importantly, the extent of unmet need for hypertension services, including the proportion of those with hypertension who are unscreened, undiagnosed, untreated and uncontrolled. Additionally, the ‘care cascade’ or ‘cascade of care’ model has not been applied to examine the population-level management of hypertension in the South African context. A care cascade is a method of representing the proportion of people with a particular disease at various stages starting with screening and ending with control in order to identify which stages have the largest proportion of loss and guide future policies and interventions.11 12 This technique is most commonly used to visualise the HIV care continuum across global settings but has also been applied to sexually transmitted infections, tuberculosis and, recently, non-communicable diseases like diabetes within the USA.11 13
To help inform policymakers and assess the need for health system interventions, we analysed data from a recent, comprehensive national survey, the South African National Health and Nutrition Examination Survey (SANHANES), to estimate the national prevalence of hypertension and the extent of hypertension screening, diagnosis, treatment and control through the innovative use of a hypertension care cascade.
Methods
This study presents and analyses blood pressure data from South Africans aged 15 and above who participated in the SANHANES. The SANHANES, a cross-sectional survey conducted by the South African Human Sciences Research Council (HSRC) in 2011–2012, combines personal interviews with standardised physical examinations and laboratory tests.14 15
The survey employed a multistage disproportionate, stratified cluster sampling design reported in more detail elsewhere.14 A total of 500 nationally representative enumeration areas (EAs) were identified, and a random sample of 20 visiting point households (VPs) was selected from each.14 Of the 10 000 VPs sampled, 8168 were valid occupied households and 6306 were interviewed with 27 580 individuals eligible to participate. A total of 25 532 individuals (92.6%) completed the interview. All individuals who completed the interview were invited to participate in the physical examination, and 12 025 individuals (43.6%) consented to an examination.14
During the interview portion, participants were asked if they had a family history of high blood pressure and if they had ever been told by a medical professional that they have high blood pressure. Participants who reported having ever had their blood pressure measured and who were ever given blood pressure medication by a doctor were asked if they had taken high blood pressure medication in the past month.16 During the physical examination, three systolic and diastolic blood pressure measurements were taken after 5–10 min of rest using an Omron Automatic Digital BP monitor (model M2, Omron Healthcare, Bannockburn, Illinois, USA).14
The analysis reported here was restricted to participants with non-missing information on race, sex, province, and systolic and diastolic blood pressure. Among those who completed the physical examination, 7.7% had missing data on systolic blood pressure (SBP) or diastolic blood pressure (DBP) and were excluded. Those with implausible blood pressure values (SBP<70 mm Hg or SBP>270 mm Hg; DBP<50 mm Hg or DBP>150 mm Hg) were also excluded from analysis following established criteria.6 17 Additional exclusion criteria were applied in order to conduct the decomposition analysis for the hypertension care cascade. Participants were excluded because of missing data for self-reports of blood pressure measurement and a high blood pressure diagnosis. Of the respondents who reported a prior diagnosis, only those who reported whether they ever received blood pressure medication from a doctor and who reported whether they took their medication in the past month were retained. Supplementary figure A1 depicts the full exclusion criteria resulting in an analytic sample size of 5871.
Supplementary file 1
After applying the exclusion criteria, we averaged each individual's available measurements to determine final blood pressure for that person.18 Of the 5871 people in the final analytic sample, the majority had three SBP measurements (80.4%) and three DBP measurements (80.4%).
Overall, individuals were considered to have hypertension if they had a SBP≥140 mm Hg or a DBP≥90 mm Hg or had taken high blood pressure medication within the last month.19 Blood pressure (BP) was classified as normal if SBP<120 mm Hg and DBP<80 mm Hg and prehypertensive if 120≤SBP<140 or 80≤DBP<90, and the respondents were not currently taking antihypertensive medication.19
The hypertension category was decomposed into five mutually exclusive and exhaustive subcategories to examine unmet need for hypertension care, an approach modelled on a prior cross-national analysis of diabetes care.20 These five categories form a hypertension care cascade that allows us to identify where the greatest loss of access to care occurs within the health system.
The five categories used in this analysis were (1) unscreened (BP≥140/90 mm Hg; never had blood pressure measured; no reported prior diagnosis of high blood pressure); (2) screened, undiagnosed (BP≥140/90 mm Hg; reported having blood pressure measured ever; no reported prior diagnosis); (3) diagnosed, untreated (BP≥140/90 mm Hg; reported prior diagnosis, but no reported use of high blood pressure medication within the last month); (4) treated, uncontrolled (reported use of medication with BP≥140/90 mm Hg); and (5) treated, controlled (reported use of medication with BP<140/90 mm Hg). The criteria for each category is summarised in figure 1.
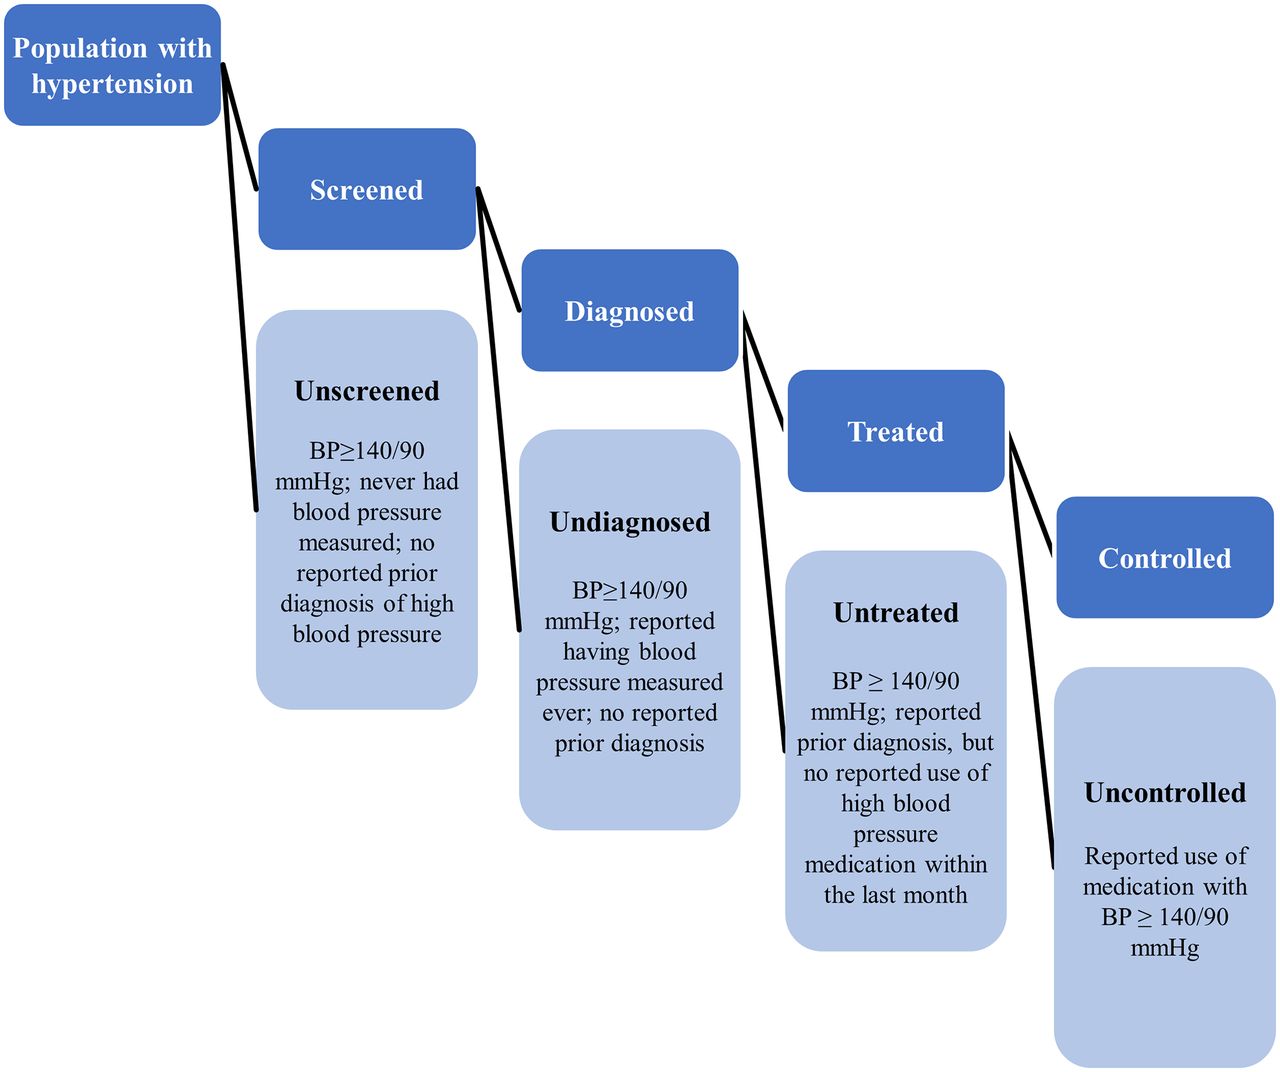
Hypertension care cascade criteria.
We examined the proportion of respondents who reached each stage in the care cascade using the number of respondents in the subsequent stage as the denominator. For example, among those who were diagnosed with high blood pressure, we calculated the proportion who then were treated with blood pressure medication. In addition to the stages in the cascade, we define ‘unmet need’ as the sum of the first four of these categories. The 150 people (2.6% of the analytic sample) with controlled blood pressure who reported a prior diagnosis but did not report use of medication were excluded from the care cascade analysis.
To examine differences across population subgroups, we integrated data on several covariates. Data on age, sex, race and geographic location were gathered through the interview portion of the SANHANES. Race was classified as African, coloured, white, Indian or other per South African standards, and the Indian and ‘other’ categories were collapsed for analysis. Geographic status was defined using the categories urban informal, urban formal, rural informal (tribal areas) and rural formal (farms). Weight and height were also measured during physical examinations using standardised techniques.14 21 Body mass index (BMI) was calculated in kg/m2 and categorised as underweight (BMI<18.5), normal (18.5≤BMI<25), overweight (25≤BMI<30) and obese (BMI≥30).22
Ethics
SANHANES received ethics approval from the Research Ethics Committee of the Human Science Research Council (HSRC) of South Africa (REF: REC6/16/11/11). All survey participants signed informed consent forms. Permission to use the SANHANES data was obtained from the Executive Director of the HSRC's Population Health, Health Systems and Innovation programme.
Statistical analysis
Descriptive statistics were generated using means for continuous and proportions for categorical variables. Estimates of prevalence were age standardised to the distribution of the South African adult population using mid-year population estimates for 2012 using 5-year age categories between 15 and 74 and an open-ended category of 75 and above. We used logistic regression analysis to investigate social, demographic and anthropometric predictors of prevalent hypertension and undiagnosed hypertension. Analyses were done using STATA V. 14.0 (Stata). Sample weights were incorporated in all analyses to adjust for unequal probabilities of selection and non-response, and variances were estimated using Taylor series linearization with the SVY routine.
Results
The final sample included 5871 total respondents. Descriptive statistics for the sample are compared with the South African adult population in table 1. The analytic sample was predominately female (56.6%) and African (77.5%). Compared with the population, the analytic sample contained a smaller proportion of men (43.4% vs 48.1%).
Characteristics of the final analytic study sample and the South African adult population aged 15 and above, 2011–2012
The age-standardised mean systolic blood pressure was 132.2 mm Hg (134.0 mm Hg for men and 130.9 mm Hg for women), and the age-standardised mean diastolic blood pressure was 77.4 mm Hg (76.8 mm Hg for men and 77.9 mm Hg for women). The age-standardised prevalence of normal and prehypertensive blood pressure measurements in the sample was 26.3% and 38.6%, respectively. The age-standardised prevalence of hypertension (SBP≥140 mm Hg or DBP≥90 mm Hg or taking blood pressure medication) was 35.1%. An analysis of blood pressure categories by population group can be found in table 2.
Blood pressure among South African adults aged 15 and above, 2011–2012
Among those with hypertension, 48.7% reported that they had never been screened for hypertension by having their blood pressure measured. An additional 23.1% were screened but undiagnosed, 5.8% were diagnosed but untreated and 13.5% were treated but uncontrolled. Only 8.9% of individuals with hypertension were controlled. Full results of the decomposition analysis are presented in online supplementary table A1.
Individuals in the 15–24 age category had the lowest prevalence of hypertension overall (12.5%), while individuals over 65 had the highest prevalence (83.0%). However, younger people had the highest risk of being unscreened—73.9% of individuals aged 15–24 with hypertension were unscreened compared with 21.7% of hypertensive adults over 65.
Supplementary table A1 shows that the age-standardised prevalence of hypertension was comparable between women and men (35.2% for men and 34.7% for women), but the likelihood of being unscreened was higher in hypertensive men than women (58.5% of men compared with 39.5% of women). Women with hypertension were more likely than men with hypertension to be treated, but uncontrolled (18.5% compared with 7.9%) as well as treated and controlled (13.9% compared with 3.5%), suggesting higher overall treatment rates among women as compared with men. The gender difference in hypertension changes with age; there was a higher prevalence of hypertension among young men than young women but a lower prevalence among older men compared with older women.
Overall, the age-standardised prevalence of hypertension was higher among the coloured population (41.1%) than the African (34.1%), white (38.9%) or Indian/Asian/other (28.7%) populations. The proportion of unscreened hypertension, however, was highest among the Asian/Indian/other subpopulation. Whites had the highest proportion of controlled hypertension.
Table A1 also shows that hypertension was most prevalent in rural formal (39.6%) and urban formal (37.1%) areas and lowest in urban informal areas. Prevalence of hypertension increased steadily with BMI from 20.4% among the underweight to 30.7% among those with normal BMI to 34.1% among the overweight to 43.4% among the obese. Higher proportions of unscreened, undiagnosed hypertension were found in the underweight and normal BMI categories than the overweight and obese subgroups.
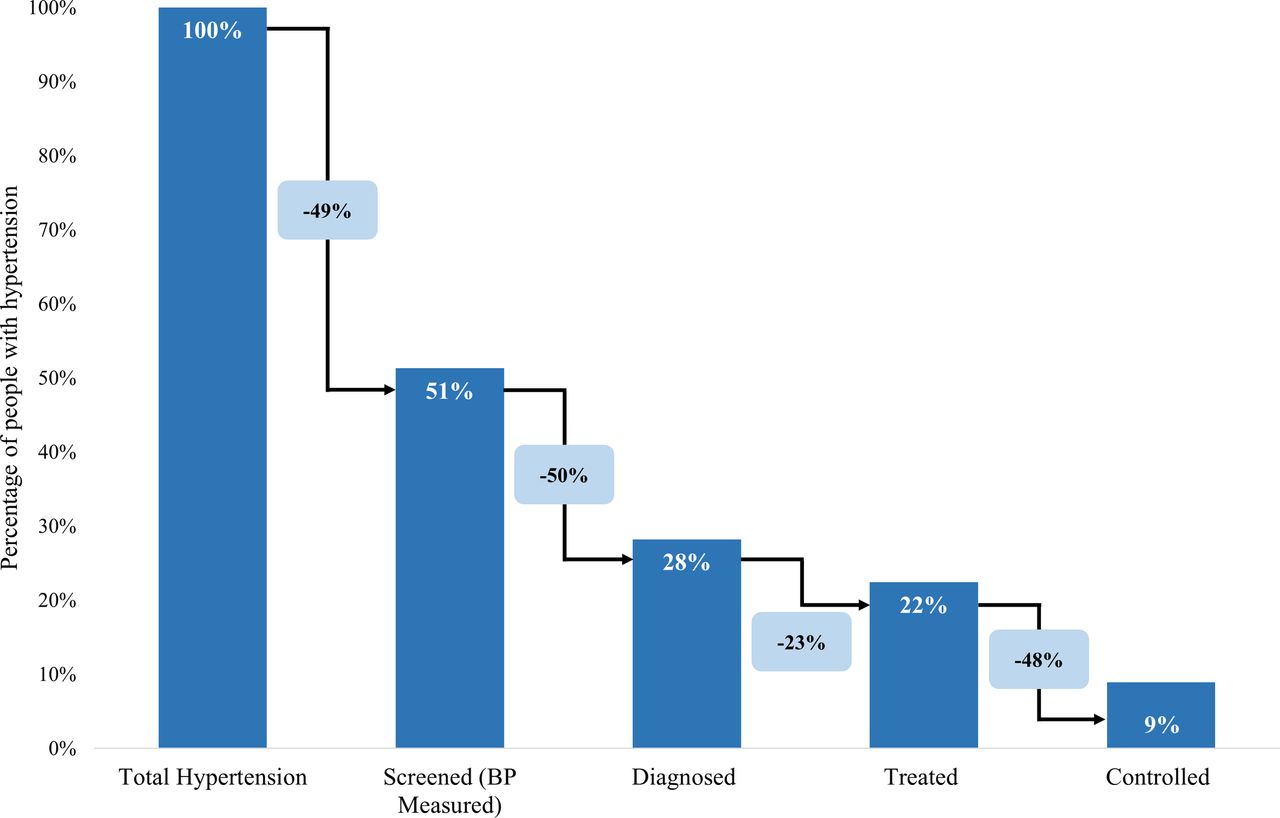
The hypertension care cascade results are displayed in figure 2. The first stage in the cascade is being screened for hypertension through blood pressure measurement. Among those with hypertension, 51% reported that they have ever had their blood pressure measured, a significant loss to care. Among those who self-reported ever being screened, 50% reported that they had been told they had high blood pressure by a health professional. Among those who self-reported a prior diagnosis, 77% also reported that they had taken blood pressure medication in the last 30 days. Among those treated for hypertension, 52% had controlled blood pressure (<140/90 mm Hg).

The hypertension care cascade, South Africa 2011–2012. Of those with hypertension, 51% have ever been screened for hypertension, a 49% loss. Of those who have ever had their blood pressure measured, 50% received a diagnosis of high blood pressure, a 49% loss. Of those who received a diagnosis, 77% were being treated with blood pressure medication, a 23% loss. Of those who had taken blood pressure medication in the last 30 days, 52% had controlled blood pressure (<140/90 mm Hg), a 48% loss.
In the multivariable analysis of predictors of hypertension prevalence (table 3), we found statistically significant elevated OR associated with higher age, rural formal areas, high BMI and a family history of hypertension. Men were significantly more likely to be hypertensive compared with women, while Indian/Asian/other South Africans were significantly less likely to be hypertension compared with those of the African race. In the analysis of predictors of undiagnosed hypertension (includes unscreened and screened, undiagnosed groups) among those in the sample with hypertension, we found that being older increased risk of being undiagnosed after controlling for other factors. Being male was also associated with a statistically significant higher risk of being undiagnosed.
Predictors of hypertension prevalence and diagnosis, South Africa 2011–2012
Discussion
This study reports one of the first nationally representative estimates of the burden of hypertension and extent of unmet need for hypertension care among South Africans. Our analysis suggests that the age-standardised prevalence of hypertension was 35.1% (35.2% for males and 34.7% for females) among South Africans aged 15 and above in 2012. This estimate is comparable to that of the National Income Dynamic Study (NIDS), which estimated a prevalence of hypertension of 31% for men and 36% for women for the same age range in 2008.9 Among SANHANES participants aged 50 and above in the study sample, the age-standardised prevalence of hypertension was 70.6% (68.1% for males and 72.2% for females), slightly lower than the figure estimated in the 2008 Study of Global Ageing and Adults’ Health (SAGE) which found a prevalence of 77.3% (74.7% for males and 80.3% for females) for the same age group.23
Our analysis revealed very high rates of unmet need for hypertension care. Of the 35.1% of the adult population with hypertension, only 8.9% were treated and controlled. On the other hand, 48.7% were unscreened and undiagnosed, 23.1% were screened but undiagnosed, 5.8% were diagnosed but untreated and 13.5% were treated but uncontrolled, indicating that 91.1% of the hypertensive population had unmet need for hypertension care.
Further analysis revealed lower levels of diagnosis in the 15 and above SANHANES sample than prior NIDS estimates; 18.3% of men (vs 26% for NIDS) and 38.0% of women (vs 49%) reported being diagnosed, regardless of screening. However, we found higher levels of diagnosis and control among adults aged 50 and above in the SANHANES sample compared with prior reports; 54.0% (vs 38.1% for SAGE) were aware of their condition and 13.3% (vs 7.8% for SAGE) were controlled.23
Our estimates indicate a higher hypertension prevalence and substantially greater unmet need for hypertension care in South Africa compared with the USA. Recent estimates from the 2011–2012 NHANES in the USA suggest that the age-standardised prevalence of hypertension was 29.1% among adults (18 and above) in the USA compared with our estimate of 35.5% in South African adults aged 18 and above.19 Additionally, among adults with hypertension in the USA, over half (52%) were controlled, far more than the 8.5% estimated for South Africa. Furthermore, only 17% of Americans with hypertension were undiagnosed compared with 72.0% of adult South Africans aged 18 and above,19 suggesting South Africa faces a larger challenge of providing adequate hypertension care.
In addition to the increased risk of hypertension and undiagnosed hypertension among men than women, our analysis revealed notable disparities across other groups within the population, similar to disparities that have been observed in smaller, community-based studies in South Africa.24 Although hypertension prevalence was highest among older age groups in the current study, unmet need for care, particularly proper screening, was most apparent among younger age groups. Similarly, hypertension prevalence was highest among groups with higher BMIs, but rates of unscreened hypertension were higher among those with underweight and normal BMIs. Because weight and age are known risk factors for high blood pressure, these results reveal those who do not fit the typical picture of high blood pressure as a vulnerable subgroup of the population with low levels of screening and subsequently awareness. Additionally, evidence suggests that the quality of care for hypertension in younger age groups is worse than that offered to older age groups.25
The hypertension care cascade reveals that the key gaps in the population-level management of hypertension are proper screening and diagnosis; nearly half of hypertensive respondents reported never even having their blood pressure measured. Of those with hypertension who reported having their blood pressure measured, only 50% received a diagnosis, another significant loss of 50% between the stage of screening and diagnosis. In total, only 28% of those with hypertensive blood pressure measurements reported awareness of their condition.
There is no tradition of annual health screening of individuals who do not present at clinics for a cause in South Africa, leaving asymptomatic adults with little or no exposure to the health system. This is particularly a constraint among men, who do not visit clinics for reproductive or child health services and had a much higher prevalence of undiagnosed hypertension than women in our study after adjusting for other factors.14 Furthermore, there may be a gap between high blood pressure measurement and effective diagnosis. Although some of the people who reported screening may have had their blood pressure measured before becoming hypertensive, 69% of the people who fell into the category of screened, undiagnosed reported that they had their blood pressure measured in the last 12 months suggesting that they may have had hypertensive measurements when screened but did not receive a diagnosis. The reasons behind this gap remain unknown but could point to ineffective communication between patients and providers or a lack of understanding of diagnosis.
In addition to the poor rates of screening and diagnosis, the care cascade suggests that a gap exists in terms of effective treatment with antihypertensive medication. Among those who reported use of blood pressure medication, only 52% had controlled blood pressure which may be due to poor adherence to antihypertensive medications or possibly ineffective medication. Low adherence levels have been documented in South Africa for several long-term treatment regimens, including antiretroviral therapy for HIV and tuberculosis treatments.26 27
Recent estimates from a hypertension analysis in an Agincourt subdistrict with a strong history of extensive population health surveillance found significantly higher rates of diagnosis, treatment and control. This study reported that among hypertensive respondents aged 40 and above, 64.4% were aware of their condition, 49.7% were treated and 22.8% were controlled. Furthermore, among those who were diagnosed/aware, 89.3% were treated, higher than our estimate of 77%. Among those treated, 45.8% were controlled which is comparable to our estimate of 52%. The superior performance in hypertension detection and management of this district is likely attributed to the area's long-term health surveillance programme, suggesting that hypertension management, especially diagnosis, could be improved through surveillance programmes that focus on cardiovascular risk.28
Several factors related to access, health-seeking behaviour and health system quality may also contribute to the high rate of unmet need for hypertension care, especially among the poor, the uninsured, black Africans and rural residents.29 For patients, monetary and time costs of travel to access health services pose a barrier.30 Insufficient knowledge about hypertension among patients may also limit care seeking.10
Other barriers are provider related. Although essential drugs for hypertension are available free of charge in local clinics in South Africa, few people with hypertension use them.31 One study noted that 59.92% of hypertensive patients in primary healthcare facilities in Cape Town had poor scores for individual quality of hypertensive care, suggesting that physicians are not consistently monitoring blood pressure, creatine, total cholesterol and BMI levels in hypertensive patients.25 Nurses in at least one rural area have reported that the supply of blood pressure medication to clinics is variable, limited or poor quality equipment makes it difficult to take clinical blood pressure and clinics often face stock-outs that can result in denying treatment to hypertensive patients.32
The high prevalence of hypertension as well as the significant unmet need for care may have implications for levels and trends in mortality at the population level in South Africa. Recent mortality data for South Africa indicate a decline in age-standardised death rates associated with non-communicable diseases (NCDs); however, this decline may partially reflect a decrease in tobacco-related mortality.33 Indeed, individual causes of death associated with hypertension and its underlying risk factors, such as hypertensive heart disease, diabetes and renal disease have increased over the past several decades,33 34 suggesting hypertension may be playing a growing role in South African national mortality patterns over time.
The primary strength of this analysis is the use of data from a large national sample that includes both self-reported questions and standardised measurement of SBP and DBP. Another strength is the use of a care cascade to depict population-level estimates of the patients that make it through each stage of the care continuum from screening to control.
The most important limitation was the low response rate to the physical examination portion of the SANHANES; of the 17 418 participants aged 15 and above in the interview sample, only 42.9% consented to a physical examination. Respondents were also excluded from the analysis based on implausible blood pressure measurements and missing information on variables required for constructing the hypertension care cascade (see online supplementary figure A1). A bias analysis that compares demographic characteristics of the final analytic sample with those excluded between interview and analysis is presented in the online supplementary table A2. This table shows that white people and men were disproportionately excluded, a possible source of selection bias that could have affected estimates of prevalence and unmet need. Consenting to a physical examination may not have been as attractive to those who already have a source of care and are aware of their hypertension status, a potential source of selection bias in our analysis that may have led us to overestimate the rate of unmet need for care in this population.
Finally, although most participants who consented to the physical examination had multiple blood pressure measurements taken, the standard practice of recording three measurements was not universal. The findings of this study should thus be confirmed in other high-quality national cohorts.
Conclusion
South Africa is confronted with several major health challenges simultaneously, including a high burden of infectious diseases, maternal and child mortality, trauma and non-communicable diseases which all contribute significantly to disability and mortality.35 As a result, hypertension must compete with infectious diseases like HIV/AIDS for limited financial resources within the health system.36 Until recently, South African health policy and spending have prioritised infectious and communicable diseases over non-communicable diseases.
The recent launch of the national Strategic Plan for the Prevention and Control of Non-Communicable Diseases, however, reflects shifting national priorities as South Africa aims to reduce, by at least 25%, the relative premature mortality from NCDs by 2020.37 This national strategy also reveals an emphasis on improved hypertension care; one of the 10 goals and targets for 2020 is to reduce the prevalence of people with high blood pressure by 20% through lifestyle changes and medication.37 A more accurate baseline measure of the national prevalence of hypertension and rates of screening, diagnosis, treatment and control are needed to assess any improvements in hypertension control.
The estimates in this study can serve as evidence for future national policies and standards regarding the screening, diagnosis, treatment and management of hypertension in South Africa. Furthermore, mapping care cascades overtime has proven beneficial in identifying improvements in care,38 suggesting that these results can serve as a benchmark for evaluating the effectiveness of health system reforms and improvements to the delivery of hypertension care.
References
Footnotes
Contributors AS designed the study. KB and AS cleaned and analysed the data and KB wrote the first draft of the manuscript. WP, ZM, RS, DL and SR contributed to the conceptualisation of the study and to data interpretation. All authors assisted in drafting the manuscript and have read and approved the final version.
Competing interests None declared.
Provenance and peer review Not commissioned; externally peer reviewed.