Article Text

Abstract
On November 18, 2016, the WHO ended its designation of the Zika virus (ZIKV) epidemic as a Public Health Emergency of International Concern (PHEIC). At the same time, ZIKV transmission continues in Asia, with the number of Asian countries reporting Zika cases increasing over the last 2 years. Applying a method that combines epidemiological theory with data on epidemic size and drivers of transmission, we characterised the population at risk of ZIKV infection from Aedes aegypti mosquitoes in 15 countries in Asia. Projections made under the assumption of no pre-existing immunity suggest that up to 785 (range: 730–992) million people in Asia would be at risk of ZIKV infection under that scenario. Assuming that 20% of ZIKV infections are symptomatic, this implies an upper limit of 146–198 million for the population at risk of a clinical episode of Zika. Due to limited information about pre-existing immunity to ZIKV in the region, we were unable to make specific numerical projections under a more realistic assumption about pre-existing immunity. Even so, combining numerical projections under an assumption of no pre-existing immunity together with theoretical insights about the extent to which pre-existing immunity may lower epidemic size, our results suggest that the population at risk of ZIKV infection in Asia could be even larger than in the Americas. As a result, we conclude that the WHO’s removal of the PHEIC designation should not be interpreted as an indication that the threat posed by ZIKV has subsided.
- epidemiology
- medical entomology
- public health
- arboviruses
- dengue
This is an Open Access article distributed in accordance with the Creative Commons Attribution Non Commercial (CC BY-NC 4.0) license, which permits others to distribute, remix, adapt, build upon this work non-commercially, and license their derivative works on different terms, provided the original work is properly cited and the use is non-commercial. See: http://creativecommons.org/licenses/by-nc/4.0/
Statistics from Altmetric.com
Key questions
What is already known about this topic?
The WHO recently declared that the Zika virus (ZIKV) epidemic no longer constitutes a Public Health Emergency of International Concern (PHEIC), but ongoing transmission in Asia raises questions about how many people may still be at risk.
What are the new findings?
Model-based estimates suggest that up to 785 (range: 730–992) million people across the entirety of 15 Asian countries would be at risk of ZIKV infection (including symptomatic and asymptomatic) under a scenario in which there was no pre-existing immunity and under the assumption that transmission is dominated by Aedes aegypti mosquitoes. This is lower than previous estimates due to our accounting for the self-limiting effect that herd immunity has on epidemic growth.
Pre-existing immunity to ZIKV has counterintuitive implications for the population at risk in Asia, with stronger protective effects of pre-existing immunity in low-transmission settings than in high-transmission settings.
How might this influence practice?
Given that the population at risk of ZIKV infection in Asia could potentially be even larger than in the Americas, it is important that the WHO’s removal of the PHEIC designation not be interpreted as an indication that the threat posed by ZIKV has subsided.
Introduction
On November 18, 2016, the WHO declared an end to its designation of the Zika virus (ZIKV) epidemic as a Public Health Emergency of International Concern.1 At the same time, ZIKV transmission has continued in Asia, with the number of Asian countries reporting Zika cases increasing over the last 2 years.2 The region’s large population and long history of endemic transmission of the closely related dengue virus (DENV)3 make this situation concerning.
Although some crude information about the history of ZIKV transmission in Asia is known, the overall level of pre-existing immunity in the region is highly uncertain, with estimates of pre-existing immunity based on studies conducted during 1951–1997 reported on a highly aggregated basis and ranging from 2.3% in Pakistan to 43.5% in Malaysia.4 These figures provide some information about pre-existing immunity to ZIKV, but there is still a great deal of uncertainty about ZIKV immunity across Asia. First, the duration of ZIKV immunity has not been clearly established, although studies commonly assume that ZIKV infection results in lifelong protection.5 Second, DENV antibodies have been shown to be cross-reactive with ZIKV,6–8 raising the possibility of protective or enhancing effects of DENV antibodies on ZIKV infection.9 Third, cross-reactive DENV antibodies pose challenges to interpreting serological assays for prior ZIKV infection, making it difficult to assess the extent of pre-existing immunity in a DENV-endemic region such as Asia. In addition, there could be extensive subnational variability in ZIKV immunity given the focal nature of transmission of other viruses by Aedes mosquitoes, such as DENV10 and chikungunya virus (CHIKV).11 Despite the difficulty of accounting for these and other uncertainties about ZIKV’s history in Asia, making projections of its future remains important for public health preparedness.12
One recent study13 provided an assessment of the population at risk of ZIKV in Asia by spatially associating the presence of Zika case reports with factors such as vector occurrence probabilities, climatic conditions, and per capita health expenditures using a species distribution modelling approach. That study estimated that the number of people living in areas of Asia that could support local ZIKV transmission could be as high as 2.3–3.2 billion.8 These numbers are alarming, but they are clearly far higher than the true population at risk. Even in the most intense transmission settings, some proportion of the population is expected to remain uninfected due to the protective effects of herd immunity.14 Furthermore, the extent of the population protected by herd immunity is expected to correlate with transmission intensity, with herd immunity extinguishing epidemics in low-transmission settings before they grow large. For areas such as China, where there are only 2.2 reported cases of dengue per million people in a typical year,15 the projected 0.24–1.13 billion people living in areas of China with the potential to support local ZIKV transmission13 is clearly not reflective of the true population at risk.
Accounting for herd immunity in projections of the population at risk
To provide a more realistic estimate of the population at risk of ZIKV in Asia, we applied a method that accounts for the protective effect of herd immunity and also considered how pre-existing immunity to ZIKV among Asian populations may impact these projections. Having previously used this method to make projections for the Americas,16 here we made analogous projections for 15 Asian countries with a significant history of DENV transmission.3 This method combines classic results from epidemiological theory with empirical estimates of infection attack rates (IAR) from past epidemics of ZIKV and CHIKV and highly spatially resolved data on drivers of transmission to make location-specific projections of IAR in the event of an epidemic in an immunologically naïve population.
Data to inform projections of the population at risk
We first assembled a suite of spatial data layers obtained from different sources to serve as covariates in our spatially explicit model that focused on ZIKV transmission by the Ae. aegypti mosquito, given its dominant role in recent outbreaks and its high potential to contribute to future transmission in Asia.17 18 For demography, we downloaded high-resolution gridded data from WorldPop (http://worldpop.org.uk) on total population and total births in 2015 (at 100 m x 100 m resolution) covering 15 countries: Bangladesh, Brunei, Cambodia, India, Indonesia, Laos, Malaysia, Myanmar, Pakistan, Philippines, Singapore, Sri Lanka, Timor-Leste, Thailand, and Vietnam.19 For five countries that did not have gridded data on births (Brunei, Malaysia, Singapore, Sri Lanka, Thailand), we imputed births at each grid cell by scaling total population in each grid cell by national-level birth rates.20 For temperature, we downloaded WorldClim (www.worldclim.org) gridded mean monthly temperature at a resolution of 5 km x 5 km covering all 15 countries.21 We then calculated two location-specific transmission parameters as a function of temperature: daily mortality of Ae. aegypti 22 and extrinsic incubation period based on studies of DENV infections in Ae. aegypti.23 Similarly, we obtained a set of 100 gridded Ae. aegypti occurrence probability layers at a resolution of 5 km x 5 km, with each layer reflecting a unique sample from the posterior distribution of parameters.24 To account for heterogeneity in mosquito-human contact due to socioeconomic factors,25 we incorporated estimates of per capita gross cell product (GCP) adjusted for inflation at a resolution of one degree.26 Missing data for two countries (Timor-Leste and Myanmar) were uniformly filled with inflation-adjusted GCP figures obtained from the United States Central Intelligence Agency World Factbook.27
Modelling to inform projections of the population at risk
We used the aforementioned spatial data layers to calculate the basic reproduction number R 0 as a function of temperature T and the GCP economic index based on the classic Ross-Macdonald form,28
 (1)
(1)
where a is mosquito biting rate, m is the ratio of mosquitoes to humans, α(GCP) is a scaling factor that incorporates the effect of GCP on mosquito-human contact, b and c are human-to-mosquito and mosquito-to-human infection probabilities, μ(T) is the daily mortality rate of adult mosquitoes at temperature T, 1/r is the average duration of infectiousness in humans, and n(T) is the extrinsic incubation period at temperature T. Because of our assumption of a common dominant vector in Ae. aegypti, we assumed that this model for R 0 was a reasonable approximation for any of ZIKV, DENV, or CHIKV in settings where those viruses are transmitted predominantly by Ae. aegypti, although there may be important ways in which these viruses differ.29
Based on a theoretical one-to-one relationship between the basic reproduction number, R 0, and the first-wave infection attack rate, IAR, under an SIR transmission model,14 we generated location-specific projections of IAR. Lesser known parameters in the formulas for R 0 and IAR (ie, the effect of GCP and the scaling relationship between R 0 and IAR) were calibrated by comparing model-generated IAR with 13 published estimates of IAR experienced during invasions of CHIKV and ZIKV into naïve populations, as determined by virus-specific serological tests in 12/13 cases and an extrapolation of clinical attack rate in 1/13 cases (table 1).30–37 Although there are limitations associated with serological testing for ZIKV,38 these data presently reflect the best estimates available of the epidemic size of ZIKV or related viruses in naïve populations in areas with high-quality gridded spatial data on drivers of transmission. To generate projections of the overall population and annual births at risk of ZIKV infection, we multiplied location-specific infection attack rate projections, IAR, by the corresponding population and births in each grid cell.
Estimates of infection attack rates (IAR) of viruses transmitted by Aedes mosquitoes following epidemics in populations that were presumably immunologically naïve to these viruses prior to each epidemic. Of these 13 estimates, 12 were based on virus-specific serological assays (eg, IgG and/or IgM) of a cross-section of the population, and one36 was based on extrapolating an estimated clinical attack rate of 0.029 assuming a reporting rate of 0.75 to obtain a conservative estimate of IAR in that case. These IAR estimates were used to calibrate the model originally described by Perkins et al 16 Some IAR estimates from other epidemics were not included for a variety of reasons, including ambiguity about the level of immunity prior to an epidemic or a lack of high-quality gridded data in locations such as small islands on variables used by the model to make location-specific IAR projections.
Because they do not account for spatial processes such as ZIKV importation and the relative isolation of some locations, our IAR projections are best interpreted as location-specific projections conditional on an epidemic occurring in the first place. Our projections are also not temporally specific, meaning that they do not take into account the timing of ZIKV introduction in relation to seasonal transmission patterns, and they are not specific about the timeframe over which an epidemic will subside. They also focus exclusively on the potential for ZIKV transmission by Ae. aegypti mosquitoes and may underestimate the contributions to ZIKV transmission by other mosquito vectors or by other transmission routes.17 Despite these limitations, our model-based approach is one of the few modelling tools currently available for making projections of ZIKV epidemic size.12
Validating model projections of the population at risk
Since our initial publication16 describing the method used here, four additional studies39–42 have been published that offer an opportunity to validate our method against empirical estimates of IAR for CHIKV and ZIKV (table 2). One estimate of IAR for CHIKV following an epidemic in Puerto Rico was based on IgM and IgG ELISAs performed on blood donations before and after the CHIKV epidemic there.41 Another estimate of IAR for CHIKV following an epidemic in Chapada, Brazil was also based on IgM and IgG ELISAs and was performed on a random sample of residents.39 One estimate of IAR for ZIKV over the course of an epidemic in Guayaqil, Ecuador was based on biweekly PCR assays for ZIKV from control subjects in a case-control study of pregnant women.42 Another estimate of IAR for ZIKV over the course of an epidemic in Recife, Brazil was also based on subjects in a case-control study of pregnant women but used plaque-reduction neutralization tests (PRNT).40 For each of these four studies, we obtained a probabilistic estimate of IAR under a Bayesian framework by assuming a non-informative beta prior probability distribution and a binomial likelihood, which implied a beta posterior probability distribution with parameters  and
and  .43
.43
Estimates of infection attack rate (IAR) of viruses transmitted by Aedes mosquitoes following epidemics in populations that were presumably immunologically naïve to these viruses prior to each epidemic in the Americas. These IAR estimates were used to allow for validation of the model against independent IAR estimates.
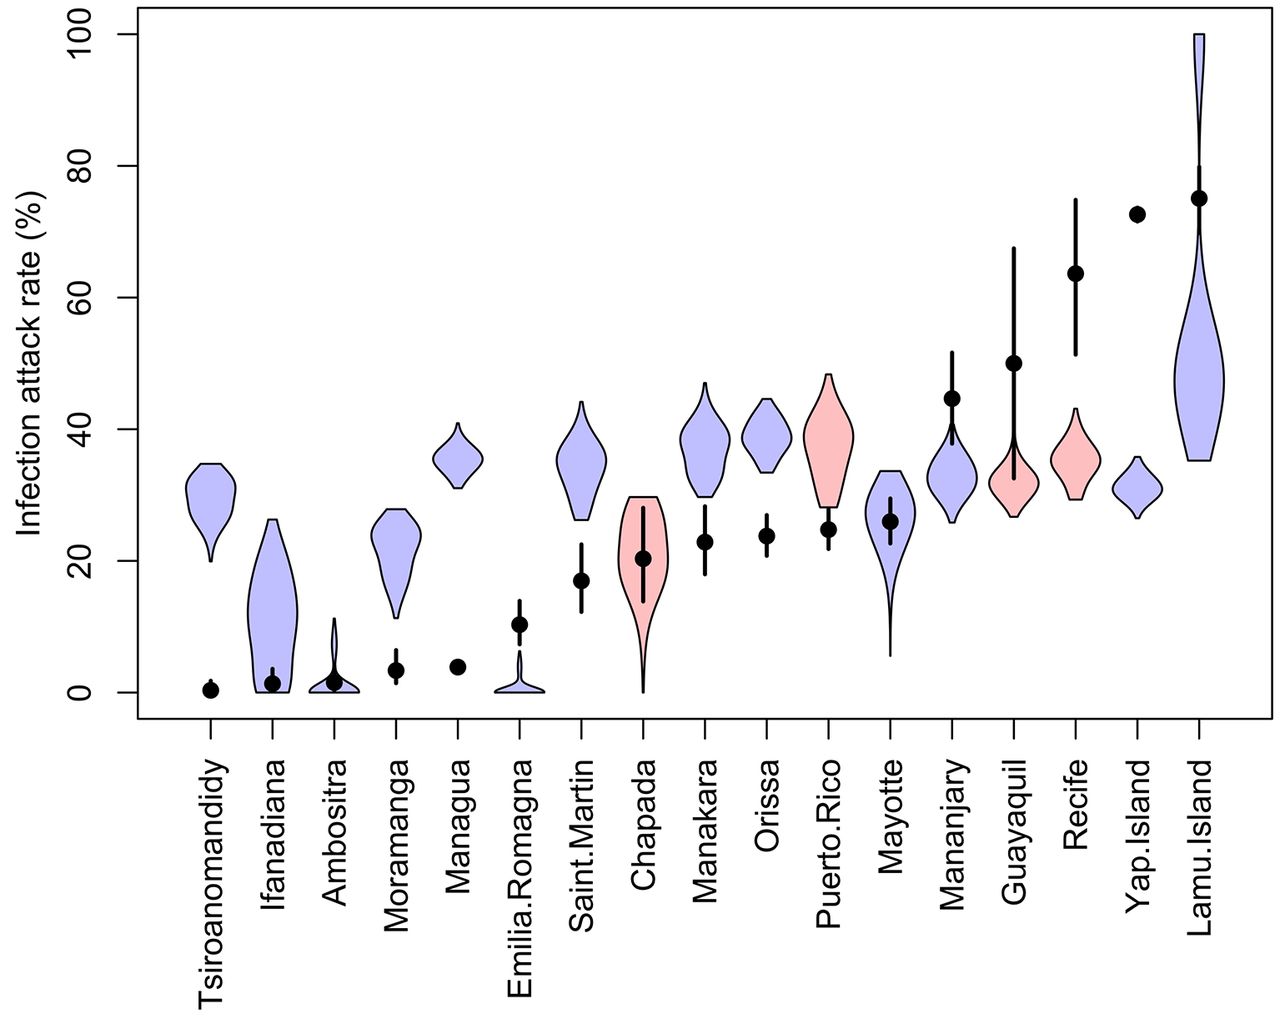
We compared our location-specific IAR projections to these four empirical estimates of CHIKV and ZIKV IAR that were independent from the data used to calibrate the model. To make IAR projections comparable to these estimates, we first compiled data on temperature, Ae. aegypti occurrence probability, and the GCP economic index for each site, and we then computed a distribution of IAR projections for each site by applying 1000 random draws of model parameters to equation 1. We found that the 95% posterior predictive intervals of three recent empirical estimates of CHIKV and ZIKV IAR intersected with the range of IAR projections (figure 1, Guayaquil, Puerto Rico, Chapada). However, the 95% posterior predictive interval of one recent empirical estimate of ZIKV IAR40 was noticeably lower than the corresponding empirical estimate (figure 1, Recife). This resulted in location-specific IAR projections averaged across the four new sites being somewhat lower than empirical estimates of IAR averaged across those same four sites (mean of projected IARs=0.31, mean of empirical IARs=0.40) as compared to the original 13 sites (mean of projected IARs=0.27, mean of empirical IARs=0.23). Based on this exercise, we conclude that our projections may be relatively accurate in some areas but could represent an underestimate in other areas, such as Recife, where the epidemic was particularly explosive.

Comparison of model projections of infection attack rate (IAR) (blue and red) and empirical estimates of IAR (black) for each of 17 sites. Coloured violin plots show the distribution of 1,000 Monte Carlo samples of model projections of IAR at the 13 sites used to calibrate the model (blue) and at the four sites used to independently validate the model (red). Black lines show the 95% posterior predictive intervals of empirical estimates of IAR of either CHIKV or ZIKV at those sites, and the points shows the respective medians.
An upper limit for the projected population at risk
Although it is important to account for the limiting effects of pre-existing immunity on ZIKV projections in Asia, we first describe projections made under the assumption of no pre-existing immunity. This is necessary for two reasons. First, although these projections are almost certainly an overestimate across the region, they nonetheless provide an upper limit for the number of possible ZIKV infections across the region and are necessarily much lower than estimates by Bogoch et al 13 due to our acknowledgement of herd immunity. Second, given that historical patterns of ZIKV transmission in Asia may have been heterogeneous in time and space,4 11 the assumption of little to no pre-existing immunity in our location-specific projections could be reasonable for some locations.44
Our upper-limit projections indicate that as many as 785 (range: 730–992) million people could become infected by ZIKV in the event of a relatively rapid first-wave epidemic in an immunologically naïve population, were an epidemic to occur in Asia under circumstances similar to the epidemic in the Americas (figure 2). Because as many as 80% of ZIKV infections may be asymptomatic,37 we note that our implied upper-limit projection for the number of clinical episodes of Zika is considerably lower (ie, 157 million assuming that 20% of infections are symptomatic). At the country level, we project that India has the potential for the largest number of ZIKV infections by more than six-fold that of any other country, mainly due its large population and relatively high suitability for ZIKV transmission. The country-level, per capita probability of infection ranges from 0.21 in Laos to 0.40 in Cambodia and Bangladesh. Among childbearing women across the region as a whole, there could be as many as 15.3 (range: 14.2–19.6) million infected under this worst-case scenario. India would likewise be projected to have the highest number of births affected by Zika under this scenario, but countries such as Pakistan and the Philippines would have disproportionately more infections among childbearing women due to those countries’ relatively high birth rates.
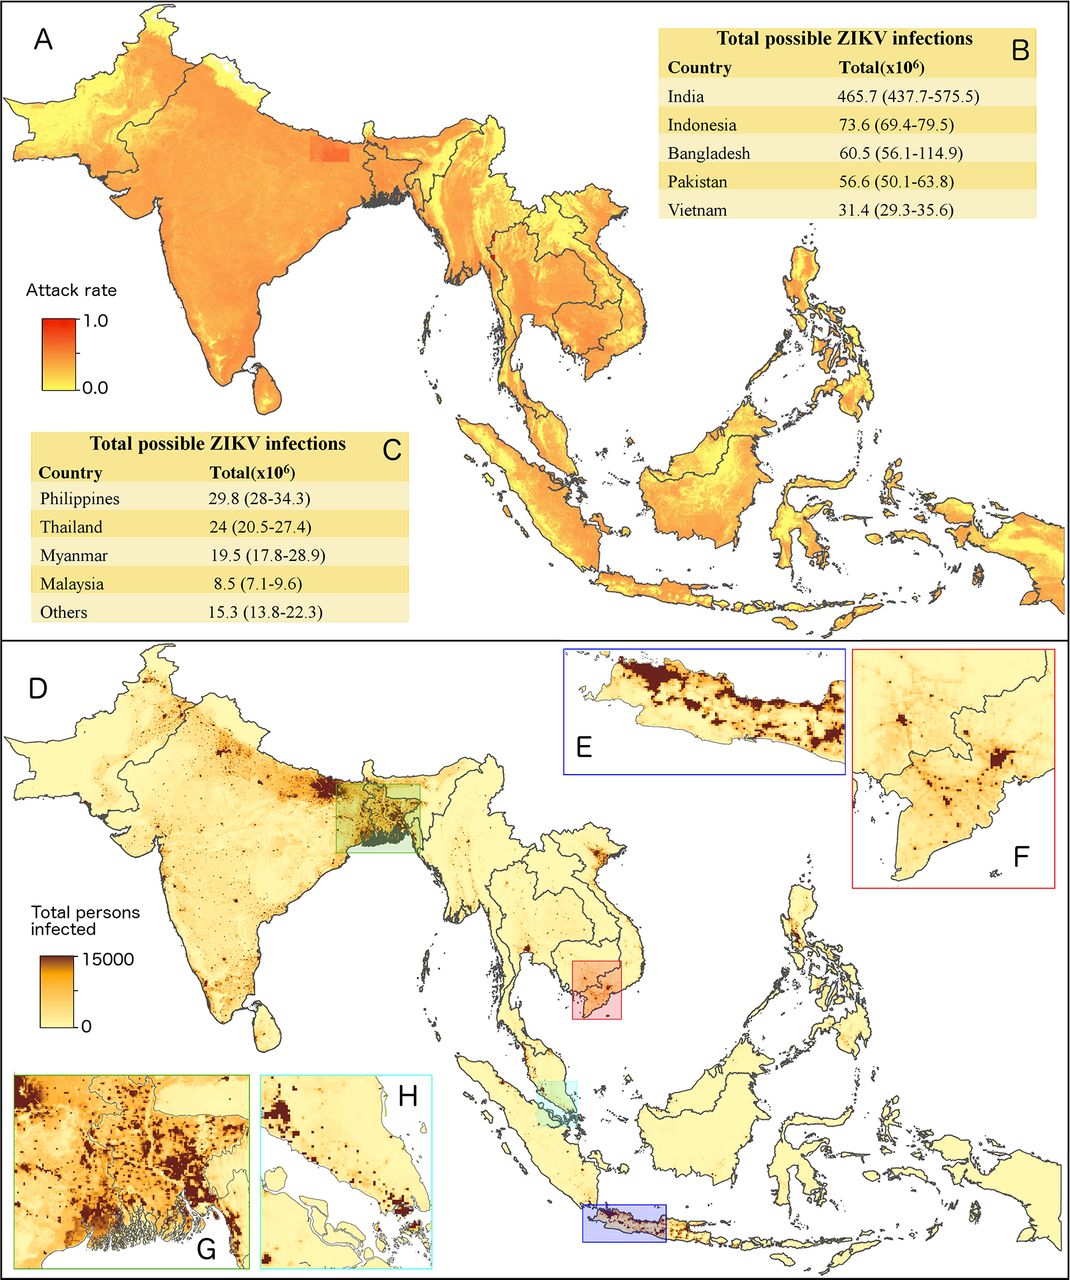
Model-based projections of ZIKV epidemic potential in Asia. (A) Median projections of first-wave ZIKV infection attack rates at 5 km x 5 km resolution across Bangladesh, Brunei, Cambodia, India, Indonesia, Laos, Malaysia, Myanmar, Pakistan, Philippines, Singapore, Sri Lanka, Timor-Leste, Thailand, and Vietnam, using the approach by Perkins et al.16 These projected infection attack rates were combined with spatial demographic data19 to project (D) expected numbers of infections for men and women of all ages and then (B, C) summed nationally. These location-specific projections are shown in greater detail for (E) western Java, (F) southern Vietnam, (G) Bangladesh, and (H) Singapore and Kuala Lumpur. Tables indicate median values and the total range of values from 1,000 Monte Carlo samples that reflect uncertainty in model parameters.
Compared with our projections for the Americas,16 these totals are nearly one order of magnitude greater due to a combination of larger populations and higher projected infection attack rates. India alone has more than twice the population of the region of the Americas we considered in our previous analysis, yet it is projected to have a five-fold larger number of infections in the event of a first-wave ZIKV epidemic in an immunologically naïve population. In addition, country-level averages of projected infection attack rates are also higher in several cases in Asia than they are in the Americas.
Putting the projections into context
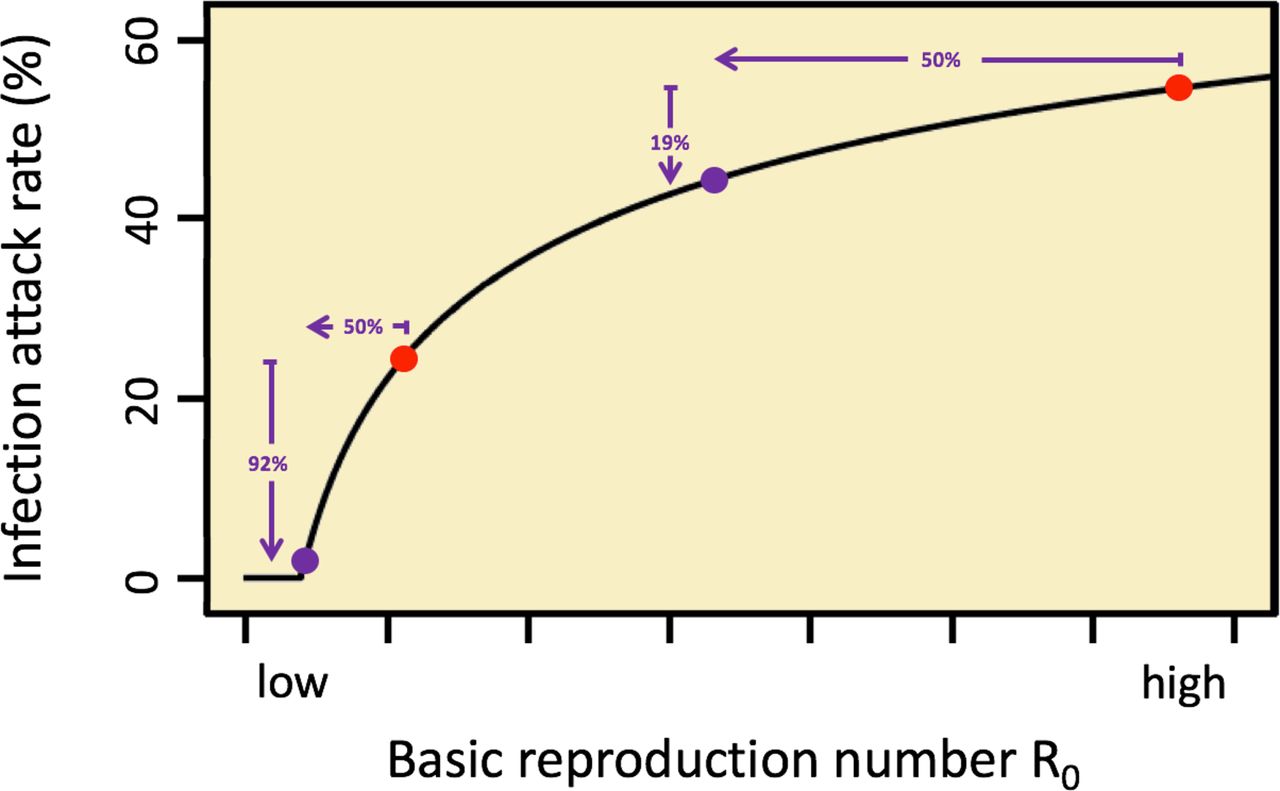
To understand the extent to which our projections may overestimate the true population at risk of ZIKV infection due to the fact that our projections do not account for pre-existing immunity, it is important to understand how a given level of pre-existing immunity would impact our projections. Specifically, for a given level 1-s of pre-existing immunity in a population with a projected infection attack rate of IAR, what does this imply about infection attack rates IAR i in the presence of pre-existing immunity? Pre-existing immunity would mean that the effective reproduction number R assumes a fraction S of its value R 0 in a fully susceptible population,9 the latter being what our projections of IAR are based on. Such a linear effect of S on R implies a nonlinear effect of S on IAR i . Specifically, in regions with the highest R 0 we would expect IAR i > (1-s) IAR among the susceptible population, whereas in regions with the lowest R 0 we would expect IAR i < (1-s) IAR among the susceptible population, possibly even 0 (figure 3). As a result, pre-existing immunity in high-transmission settings in Asia may result in less indirect protection of susceptibles than the simple notion of a linear protective effect of pre-existing immunity might suggest.
The effect of pre-existing immunity on infection attack rates (IAR). The nonlinear relationship between the basic reproduction number R 0 and the infection attack rate IAR implies that the same level of pre-existing immunity 1-s could have different impacts on future epidemics of ZIKV in Asia, depending on location-specific values of R 0 or, in other words, the overall potential for transmission in a given area. Consider a population with 50% pre-existing immunity. The reproduction number R = (1-s) R 0=R 0/2. For locations with high R 0, this reduces IAR to IARi by a relatively small fraction (eg, 19%). For locations with low R 0, this reduces IAR to IARi by a relatively large fraction (eg, 92%). In both scenarios, IARi is the projected infection attack rate among individuals susceptible at the onset of the epidemic in question.
Although it is clear that ZIKV transmission has been documented numerous times in Asia both before and after its emergence in the Americas,44 it is not clear how different the situation in Asia may be now than it was before 2015. Travel histories of recently documented ZIKV infections in Asia indicate that there has been a mixture of ZIKV importation from the Americas and ZIKV infection that has occurred locally in Asia,44 and travel volumes between these continents appear sufficient for international spread to continue for as long as ZIKV is present in either Asia or the Americas.45 Virus evolution may also play a role, with one recent study suggesting that the American strain of ZIKV may be transmitted more efficiently by Asian Ae. aegypti than is the Asian strain of ZIKV.18 There are also questions about whether large-scale climatic forces such as El Niño may have played a role in driving recent patterns of ZIKV transmission on both continents in 2015–2016.46 Definitive answers to these questions are still beyond the reach of current analyses given currently available data,47 but resolving these uncertainties nonetheless remains important for clarifying the future of ZIKV in Asia and for the manner in which health systems should prepare for future ZIKV activity.
Conclusions
Since 2015, ZIKV outbreaks across the Americas have received a great deal of attention, while contemporaneous transmission in Asia has been less alarming but nonetheless widespread.44 47 48 As interest in understanding the past, present, and future of ZIKV in Asia grows, many important questions remain.49 Our projections help move closer towards addressing one of these questions: namely, the population at risk of continued transmission of ZIKV by Ae. aegypti. Although an overall lack of data about pre-existing immunity4 prevented us from making numerically specific projections in light of pre-existing immunity, our projections of the population at risk in the event of an epidemic in a naïve population offer a revised, and more modest, upper limit on the population at risk in Asia than has been reported before.13 Moving forward, further refinements of model-based projections such as ours would benefit tremendously from improved diagnostics50 and spatially-explicit, age-stratified serological data.51 It will also be important to further refine our estimates by accounting for possible differences in infection attack rates owing to context-specific factors such as virus strain, vector species involved, and urban or rural context, as additional empirical estimates of ZIKV IAR are published. Balancing these remaining uncertainties with concern for the large population inhabiting areas with substantial potential for transmission, we conclude that it is imperative that the WHO’s declaration that the PHEIC is over not be interpreted as a sign that the threat posed by ZIKV has subsided.
Acknowledgements
This research was supported by a RAPID award from the National Science Foundation (DEB 1641130) and by a grant from the National Institute of Allergy and Infectious Diseases at the National Institutes of Health (R01 AI102939-01A1).
References
Footnotes
Contributors ASS and TAP each contributed to all phases of the analysis and manuscript development.
Funding This research was supported by a RAPID award from the National Science Foundation (DEB 1641130) and by a grant from the National Institute of Allergy and Infectious Diseases at the National Institutes of Health (R01 AI102939-01A1).
Competing interests None declared.
Provenance and peer review Not commissioned; externally peer reviewed.
Data sharing statement Data and code used to generate the results in this manuscript are made available online at https://github.com/asiraj-nd/zika-asia.