Article Text

Abstract
Introduction Given the serious health consequences of discontinuing antiretroviral therapy, randomised control trials of interventions to improve retention in care may be warranted. As funding for global HIV research is finite, it may be argued that choices about sample size should be tied to maximising health.
Methods For an East African setting, we calculated expected value of sample information and expected net benefit of sampling to identify the optimal sample size (greatest return on investment) and to quantify net health gains associated with research. Two hypothetical interventions were analysed: (1) one aimed at reducing disengagement from HIV care and (2) another aimed at finding/relinking disengaged patients.
Results When the willingness to pay (WTP) threshold was within a plausible range (1–3 × GDP; US$1377–4130/QALY), the optimal sample size was zero for both interventions, meaning that no further research was recommended because the pre-research probability of an intervention's effectiveness and value was sufficient to support a decision on whether to adopt the intervention and any new information gained from additional research would likely not change that decision. In threshold analyses, at a higher WTP of $5200 the optimal sample size for testing a risk reduction intervention was 2750 per arm. For the outreach intervention, the optimal sample size remained zero across a wide range of WTP thresholds and was insensitive to variation. Limitations, including not varying all inputs in the model, may have led to an underestimation of the value of investing in new research.
Conclusion In summary, more research is not always needed, particularly when there is moderately robust prestudy belief about intervention effectiveness and little uncertainty about the value (cost-effectiveness) of the intervention. Users can test their own assumptions at http://torchresearch.org.
- value of information
- sample size
- expected value of sample information EVSI
- HIV
- antiretroviral therapy
- lost to follow up
- Kenya
- East Africa
This is an Open Access article distributed in accordance with the Creative Commons Attribution Non Commercial (CC BY-NC 4.0) license, which permits others to distribute, remix, adapt, build upon this work non-commercially, and license their derivative works on different terms, provided the original work is properly cited and the use is non-commercial. See: http://creativecommons.org/licenses/by-nc/4.0/
Statistics from Altmetric.com
- value of information
- sample size
- expected value of sample information EVSI
- HIV
- antiretroviral therapy
- lost to follow up
- Kenya
- East Africa
Key questions
What is already known about this topic?
Interventions aimed at reducing patient disengagement from HIV care and tracing and relinking disengaged patients have been shown to be effective and have a positive impact on life expectancy.
The body of evidence that supports these findings (see supplementary material) are comprised of observational studies and it may be argued that randomised controlled trials are needed to support decision-making.
To help guide future trials, we calculated optimal sample sizes using a value of information framework tomake explicit the value of every incremental increase in sample size in terms of net health gains such that investigators and funders can aim for a size that maximises health and investment dollars.
What are the new findings?
Our analysis suggests that sufficient evidence already exists about the probable effectiveness of interventions to support decision-making under current circumstances, and additional information gained from a trial will likely not change the current decision.
Recommendations for policy
Taken together, the evidence suggests that interventions that aim to reduce patient disengagement from HIV care have a positive clinically relevant impact on life expectancy with insignificant harms.
However, when compared with other life-saving interventions, such as the expansion of antiretroviral therapy, the evidence is mixed over whether implementation of risk reduction interventions to improve retention is the most efficient use of resources in sub-Saharan Africa.
Supplementary file 1
Introduction
Retaining HIV-positive patients in lifelong medical care is essential to accessing and remaining on antiretroviral therapy (ART) and is directly linked to reduced morbidity and mortality. Yet, along the HIV care continuum keeping patients in care is a continual challenge with suboptimal rates observed in both high-income and resource-constrained countries.1 2 In sub-Saharan Africa, two recent meta-analyses reported that a median of 44% of patients never link to care within the first year of testing positive, 55% are lost once enrolled in pre-ART care and 25% are lost within 2 years after initiating ART.3 4
A myriad of individual-level, clinic-level and structural-level interventions have been evaluated to assess their ability to reduce attrition at each stage of the continuum, some designed specifically to reduce attrition while for a majority attrition is a secondary measure to outcomes like adherence or used as an indicator of broader targets like improved system efficiency.5 6 Among them a number of interventions have demonstrated a positive effect on reducing the risk of disengaging from ART care, including the use of mobile text message reminders to take treatment,7 intensive patient monitoring and adherence support,8 community-based treatment support9 and decentralisation/task-shifting.10 11 Similarly, outreach interventions have demonstrated their success in tracing 60%–90% of disengaged ART patients and relinking 30%–70% of those found alive.12–18 Fewer and less rigorous studies have evaluated the effect of interventions during the time between testing and enrolment, though randomised control trials are currently under way to investigate point-of-care CD4 count testing, test and linkage to care, and use of mobile technology.5 19–21
Given the serious health consequences associated with failing to start or discontinuing ART, randomised control trials may be warranted and are possibly worthwhile investments. As funding for global HIV research is finite, investigators and funders should take into consideration the efficiency of alternative study design options that would maximise health gains and generate information valuable to decision-making.22 Within a value of information framework, expected value of sample information (EVSI) and expected net benefit of sampling (ENBS) can make explicit the value of every incremental increase in sample size in terms of net health gains such that investigators and funders can aim for a size that maximises health and investment dollars. Different from a power analysis, which is used to determine the minimum sample size required to detect a desired effect size for a given risk of a type I error,23 EVSI and ENBS quantify the marginal health benefit gained by increasing a study's sample size and then weigh that benefit against the cost associated with acquiring more participants.22 24 When the expected net benefit is greater than the cost of the study, the proposed trial can be considered worthwhile.22 However, if the cost of the study outweighs the health gains, the return on investment is negative and acquiring more participants is unjustified.
To help inform decision-making regarding future studies, we estimated the optimal sample size for conducting two hypothetical intervention trials in East Africa.
Methods
Interventions and trials
The aim of the hypothetical risk reduction trial is to test an intervention that may reduce the likelihood a patient will disengage from HIV care (ART and associated clinical services). A specific intervention (eg, text appointment reminders) was not modelled rather the simulation reflects a realistic range of interventions with differing levels of effectiveness and cost. The intervention was applied to all patients who were actively engaged in care at their originating clinic and accordingly the intervention's effectiveness and cost were applied to those patients. The intervention was discontinued for patients who disengaged or transferred to another clinic, but reapplied to patients who re-engaged in care at their originating clinic after a period of disengagement.
The aim of the hypothetical outreach trial is to test an intervention that may relink disengaged patients back to HIV care. The outreach intervention is triggered when a patient does not return for an appointment, at which point the patient is traced, vital status ascertained and, if found alive, attempts are made to relink the patient back to his/her originating clinic. Once triggered, the intervention effect and cost was applied until the patient was found or for 90 days, whichever occurred first. If the patient was not found within those 90 days, the outreach effort ended as did the intervention's effect and cost. After re-engagement, the patient is still eligible for the outreach intervention which will again be triggered should the patient again disengage.
The hypothetical trials test each intervention independently, and it is assumed that participants are randomly and equally allocated to an intervention or control group.
HIV progression simulation and 'lost to follow-up'
We used a validated probabilistic microsimulation that represents the natural history and treatment of HIV,25–28 and includes pathways related to disengaging from and reconnecting to HIV care.29 While greater detail about the pathways is described in Kessler et al, in summary patients on ART can with some probability disengage from their current clinic due to death (recognised or unrecognised), unreported transfer to another clinic or disengage from care for any other reason. It is assumed that patients who are disengaged from care are non-adherent with ART or opportunistic infection prophylaxis, and can with some probability (if they experience a symptomatic AIDS event) re-engage back with care. The impact of the risk reduction intervention affects the probability of disengaging from clinic, whereas the outreach intervention influences the probability of relinking back to care.
Calculating optimal sample size
For each intervention trial, EVSI and ENBS were calculated for a range of sample sizes. Formally, EVSI is

where  is the expected net monetary benefit of a decision made based on information generated from the new study (to adopt the intervention or not) and
  is the expected value of a decision made with current information. For a given simple size n, we used a Bayesian process to conjugate the predictive distribution relating to new information and the prior distribution for current information.24 Then, a posterior distribution was obtained by combining the prior and predictive distributions. More specifically, we ran the VOI model
  iterations to generate statistic
  from the conjugated prior and predictive distributions. For each
  ,
,  iterations were generated from the posterior distribution to obtain the updated values of the variable of interest θ. After experimentation and weighing the tradeoffs between computational burden and result robustness, we used
  and
and  in this study. Therefore, a total number of 1 million (
 ) iterations were used to calculate EVSI for a given sample size n. For each posterior effect size generated from a single iteration, we input that value into the HIV progression model in order to estimate health outcomes (quality-adjusted life years (QALYs)) and costs.29
ENBS was calculated for a range of sample sizes to assess the value of conducting each trial after considering the added cost of recruiting additional participants. Formally, ENBS is

where  is the expected cost of acquiring one trial participant and
  is the expected cost of obtaining a sample of a given size. When ENBS is positive (ie, EVSI for a given sample size exceeds the cost of conducting a trial of that size), the trial is deemed worthwhile (positive return on investment). The optimal sample size is the one that produces the largest ENBS.
Variables and assumptions
Table 1 lists the variables relevant to the EVSI and ENBS calculations. The values used in the HIV progression and retention in care simulations can be found elsewhere.29 We conducted systematic literature reviews and meta-analyses30 to establish prior distributions for intervention effect sizes (see online supplementary material). Although we initially restricted the search to East African countries, when we identified two or fewer eligible studies after reviewing full texts, we expanded the search to include all sub-Saharan African countries. For the risk reduction intervention, we identified only one study that met our eligibility criteria. Based on that study, which tested a nurse-based risk reduction intervention in Kenya among 140 000 patients at 25 clinics, we assumed a 78% (lognormal distribution of −0.25, 0.08) relative risk associated with the intervention compared with no intervention. For the outreach intervention, five studies were pooled to estimate the proportion of disengaged patients who were successfully traced (76%, beta (1745, 426)) and four studies were pooled to estimate the proportion of patients who were found alive and returned to care (55%, beta (505, 414)). See figure 1 for probability density curves for each distribution. Pooled estimates came from randomised and non-randomised studies that were published in peer-reviewed journals within the last 10 years.
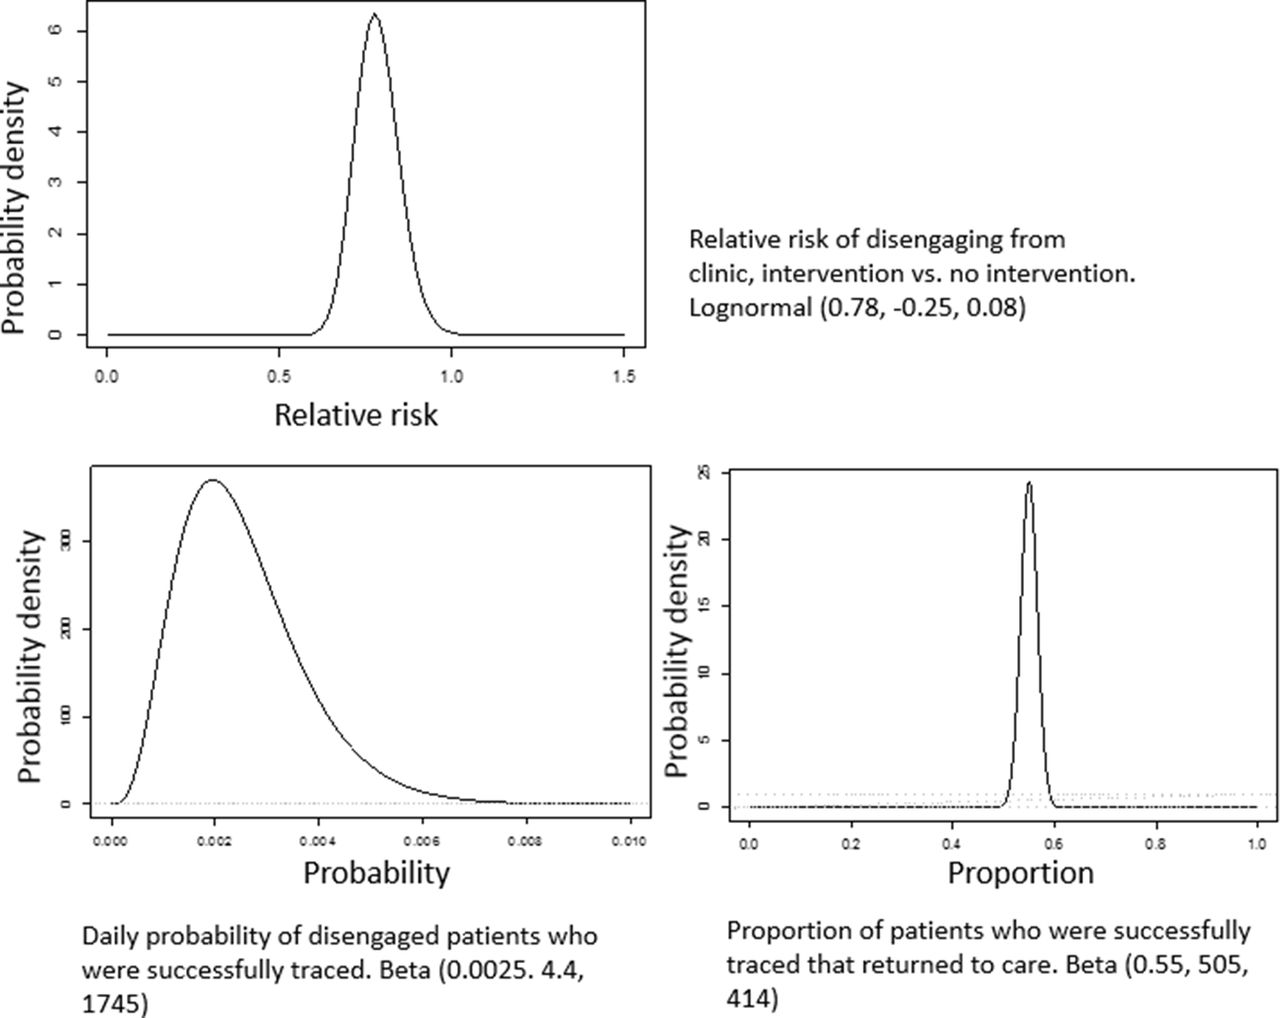
Probability density curves for intervention effect inputs.
Base case inputs and distributions
We assumed the cost of the risk reduction was $10 per person per month, and the cost of the outreach intervention was $4.56 per person per month.29 Intervention costs reflect the average cost per person, and wide ranges were tested in sensitivity analysis to reflect the heterogeneity of programmes. The cost of adding one additional study participant was $1140 and was based on four recent randomised control trials conducted in Kenya, Rwanda and Uganda.31–34 We assumed the intervention, if adopted as policy, would be implemented for 10 years without any lasting effect once implementation ended.
We used a hypothetical target population (number of patients eligible for the intervention) of 950 000 for the risk reduction intervention which is based on Kenya's ART programme (approximately 596 000 adults on ART + 354 000 in pre-ART care),4 35 of which 418 000 were eligible for the outreach programme. In base case analysis, we used a willingness to pay (WTP) threshold of $2473 per QALY which is the incremental cost-effectiveness ratio (ICER) for routine virological testing for HIV-positive patients on ART in East Africa.27 While we recognise that WTP estimation is an active area of research, with recent methods deriving a much lower WTP for Kenya (range of $74–1184, 2015 US dollars),36 we choose a WTP that reflects opportunity costs pertinent to this patient population.
Sensitivity analysis
In sensitivity analysis, we varied assumptions about intervention cost, cost of acquiring each additional participant and the WTP threshold to understand if and how ENBS and optimal sample size changed. Intervention cost was increased and decreased by 25%, 50% and 75% and cost of enrolling one participant was increased and decreased by 50%. We varied WTP across a plausible range benchmarked to a country's gross domestic product (GDP) per capita (ie, resource-rich countries have higher WTP than resource-limited countries) as recommended by the WHO (1–3 × GDP; US$1377–4130/QALY),37 and also performed threshold analyses in which WTP was varied beyond this plausible range.
Results
Primary results
For the base case scenario, the expected QALY and cost for the standard care scenario, risk reduction intervention and outreach intervention was 8.85 QALY and $10 913, 9.13 QALY and $12 339, and 8.96 QALY and $11 208, respectively (see table 2). For the risk reduction intervention when compared with no intervention, the ICER was $5098/QALY. For the outreach intervention compared with no intervention, the ICER was $2555/QALY.
Incremental cost-effectiveness ratio compared with standard care
For both the risk reduction and outreach interventions, EVSI was $0, which resulted in negative ENBS values, and accordingly a sample size of 0. This suggests that under base case assumptions the resources that would be expended on trials of these interventions are more likely to confer health benefit if they were instead spent on delivering the interventions themselves.
Sensitivity analysis
Results for the risk reduction study were relatively robust, with ENBS remaining negative across plausible ranges of WTP thresholds, cost to enrol one additional participant and intervention cost. However, if WTP was raised to ≥$4400/QALY, corresponding to a WTP above the recommendation by WHO for Kenya, ENBS and optimal sample size was positive (figure 2), meaning that a trial of a risk reduction intervention would be a worthwhile investment (ENBS=$4.3 million, population EVSI=$6.2 million and cost of research=$1.8 million). ENBS peaked at a WTP of $5200/QALY (ENBS=$517.2 million, population EVSI=$523.4 million and cost of research=$6.3 million), the point of greatest decision uncertainty and thus the point at which the most is potentially gained from additional research, at which point the optimal sample size was n=5500 (2750 per arm).
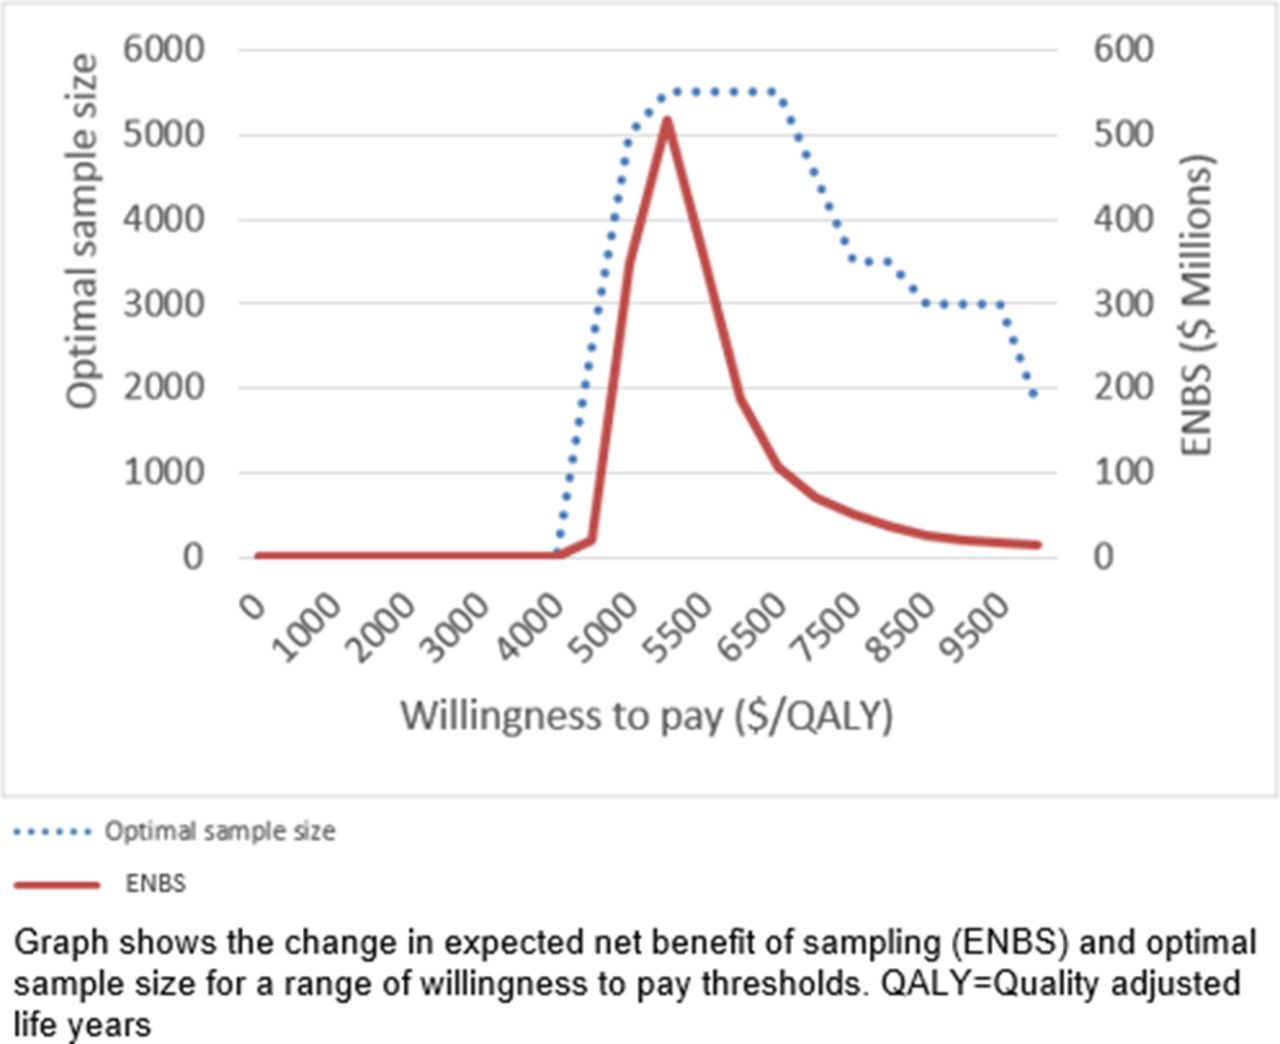
Sensitivity analysis for the risk reduction intervention.
Results for the outreach intervention study were even more robust, with ENBS remaining negative even at WTPs > $4400/QALY that enabled risk reduction intervention studies to become worthwhile investments.
Discussion
We found that investing in trials testing risk reduction interventions was not worthwhile assuming that the WTP threshold for an East African country falls below $4400/QALY. Only when WTP per QALY was greater than $4400 was the return on investing in trials positive because the additional knowledge gained by trials would then be sufficiently actionable (eg, realistic given budget constraints) and potentially lead to greater health benefits than would occur if those funds were instead redirected towards funding scaling interventions. Users can test their own assumptions about study budget, cost of sampling, duration of study, target population, lifetime of the intervention and WTP at http://torchresearch.org.
We found that investing in trials testing outreach interventions was also not worthwhile because the resulting gains in knowledge were unlikely to confer greater health benefits than would be achieved by redirecting those funds towards scaling existing interventions. However, unlike the results of our analyses with risk reduction interventions, our results regarding outreach interventions remained stable regardless of WTP assumptions.
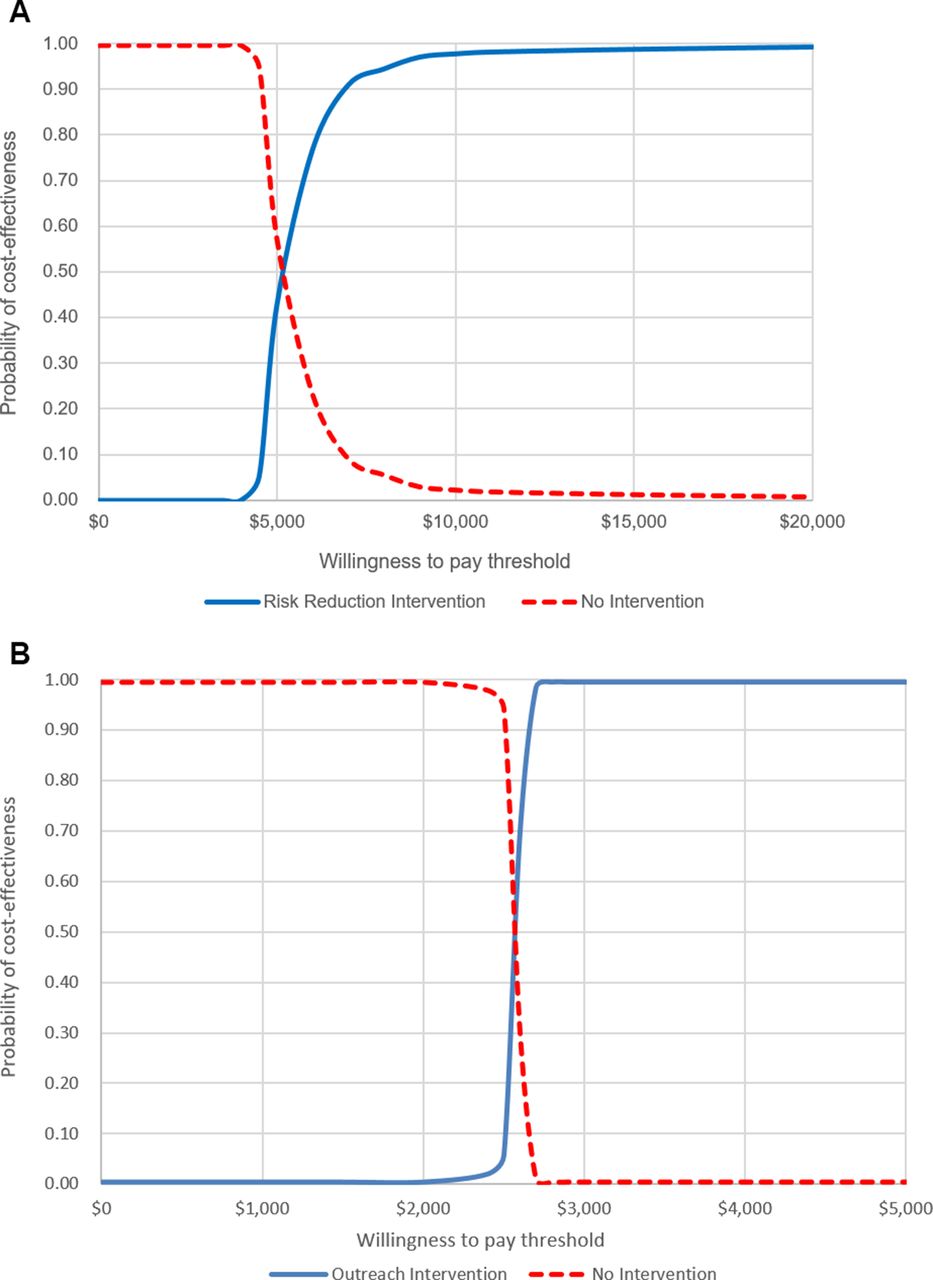
Taken together, our results suggest that sufficient evidence already exists about the probable effectiveness of risk reduction and outreach interventions to support decision-making under current circumstances, and additional information gained from a trial about each intervention's effectiveness will likely not change the current decision. The reason why an investment in a risk reduction intervention trial becomes potentially worthwhile when the WTP threshold reaches $4400 because it approaches the point at which the certitude about the intervention's cost-effectiveness is less clear and thus additional information can help with decision-making. Figure 3A, B illustrates this point.

Cost-effectiveness acceptability curves.
Prior research suggests that risk reduction interventions have a positive clinically relevant impact on life expectancy (gain of 0.6–1.6 years of life29 36). However, results are mixed over whether their implementation is the most efficient use of resources in sub-Saharan Africa. Kessler et al, using the same HIV model as in our study, shows that allocating resources towards complete expansion of ART to all HIV-positive people yielded a lower ICER compared with implementing a risk reduction intervention, suggesting ART expansion might be a more efficient strategy and its adoption prioritised over implementation of a risk reduction intervention.29 Although Kessler suggests that targeted retention programmes might be of value once a high degree of ART coverage is achieved. Losina et al report a somewhat lower ICER for a risk reduction intervention than the current study depending on the level of effectiveness and cost (ICERs=$1200–2500) rendering it cost-effective or of similar efficiency as ART expansion, and within WHO-recommended ranges for WTP. Therefore, it is possible that value of information analysis incorporating their results would yield inferences consistent with ours.
If high ART coverage could be achieved, such as through test and treat, it is possible that investments in a trial to test risk reduction and outreach interventions might be worthwhile if those interventions were more efficient (ie, lower ICER and closer to the WTP threshold) than the scenario we tested in which the interventions were applied to all patients. It might be possible to achieve greater efficiency through targeting, such as applying the risk reduction intervention to only those who are most likely to disengage or implementing more reliable mechanisms for ascertaining clinic transfers and death before triggering an outreach effort.
Our analyses has several limitations. First, we did not vary cost (ie, no cost distribution was used), namely due to the lack of such data. However, we did explore the uncertainty surrounding the cost data in sensitivity analysis by using wide ranges to see if and how results changed. We found that as the cost of the intervention either increased or decreased ENBS declined due to reduced decision uncertainty. For the cost of enrolling additional study participants, as one might expect when costs declined the optimal sample size increased and when the cost increased the optimal sample size decreased. Second, we did not vary all inputs in the HIV progression model primarily due to the large number of inputs which would have been impossible to achieve in a realistic timeframe. This could have led to an underestimation of the value of future research. In addition, it is possible that if a trial were to collect data to resolve additional uncertainties then perhaps the value of research would increase, although this possibility was not tested in this analysis. Third, and a concern in any modelling-based study or any quantitative evidence synthesis, is the difficulty in characterising uncertainty that is due to biased evidence rather than to sampling uncertainty. Our analysis does not include this potentially important factor. If the subsequent research avoids these biases and does not introduce other biases of equal or greater importance, the EVSI may be underestimated. Conversely, if the subsequent research worsens and/or introduces additional biases, the EVSI may be overestimated. The development of methods to systematically characterise evidentiary bias is an important area for future research. Fourth, the computational burden of value of information calculations limited our ability to estimate EVSI with perfect precision. Although with 1 million iterations we do feel that estimates come close and random noise has been minimised.
Conclusion
In summary, more research is not always needed, particularly when there is moderately robust prestudy belief about intervention effectiveness and little uncertainty about the value (cost-effectiveness) of the intervention.
References
Footnotes
Contributors All authors contributed to the study design, analysis, interpretation of results and critically reviewed the manuscript. JU drafted the manuscript. LL conducted the analysis and programming.
Funding National Institute on Alcohol Abuse and Addiction.
Competing interests None declared.
Provenance and peer review Not commissioned; externally peer reviewed.
Data sharing statement No additional data are available.
Correction notice This article has been corrected since it was first published. The weighting of some headings have been adjusted and scripting errors have been corrected in the abstract