Article Text

Abstract
Background The recent Ebola epidemic in West Africa strained existing healthcare systems well beyond their capacities due to the extreme volume and severity of illness of the patients. The implementation of innovative digital technologies within available care centres could potentially improve patient care as well as healthcare worker safety and effectiveness.
Methods We developed a Modular Wireless Patient Monitoring System (MWPMS) and conducted a proof of concept study in an Ebola treatment centre (ETC) in Makeni, Sierra Leone. The system was built around a wireless, multiparametric ‘band-aid’ patch sensor for continuous vital sign monitoring and transmission, plus sophisticated data analytics. Results were used to develop personalised analytics to support automated alerting of early changes in patient status.
Results During the 3-week study period, all eligible patients (n=26) admitted to the ETC were enrolled in the study, generating a total of 1838 hours of continuous vital sign data (mean of 67.8 hours/patient), including heart rate, heart rate variability, activity, respiratory rate, pulse transit time (inversely related to blood pressure), uncalibrated skin temperature and posture. All patients tolerated the patch sensor without problems. Manually determined and automated vital signs were well correlated. Algorithm-generated Multivariate Change Index, pulse transit time and arrhythmia burden demonstrated encouraging preliminary findings of important physiological changes, as did ECG waveform changes.
Conclusions In this proof of concept study, we were able to demonstrate that a portable, deployable system for continuous vital sign monitoring via a wireless, wearable sensor supported by a sophisticated, personalised analytics platform can provide high-acuity monitoring with a continuous, objective measure of physiological status of all patients that is achievable in virtually any healthcare setting, anywhere in the world.
This is an Open Access article distributed in accordance with the Creative Commons Attribution Non Commercial (CC BY-NC 4.0) license, which permits others to distribute, remix, adapt, build upon this work non-commercially, and license their derivative works on different terms, provided the original work is properly cited and the use is non-commercial. See: http://creativecommons.org/licenses/by-nc/4.0/
Statistics from Altmetric.com
Key questions
What is already known about this topic?
A key challenge to effective patient management in low-resource settings, and especially during the time of a healthcare crisis such as the recent Ebola epidemic in West Africa, is lack of sufficient healthcare workers and the resources necessary to provide for effective patient monitoring and tracking.
In Ebola treatment centres, tracking patient vital signs is labour intensive and physically challenging due to the need to wear personal protective equipment leading to infrequent monitoring, exposure risk and inefficient use of limited manpower.
What are the new findings?
We demonstrate that a portable, deployable system for continuous vital sign monitoring via a wireless, wearable sensor supported by a sophisticated, personalised analytics platform can provide high-acuity monitoring with a continuous, objective measure of physiological status in a remote setting.
Algorithm-generated parameters through an analytic platform show promise for enhancing individualised alerting and management capabilities.
Recommendations for policy
The system evaluated offers the ability to provide intensive monitoring and alerting capability in any healthcare setting virtually anywhere in the world that following further validation could significantly improve patient outcomes while extending healthcare worker efficiency and safety.
Introduction
Healthcare workers in low-income and middle-income regions of the world are a scarce resource.1 This chronic shortage is further compounded in the setting of a healthcare crisis that creates a marked increase in demand for healthcare services in a high-acuity, critical care setting where higher levels of staffing and resources are required to provide adequate care.2 The recent Ebola virus disease (EVD) epidemic in West Africa strained existing local healthcare systems well beyond their capacities due to the extreme volume and severity of illness of the patients, leading to an unprecedented humanitarian tragedy.3 Doubly tragic was the devastating toll taken on the disproportionately affected healthcare workers caring for patients with EVD.4
Over the past decade, there have been remarkable advances in digital communication capabilities that could potentially help address many of the challenges created through a lack of healthcare resources. For example, over the past decade, the rapid proliferation of cellular networks throughout sub-Saharan Africa has enabled a rapid jump to the digital age while foregoing the need for landlines and their associated infrastructure. Nonetheless, many healthcare facilities in rural areas in Africa and elsewhere in the world lack the digital infrastructure necessary to take full advantage of new technologies. Therefore, to supplement the ever-expanding wireless infrastructure, the ability to transport and deploy a local wireless infrastructure provides worldwide ability to take advantage of a host of innovative medical-grade mobile health (mHealth) devices now available that enable the implementation of novel solutions for critical gaps in care, especially, but not only, in times of crisis.5
The recent EVD epidemic in West Africa created a situation especially in need of novel solutions: the number and acuity of patients overwhelmed available healthcare resources, the intensive monitoring capabilities necessary to optimally care for critically ill individuals were scarce, and the high transmissibility of the virus required personal protective equipment (PPE) use that significantly impacted the time and ability of healthcare providers to interact with patients. In order to address some of these enormous challenges, we developed a Modular Wireless Patient Monitoring System (MWPMS) and conducted a proof of concept study, through the support of the Ebola Grand Challenge, to validate a novel system of care in an Ebola treatment centre (ETC). The MWPMS was built around a wireless, multiparametric ‘band-aid’ sensor for continuous vital sign monitoring and transmission, plus a sophisticated data analytic platform in order to develop personalised predictive analytics to support automated alerting of early changes in patient status and allow for the better informed triaging of scarce resources. The ultimate goal of the MWPMS is to allow for improved, automated patient oversight, enabling increased timeliness of care for acutely ill individuals. Simultaneously, it will improve healthcare worker safety and productivity by minimising unnecessary exposure risks and allowing them to concentrate on care activities that truly require a human touch.
Methods
Funding for this study was provided through ‘Fighting Ebola: A Grand Challenge for Development’, launched by the US Agency for International Development (USAID) in partnership with the White House Office of Science and Technology, the Centers for Disease Control and Prevention, and the Department of Defense. It was carried out in collaboration with the humanitarian organisation International Medical Corps.
ETC—Makeni, Sierra Leone
An ETC opened outside Makeni, Sierra Leone in December 2014, funded by the UK's Department for International Development and run by International Medical Corps was the site of this study6 (see online supplementary figure S1). It was a 50-bed facility that provided care 24/7 by national and international workers distributed into three primary teams based on principal responsibilities: Medical, Water, Hygiene and Sanitation (WASH) and Psychosocial.
Supplementary figures
Individuals suspected of potentially having Ebola based on their contact history, presence of a fever, signs of easy bleeding and systemic symptoms were transferred to the ETC and evaluated in a triage zone for admission. Individuals meeting admission criteria, who were aged 18 years or older, were able to understand the informed consent, and without a prior history of skin sensitivity to adhesives, were approached for enrolment and informed consent was obtained. The informed consent document was written in English, the official language of Sierra Leone; however, for the majority of individuals, a member of the medical team explained each component of the informed consent to them in their local language to ensure full understanding.
On the day of admission and 24 hours later, all patients were tested for Ebola virus in their bloodstream by quantitative PCR. After two negative tests, and if clinically stable, patients were discharged. For anyone testing positive, they were transferred to the confirmed ward of the ETC and remained hospitalised until they recovered enough to be discharged, which was on average ∼16 days. All individuals also underwent rapid diagnostic testing for malaria, which was reported as either positive or negative, although all admitted patients were empirically treated with a combination antimalarial agent (Coartem) during their admission to the ETC. In addition, all admitted patients received empiric antibiotics, antipyretics and oral or intravenous rehydration based on their volume output and degree of dehydration.7
Medical team members in full PPE manually obtained vital signs at the time of admission and then routinely three times a day. Blood pressure values were never measured. Temperature was obtained by infrared thermometer, pulse by radial artery palpation and respiratory rate by observation.
Personalised physiology analytics
For data extraction, storage, analysis, visualisation and initial development of a personalised, predictive, automated alerting tool, we used the physIQ (http://www.physiq.com) data analytics platform, known as PPA for personalised physiology analytics. Their technology is based on machine learning algorithms that are purely data driven and can be applied to a wide range of vital signs parameters. Using the biosignal waveform data from any wearable sensor set, physIQ feature extraction algorithms generated the following parameters at 1 min intervals: heart rate, heart rate variability (both time domain and spectral analysis), activity, respiratory rate, pulse transit time (PTT; inversely related to blood pressure), posture, ECG quality metric and arrhythmia burden. Data quality is based on the ECG signal since many of the vital signs are derived from the ECG waveform. An algorithm is applied to the ECG signal that assesses the ECG information signals strength, motion artefact content and noise levels over 1 min windows of the data. This results in a quality metric that ranges from 0 to 100% for each min data window. If the metric falls below 75%, the corresponding 1 min data window is rejected for use in calculating vital signs from the raw biosignal data.
PPA, cleared by the US Food and Drug Administration in June 2015, is used to detect subtle changes in an individual's physiological characteristics from learnt baseline physiological behaviour. This is accomplished by detecting changes in the inter-relationships between parameters, rather than just examining parameters individually relative to a population norm or statistic. Using machine learning technology known as similarity-based modelling (SBM) each patient's current vital signs are compared with his or her unique baseline in real time to develop a series of residuals.8 ,9 These residuals are then fused into a single index—the Multivariate Change Index (MCI). The MCI represents the likelihood of change in the patient's physiology over time relative to the learnt baseline, identifying the earliest signs, often presymptomatic, of an improving or worsening medical condition that can be graphically presented as a time trend to healthcare workers. The baseline physiology learnt by SBM for each patient was based on vital signs data collected during the first day of monitoring to capture a full diurnal cycle of physiological activity. As it was unknown at the time of admission the clinical trajectory the patient would follow a version of MCI was applied that generates a signed likelihood of change where the magnitude is the likelihood of change and the sign is indicative of improved health conditions (positive) or degraded health conditions (negative). The sign is driven by the patterns produced across the multiparameter SBM residuals at each instant in time. If the monitored vital signs are behaving similarly to the baseline, the residual values will all be close to zero and the MCI will be close to zero, indicating no change in physiology. However, if the monitored vital signs begin to deviate from the baseline, one or more of the residuals will increase in magnitude and will be biased either positive or negative relative to the amount of change seen in each vital sign from the baseline period. This pattern of positive, negative and near-zero residual components forms the patterns that drive the sign of MCI. A detailed explanation of MCI and determination of baseline deviation can be found in ref. 9
Wearable sensor
For this proof of concept project, we used the MultiSense patch being developed by Rhythm Diagnostics Systems (http://www.rhythmdiagnosticsystems.com). The MultiSense is a self-contained, battery-powered, flexible strip, measuring 4×1.2 inches and weighing <15 g (see supplementary figure S2). It is waterproof with a patented adhesive for reliable adherence to the chest in most situations. It is able to continuously and simultaneously track and store the following biosignal waveform data: ECG (sampled at 256 Hz), three-dimensional accelerometer (16 Hz), uncalibrated skin temperature (4 Hz), red and infrared photoplethysmography (PPG; 32 Hz). For this study, the majority of the patches used were first-generation, memory-only devices that stored all physiological data in on-board memory and could be worn for up to 10 days with the data then downloaded via Universal Serial Bus (USB) once removed. To demonstrate its efficacy for the continuous, real-time streaming of vital signs, the second-generation MultiSense was used for two patients. This device is otherwise identical to the first-generation device with the addition of being Bluetooth-enabled. For this project, an Android device running the physIQ app, without cellular connectivity but with Bluetooth and Wi-Fi, was used to collect data from the patch and transmit it from the contaminated area (red zone) to the clean area (green zone) where personal protective gear was not required. The Android device was maintained by the patient's bedside.
Portable, deployable monitoring infrastructure
Basic information technology (IT) infrastructure was limited in the Makeni ETC, as it would be expected to be in many settings requiring a rapid medical response. As a result, one of the fundamental requirements of this project was to engineer and produce a portable, self-contained ‘system in a trunk’ providing all required IT infrastructure except power. The MWPMS needed to be readily shipped and deployable in remote locations without support capabilities. The end result was a system designed to fit into a Transportation Safety Administration-approved container that could be checked as baggage on a commercial airline (see online supplementary figure S3). The prototype system contained a hardened Panasonic Tough Book laptop, preloaded and configured to run the physIQ PPA platform for remote patient monitoring.
For this project, two communication systems were provided. The first was a dedicated private Wi-Fi network that provided communication for the wireless patient-worn devices and for the tablets used by the clinicians. A second satellite data link was provided for remote system administration that eliminated the need for onsite technical staff. For future projects, the satellite link would also allow for the patient population to be securely monitored by clinical staff throughout the world.
The laptop was connected to a hardened self-contained network hub that provided the entire network routing and switching for the system. From the network hub, the Cat6 Ethernet cable was run up to 300 ft to a weatherproof Wi-Fi radio attached to a high gain antenna. The radio and antenna combination provided a Wi-Fi network that covered the entire Ebola Treatment Unit (ETU) when centrally located. Power over Ethernet was used to power the radio from the network hub, eliminating the need for any additional power cabling to be run to the radio. The satellite link used a Hughes 9502 Integrated BGAN radio, which allowed physIQ staff in Naperville, Illinois, USA, to remotely monitor and maintain the system in Sierra Leone.
Since sensor data were received over the Wi-Fi network, they were stored in a time-series database on the Tough Book and processed for clinician review by the physIQ PPA platform. Via the two provided Wi-Fi enabled tablets, clinicians could then view, while in the green zone, the vitals from the patients as well as the trending MCI.
Statistical analysis
Descriptive statistics were used to describe demographic and clinical characteristics such as coinfections. Pearson's correlation coefficients were determined for relationship between continuously sensed and manually determined vital signs. Manually measured vital signs included heart rate (peripheral pulse), respiration rate (by observation) and temperature. The time stamps for manually measured vital signs where assigned after patient rounds were completed, and could be off from the actual time of measurement by 20 min or more. To compare to the continuous vital signs measurements, trimmed mean averages of the continuous vital signs were calculated over a time window of ±20 min from the reported manually measured vital signs time stamp. The trimmed mean was calculated by taking the average of the continuous vital signs data in a 40 min window after removing the upper and lower 10% of the samples. Some manually measured vital signs occurred outside the period of actual continuous monitoring. Those samples were ignored. The remaining manual vital signs samples and continuous vital signs averages were analysed using Pearson's correlation coefficient over the patient population. In the case of temperature, since the continuous skin temperature measurement is uncalibrated, the difference between the mean of the manually measured temperatures and the continuously measured temperatures for each patient was calculated and used to offset the uncalibrated readings before applying the Pearson's correlation coefficient analysis to temperature.
Results
All healthcare providers were trained in the study purpose, obtaining informed consent, sensor placement and its removal during ∼15 min training sessions for each of the four medical teams.
During the 3-week study period (25 July to 13 August 2015), all eligible patients (n=26) admitted to the ETC were enrolled in the study. The median age was 32.5 years, with the youngest aged 20 and the oldest 70. Thirty-five per cent were female and the average weight was 54 kg (119 pounds). Presenting symptoms, admission vital signs and diagnoses are presented in table 1. All patients were monitored for the duration of their admission except for the two Ebola-positive patients due to the limited time window for study. Patients without Ebola were monitored on average for 70 hours, whereas those with Ebola were monitored for ∼120 hours. All patients survived their admission, although the two patients with Ebola were not discharged until ∼1 week following the conclusion of the study period.
Baseline characteristics of monitored patients
All patients enrolled in the study had the sensor patch successfully placed and removed by a healthcare worker while in full PPE. All 26 patients successfully wore the patch for the duration of the study without any adverse reactions or symptoms of discomfort. For one patient, no data were retrievable due to a presumed battery drain on the patch prior to placement. For two individuals, the two Ebola-positive patients, their initial patches fell off within the first 24 hours of wearing them. The reason for this is unclear and may have been due to excessive sweating or initial placement issues. They were replaced, with the standard patch adhesive reinforced with a liquid colostomy adhesive, and there were no further issues with adhesion.
A total of 1838 hours of continuous multiparametric waveform data were collected (a mean of 67.8 hours per patient), with 91% of the data determined by the physIQ PPA to be of good quality, with quality determined by passing an ECG signal quality test for usability. Online supplementary figure S4 demonstrates the total hours of data collected per individual, and the percentage of good quality data per individual. A screenshot of the streamed waveforms is also shown in online supplementary figure S5.
Comparison to standard vital signs
Among the 25 monitored patients, a total of 112 temperature readings, 111 pulse measurements and 111 respiratory rate measurements were manually collected by the Medical team and recorded. The closest continuously collected vital sign was compared with each manual measurement to assess the level of agreement between the two independent measurement approaches (see online supplementary figure S6). The correlation between temperature measured by the infrared thermometer and the sensor patch was very strong (R=0.99, p<0.001), whereas the correlation for heart rate (R=0.75, p<0.001) and respiratory rate (R=0.83, p<0.001) were less strong but still robust.
Continuous blood pressure trends
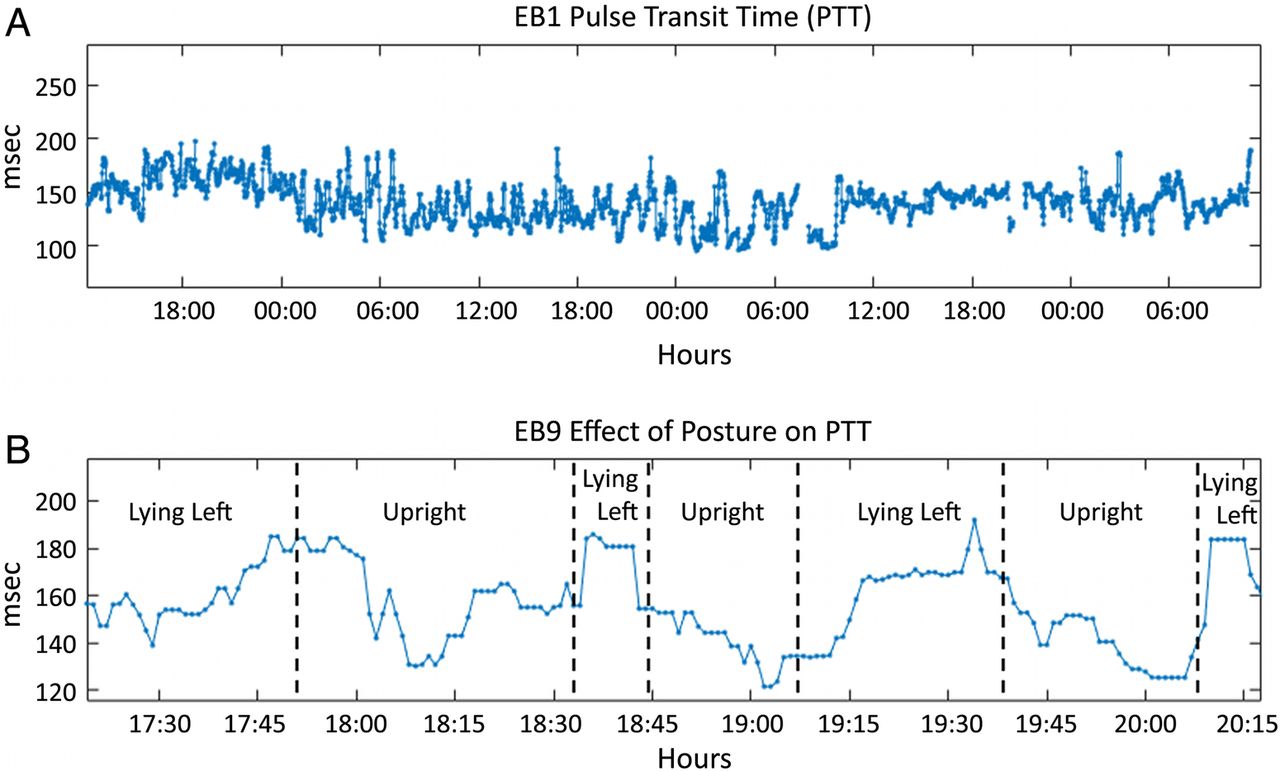
Using the ECG and infrared PPG signal, PTT was derived as the inverse of the blood pressure trend. This allowed for the continuous tracking of relative blood pressure and, since the sensor patch also allowed for the determination of posture and changes in position, changes in blood pressure associated with postural changes when transitioning from the lying to the standing position (figure 1).

Representative tracing of the trend in pulse transition time over time showing its variation over a multiday period (A), and a zoomed in view to show changes with posture (B).
Multivariate Change Index
In order to explore the potential for PPA to provide an early indication for decompensation in an individual patient, heart rate, heart rate variability, respiratory rate and activity were modelled to develop a MCI for each individual that was updated every minute and then averaged over 1 hour time windows. An individual's ‘baseline’ interaction between these measures was learnt over the first day of monitoring and subsequent improvements (+) or degradation (−) in individual vital signs and their relative contribution to the MCI allowed for the overall physiological status trend of that individual to be followed. These trends in physiological status are relative to the trained baseline and so even though the patient is in a degraded health state during training, the MCI indicates improvement or degradation from that physiological state, making it possible to determine if treatment is having a positive or negative effect. Figure 2 shows the MCI trends for both Ebola-positive patients starting just after the baseline training period. An MCI value near zero indicates that the interactions between vital signs are very similar to the baseline conditions, and so the physiological state is most likely close to the baseline state. In case (A) of figure 2, the MCI exhibits this behaviour for nearly 1.5 days. After that time, the patient's MCI waxes and wanes but is generally indicative of improved vital signs behaviour, given that it is largely positive. The MCI trend for the second patient (figure 2B) behaves quite differently. Here the negative MCI trend reflects vital signs interactions that are indicative of degrading conditions relative to the baseline period for the first 2.5 days. During the last day of monitoring, the MCI trends towards zero, which means that the patient's vital signs interactions are returning to baseline conditions. In the event of patient decompensation, the MCI would most likely trend persistency much closer to a value of −1. This was not seen during the monitoring period, which was consistent with the clinical findings.

Representative tracing of the trend in an Ebola-positive patient's MCI over the monitoring period. MCI, Multivariate Change Index; PPA, personalised physiology analytics.
ECG findings
In patients with EVD, replacement of fluid and electrolyte losses is the cornerstone of therapy.10 ,11 In the ETC, there was no ability to measure electrolyte levels, so we explored if changes in the ECG over time might provide guidance to electrolyte status.
Abnormalities in serum potassium levels are associated with an increased risk of cardiac arrhythmias, especially in the setting of other physiological stresses.12 We were able to automate the identification of ectopic beats and trend their frequency over time. Figure 3 shows the trend of per minute arrhythmia burden along with a 30 min moving average in a patient with Ebola over a ∼4 days period as they improved clinically with decreasing fluid and electrolyte replacement needs.
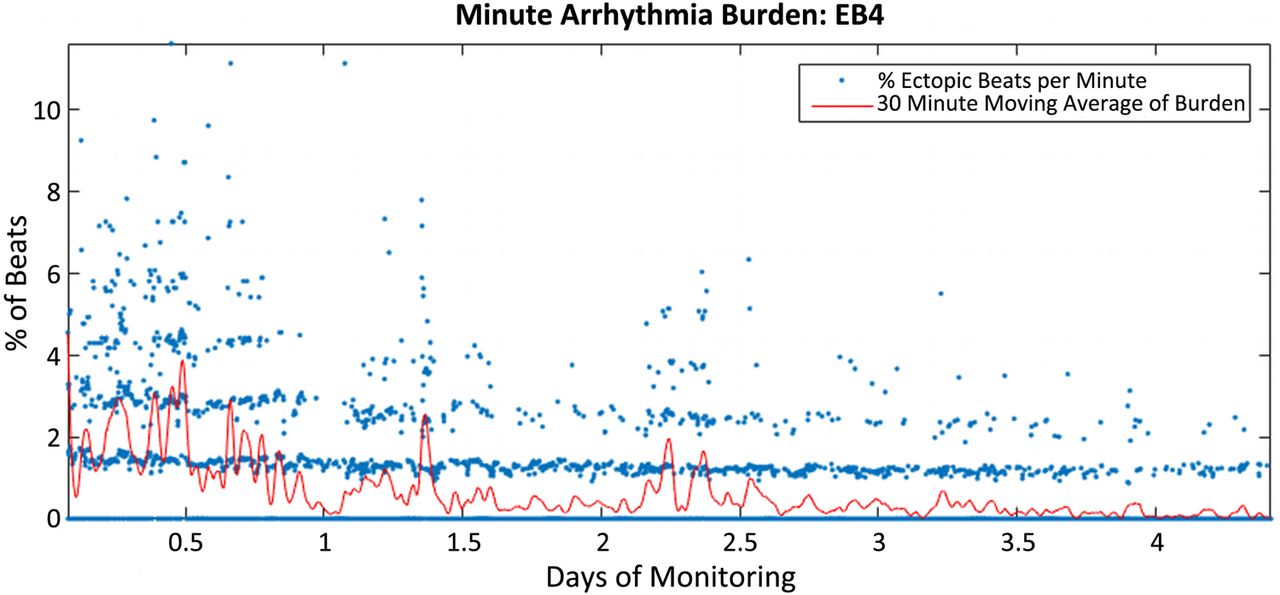
Minute arrhythmia burden of a patient with Ebola over a period of ∼4 days with decreasing fluid and electrolyte replacement needs. The blue is the per cent of beats that are ectopic each minute. The red line is a 30 min moving average of the minute burden data.
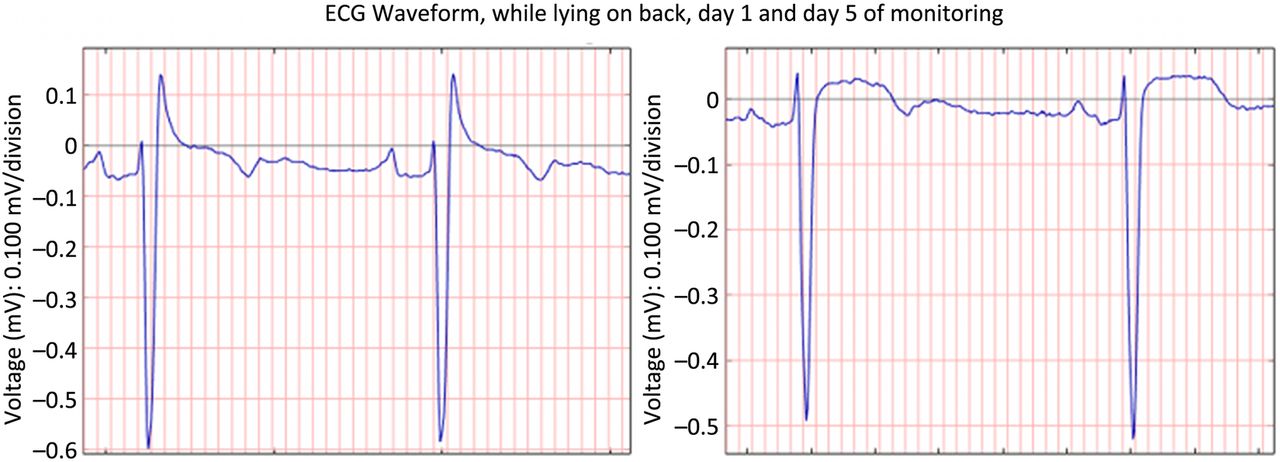
Changes in the waveform are also common in the setting of electrolyte abnormalities but have also been described as being associated with viral infections, including viral haemorrhagic fever.13 ,14 By comparing ECG waveforms over time while an individual was in the same position, we are able to demonstrate that it is possible to identify waveform changes (figure 4), although we were unable to identify a clinical correlate in this setting.
Change in ECG waveform over time in a patient with Ebola infection.
Discussion
Through this proof of concept study, we have successfully demonstrated that wireless, multiparametric monitoring of patients admitted to an ETC in rural Sierra Leone is both feasible and highly desirable by healthcare workers. While there are obvious short-term clinical benefits to having the capability to continuously monitor the vital signs of patients with possibly life-threatening infections, our results support a much greater potential benefit to patients, providers and researchers through the incorporation of real-time data analytics. The large number of promising exploratory findings for pulse transition time, arrhythmia burden, ECG waveform changes and MCI all support a great potential for improving patient care well beyond the current state of the art by allowing for a more rapid response at the earliest signs of decompensation that are unique to that individual – not just for use in the setting of EVD, but rather in any healthcare setting (low-resource or high-resource) where patient decompensation is possible and its earliest recognition is desirable.
It has been said that the only good news to come out of the recent EVD epidemic is that it may serve as a wake-up call so that we can be better prepared for future similar, if not worse, epidemics that are certain to come.15 Having the capability to rapidly deploy to anywhere in the world a ‘wireless patient monitoring system in a box’ that enables simplified, continuous monitoring of multiple vital signs, and potentially allows for automated, individualised alerting of decompensation, is one way to be better prepared. The current study successfully demonstrated that this type of infrastructure could be prepackaged and deployed into low-resourced areas in response to natural disasters or epidemics. Also, although not formally studied, local healthcare worker support was uniformly enthusiastic. Future work will allow for a formal evaluation of its impact on workflow and satisfaction.
Through the limited yet promising work carried out in this study, we have shown that sensor placement, patient tolerance and the capacity to wirelessly transmit vital signs continuously from a patient care zone to a clean zone are fairly easily achievable. Owing to the relative clinical stability of the patients enrolled, including the patients with EVD, we were not able to definitively demonstrate the direct clinical benefit of incorporating sophisticated data analytics into the processing of these vital sign data, although our results provide compelling evidence of their potential value: relative blood pressure changes over time and with postural changes would inform relative fluid status including early signs of sepsis or blood loss; arrhythmia burden and ECG waveform changes could be a sensitive indicator of electrolyte disturbances or even direct myocardial insult. Most promising would be the continuous tracking of the unique interplay of multiple parameters in a specific individual as expressed by their MCI. The MCI has previously been studied in remote clinical surveillance of individuals with chronic conditions susceptible to exacerbations and found to have high sensitivity to changes in physiological dynamics and a very low false alert burden.9 The value of MCI in the current scenario is that it can provide an early indication of decompensation and also provide caregivers a vigilant, objective measure of physiological status for all monitored patients in the healthcare facility relative to their presenting state. This enables more effective and efficient triage in environments with limited resources and overburdened healthcare workers. Further work in a larger population with greater variability in clinical course (eg, suspected sepsis population) will help establish the unique value of these derived parameters for the patient and healthcare worker in the acute management setting.
This work was possible only due to the relatively remarkable progress that has been made over the past several years in the development of miniaturised, wireless and wearable sensors. These advances in sensor hardware continue to accelerate with a simultaneous decrease in their cost: over the past decade, the cost of a microelectromechanical systems sensor has been cut by over half from US$1.30 to US$0.60.16 The MultiSense patch used in our study is one example of the tremendous progress that has been made in wearable sensors, and is one of approximately a half-dozen single patch, multiparametric sensors currently available. The MultiSense patch was unique in its incorporation of PPG at the time we designed our programme, although another patch with similar characteristics was recently announced with regulatory approval.17 This represents the continuously evolving and rapidly changing environment of wearable sensors that expand well beyond just patches. There are a number of multiparametric sensors in various stages of development that can be worn on the wrist, finger, head, skin or as a earbud.5 As with virtually all new technologies, it is likely that over time the current selection and quality of sensors will continue to expand while the costs drop. As the sensors become more and more commoditised, the analytic platform, agnostic to the wireless source of data, will play a central role in optimising the value of a comprehensive system for improving patient outcomes and healthcare worker efficacy.
This proof of concept project successfully demonstrated that the infrastructure and state-of-the art technology used in the MWPMS could be prepackaged and deployed into low-resourced areas in response to natural disasters or epidemics and used by local resources. Since this prototype system was developed using commonly available, off-the-self components and hand built, as deployed the system cost ∼$15 000. We recognise that this is too costly for widespread deployment in low-resource areas. However, in the next phase, it is envisioned that this system could be designed and optimised for mass production for under $5000 per unit. Since in our experience training required <30 min for a group of medical providers, we do not anticipate substantial additional costs beyond the hardware needs of the sensors and servers, but as wireless networks become even more ubiquitous and as sensors further decrease in price, the overall cost will most likely continue to fall substantially.18 Future work with this system will be critical for a better understanding of costs in various clinical settings as well as the cost-benefit.
Limitations
The true benefit of the MWPMS developed can only be fully explored in future work using sensors with real-time streaming of vital signs via a device with regulatory approval. This study set-up and equipment did not allow us to explore the usability and clinical benefit of such a system. Nonetheless, the work described here is a critically important first step in supporting the feasibility of larger and longer effectiveness studies.
Conclusion
In this small proof of concept study, carried out in an ETC in Makeni, Sierra Leone, we were able to demonstrate that continuous vital sign monitoring via a wireless, wearable sensor supported by the PPA platform can provide high-acuity monitoring with a continuous, objective measure of physiological status of all patients, and is achievable in virtually any healthcare setting, anywhere in the world.
Acknowledgments
The authors would like to thank International Medical Corps for their support, and most especially the many Makeni Ebola Treatment Center healthcare workers and patients. The work described here was supported by the US Agency for International Development (USAID) through the Grand Ebola Challenge. SRS’ work is also supported by the National Institutes of Health (NIH)/National Center for Advancing Translational Sciences grant UL1TR001114 and a grant from the Qualcomm Foundation.
References
Footnotes
Handling editor Seye Abimbola
Twitter Follow Steven Steinhubl at @SteveSteinhubl
Contributors All coauthors played a role in designing some aspects of the trial. SRS, DF, CC and ACL collected the data. SWW, GC and SRS carried out data analytics and drafted the first draft of the manuscript. All authors critically reviewed and revised the manuscript.
Funding From the USAID's Fighting Ebola: A Grand Challenge for Development in partnership with the White House Office of Science and Technology, the Centers for Disease Control and Prevention, and the US Department of Defense (award # AID-OAA-F-15-00022).
Competing interests SWW, CC and GC are full-time employees of physIQ.
Ethics approval Ethical oversight and approval was provided by the Sierra Leone Ethics Scientific Review Committee.
Provenance and peer review Not commissioned; externally peer reviewed.
Data sharing statement Patient monitoring data will be made available to interested researchers.