Article Text

Abstract
Introduction Rapid increases in the trade of global red and processed meat impede international efforts toward sustainable diets by increasing meat consumption. However, little research has examined cross-country variations in diet-related non-communicable diseases (NCDs) because of meat trade. We aimed to examine the impact of red and processed meat trade on diet-related NCDs and to identify which countries are particularly vulnerable to diet-related NCDs due to red and processed meat trade.
Methods By selecting 14 red meat and six processed meat items, we investigated bilateral meat trade flows across 154 countries. Then, we integrated health data and information on red and processed meat trade to quantify the country-specific burden of diet-related NCDs attributable to the meat trade using a comparative risk assessment framework.
Results Results show that global increases in red and processed meat trade contributed to the abrupt increase of diet-related NCDs, and the attributable burden of diet-related NCDs had large geographical variations among countries. We also identified responsible exporting countries that increase diet-related NCD risks in importing countries. Over the period from 1993 to 2018, island countries in the Caribbean and Oceania were particularly vulnerable to diet-related NCD incidents and mortality due to large meat imports. In addition, countries in Northern and Eastern Europe have exceedingly increased attributable death and disability-adjusted life year rates via meat imports.
Conclusion Our findings suggest that both exporters and importers must urgently undertake cross-sectoral actions to reduce the meat trade’s health impacts. To prevent unintended health consequences due to red and processed meat trade, future interventions need to integrate health policies with agricultural and trade policies by cooperating with both responsible exporting and importing countries.
- geographic information systems
Data availability statement
Data area available in a pulic, open access respository. All data analyzed in this study are available on reasonable request. All data analyzed during the current study are available from the corresponding author on reasonable request. Data that support the findings of this study are available within the paper and its Supplementary Information.
This is an open access article distributed in accordance with the Creative Commons Attribution Non Commercial (CC BY-NC 4.0) license, which permits others to distribute, remix, adapt, build upon this work non-commercially, and license their derivative works on different terms, provided the original work is properly cited, appropriate credit is given, any changes made indicated, and the use is non-commercial. See: http://creativecommons.org/licenses/by-nc/4.0/.
Statistics from Altmetric.com
Key questions
What is already known?
The world has begun to pursue sustainable diets for both human health and environmental sustainability with fewer animal-based foods.
Rapid increases in the meat trade interfere with international efforts toward sustainable diets, but little global research has examined cross-country variations in diet-related non-communicable diseases (NCDs) due to meat trade.
What are the new findings?
The increased intake of red and processed meat products via trade caused the abrupt increase of diet-related NCDs, and the attributable burden of diet-related NCDs had large geographical variations among countries.
The health impacts of red and processed meat trade have substantially risen in Northern and Eastern European countries as well as island countries in the Caribbean and Oceania.
What do the new findings imply?
Results suggest that both exporters and importers must urgently undertake cross-sectoral actions to reduce the meat trade’s negative health impacts.
Future interventions need to integrate health policies with agricultural and trade policies by cooperating with the responsible exporting and importing countries.
Introduction
Since the world has begun to pursue sustainable diets for both human health and environmental sustainability, various guidelines consistently recommend a diet with fewer animal-based foods and more plant-based ones.1–4 However, it would still be hard to achieve such sustainable diets even if the increase in red and processed meat consumption by individual consumers were small.1 5 With continuous urbanization and income growth, global red and processed meat trade has exponentially increased to meet rising meat consumption.6–9 Red and processed meat trade plays a substantial role in balancing nutrition and meat availability across the world, but it causes unintended environmental and health consequences worldwide.10 Red meat production for export exerts significant pressures on land-use change and biodiversity loss in exporting countries.11–13 Furthermore, increases in red and processed meat consumption via trade can exacerbate the spread of diet-related non-communicable diseases (NCDs) in importing countries.14–16 Thus, rapid increases in global red and processed meat trade complicate efforts to achieve sustainable diets.
The dynamics of red and processed meat trade across countries may lead to geographical variations of changes in diet-related NCD risks. In particular, increasing red and processed meat consumption via trade can contribute to a substantial rise in the burden of diet-related NCDs,1 14 17 including colorectal cancer,18 diabetes mellitus19 and coronary heart disease.20 Therefore, identifying the different impacts of red and processed meat trade on diet-related NCDs across countries becomes essential to global pursuits of sustainable diets. However, previous studies have not determined the spatial and temporal changes in diet-related NCD risks with different levels of red and processed meat trade, which can influence per capita meat consumption as dietary risk factors for NCDs.
To fill this knowledge gap, we answer two research questions based on a comparative risk assessment framework: (1) What is the impact of red and processed meat trade on diet-related NCDs? and (2) Which countries are particularly vulnerable to diet-related NCDs due to red and processed meat trade? The comparative risk assessment framework is beneficial in its ability to determine the country-level impacts of changes in per capita red and processed meat consumption via trade on diet-related NCD incidence and mortality. By integrating bilateral meat trade flows and the comparative risk assessment in 154 countries from 1993 to 2018, we quantify the country-specific changes in diet-related NCD incidence and mortality due to red and processed meat trade as well as identify each country’s responsible exporting partners simultaneously.
Methods
Linking meat trade and health analyses
Global red and processed meat trade datasets were obtained from the UN Food and Agriculture Organization (FAO).21 The FAO dataset includes information about meat production and meat trade matrices. The basic unit of meat production and trade is the physical volume in metric tons. We selected 14 red meat items and six processed meat items over the period from 1993 to 2018 (online supplemental table 1). Specifically, red meat items mainly included beef, pork, lamb and goat, while we excluded poultry, fish, eggs and processed meats. Processed meat items included red meat products preserved by smoking, salting, curing or chemical preservatives, primarily from beef and pork. In the FAO food trade matrix dataset, we used the meat import matrix data to get the quantities of meat exported and imported because importing countries are subjected to tariffs and have an incentive to measure the imported items accurately. The meat export matrix data were only used to fill data gaps in the meat import matrix dataset. Using the FAO food balance sheet, we also considered meat wastes regarding other uses for non-food purposes and losses during storage, transportation and processing. We did so because the amount of meat available for diets is closely linked with the amount of meats arriving to the consumer.22
Supplemental material
In addition to red and processed meat trade and waste data, we obtained red and processed meat production data from the FAOSTAT.21 Along with these meat data, we also obtained data about population sizes from the UN Population Division.23 Based on the data availability, we selected 154 countries from 1993 to 2018. Then, we calculated annual red and processed meat availability, respectively, using the quantities of meat production, exports, imports and waste in each country. The quantities of meat trade can differently influence per capita meat consumption and thus change dietary risk factors across countries. For the comparative risk assessment, we converted annual red and processed meat availability to per capita red and processed meat consumption (g/day/capita), respectively, in two different scenarios. Per capita meat consumption in the baseline scenario depends on both domestic meat production and trade, while meat consumption in the counterfactual (or alternative) scenario only depends on meat production for domestic supply.
Chronic diet-related NCDs
In this study, we concentrated on two dietary risk factors (i.e., diets high in red meat and processed meat) with changes in red and processed meat trade and their impacts on three chronic diet-related NCDs, respectively. Based on previous findings from dose-response meta-analyses and prospective cohort studies, we included three chronic diet-related NCDs regarding red and processed meat consumption: colorectal cancer, diabetes mellitus type 2 and ischaemic heart disease.24 25 Red and processed meat consumption is one of the leading risk factors for increased occurrences of colorectal cancer,18 26 diabetes mellitus type 219 and coronary heart disease.20 27 28 The above NCDs are closely linked to higher meat consumption via trade and thus were relevant to this study.
Since our two dietary risk factors mainly contribute to chronic NCDs for adults, we focused on the health impacts of changes in the risk factors on adults who are older than 25. We obtained country-level population data with 5-year ranged age groups from the UN Population Division.23 The Global Burden of Disease (GBD) project provides the number of disease-specific deaths and disability-adjusted life years (DALYs) associated with the two dietary risk factors at five-age intervals (aged ≥25 years) of each country from 1993 to 2018.17 These two metrics were estimated based on a theoretical minimum risk level that minimises the degree of dietary risks at the population level (any intake of red meat and processed meat).
Comparative risk assessment framework
We used a comparative risk assessment framework to estimate attributable burden regarding changes in red and processed meat consumption via trade with chronic diet-related NCDs (i.e., colorectal cancer, diabetes mellitus type 2 and ischaemic heart disease). The comparative risk assessment approach that developed for the GBD project provides a way to quantify causal changes between meat trade and diet-related NCDs over time.17 In addition, attributable burden is defined as the difference between current disease burden and disease burden with counterfactual risk exposures.17 29 In this study, we used the number of deaths and DALYs to represent the metrics of attributable burden.
We measured the burden of disease attributable to two dietary risk factors by calculating proportional attributable fractions (PAFs). The PAF is defined as the proportional reduction in certain disease cases that result from the change in a risk exposure from a baseline scenario (consumption from both domestic meat production and trade) to a counterfactual scenario (consumption from only domestic meat production for domestic supply).17 30 The basic formula for the PAF with a continuous risk factor is shown as:
 (1)
(1)
PAFcrasgt is the population attributable fraction of disease burden for cause c from risk factor r for age group a, sex s and region g at year t. RRcrasg is the relative risk of disease burden (deaths or DALYs in this study) for cause c from risk factor r with age group a, sex s and region g on the range of exposure level x, from the lowest exposure l to the highest exposure h. Pcrasgt is the population distribution by exposure level x for age group a, sex s and region g at year t in the baseline scenario. P'crasgt is the population distribution by exposure level x for age group a, sex s and region g at year t in the counterfactual distribution. The PAF for a discrete risk factor can be expressed as follows:
 (2)
(2)
RRcrasg is the relative risk of disease burden as a function of exposure category x for cause c from risk factor r with age group a, sex s, and region g. Pcrasgt is the proportion of the population in exposure category x for age group a, sex s and region g at year t in the baseline scenario. P'crasgt is the proportion of the population in exposure category x for age group a, sex s, region g at year t in the counterfactual scenario.
Dietary risk factors
We selected two dietary risk factors regarding meat consumption: diets high in red meat and processed meat, respectively. For the two dietary risk factors, we assumed that a country’s total population is exposed to the dietary risks regarding its national meat consumption level m (g/cap/day). We used the standard serving sizes of 100 g for red meat (srm) and 50 g for processed meat (spm) from the GBD 2019.17 Additionally, we obtained relative-risk parameters by five-age intervals in each dietary risk factor for three different diseases from the GBD study (online supplemental table 2). The GBD study collected the relative risks of each disease per standard serving size of red meat and processed meat from dose-response meta-analyses and prospective cohort studies.17
With national meat consumption level m, the relative risk of the dietary risk factor r for cause (or disease) c was calculated by increasing the risk factor to the power of the national consumption level over the standard serving size:
 (3)
(3)
RRcrg is the relative risk of cause c from risk factor r in country g. RRcr is the relative risk of cause c from risk factor r. sf is the standard serving size of red meat or processed meat. mg is the consumption level in country g. As we used a discrete risk factor for the comparative risk analysis, the associated PAF of disease burden for cause c, risk factor r, age group a and country g at year t was as follows:
 (4)
(4)
RRcra is the relative risk of cause c from risk factor r for age group a. sf is the standard serving size. mbase,gt is the red or processed meat consumption level for country g at time t in the baseline scenario. mcount,gt is the red or processed meat consumption level for country g at time t in the counterfactual scenario.
We measured the number of attributable deaths that would be reduced when the level of risk exposure was changed from the baseline scenario (consumption from both domestic meat production and trade) to the counterfactual scenario (consumption from only domestic meat production for domestic supply) by multiplying the associated PAF and disease-specific death numbers in each age group. The attributable burden of death for risk factor r, age group a and country g at year t was estimated by the following equation:
 (5)
(5)
deathcragt is the number of attributable deaths for cause c of w relevant diseases for risk factor r in age group a of country g at time t. Then, we aggregated the number of deaths related to each of the two risk factors over all age groups together. In addition to changes in deaths, by substituting the death metric with disease-specific DALYs in the equation (5), we also estimated the attributable burden of DALYs due to changes in two dietary risk factors. All attributable deaths and DALYs were estimated with 95% confidence intervals (CIs) associated with risk exposures, relative risks and burden rates.
Finally, we calculated age-standardised attributable death and DALY rates on a per-million population basis, respectively, using our estimations of the attributable burden of deaths and DALYs at the country level. We also measured the changes in attributable death and DALY rates respectively from 1993 to 2018. Our final dataset included 154 countries from 1993 to 2018 based on red and processed meat trade and health data availability. We performed the analyses of each year from 1993 to 2018 and averaged our annual results in the first 3 years (1993–1995) and the last 3 years (2016–2018) to account for uncertainties of trade and health data. We also divided all 154 countries into developed (N=50) and developing (N=104) countries based on the World Bank’s income classification in 2018.31 The raw datasets for this study can be found in the FAOSTAT,21 the UN Population Division,23 the Global Health Data Exchange32 and the World Bank.31
Patient and public involvement
There was no patient or public involvement in this study.
Results
Changes in red and processed meat trade flow
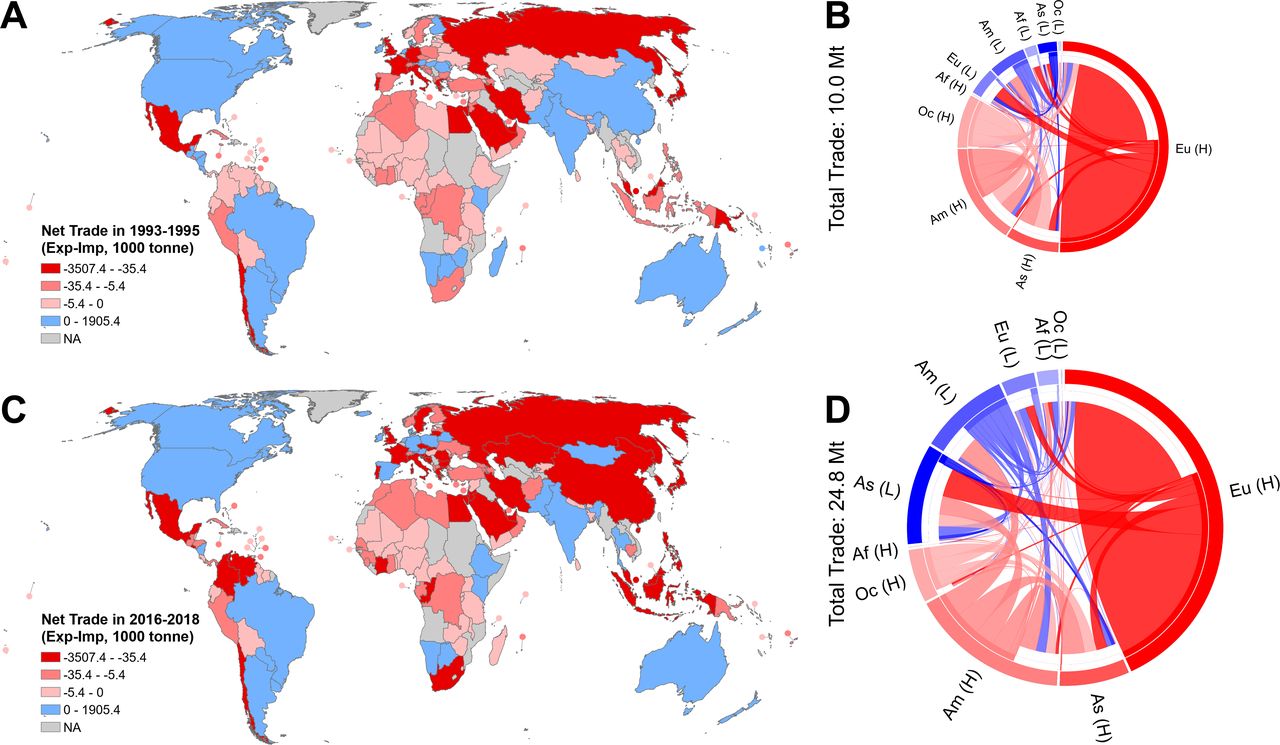
The amount of global red and processed meat trade increased 148.4% from 10.0 Mt in 1993–1995 to 24.8 Mt in 2016–2018 (figure 1). Over the past 25 years, the number of net exporting countries decreased from 33 in 1993–1995 to 26 in 2016–2018, while net importing countries increased from 121 in 1993–1995 to 128 in 2016–2018. Spatially, developed countries in Europe accounted for 55.0% and 50.6% of total red and processed meat exports in 1993–1995 and 2016–2018, respectively. In 2016–2018, approximately 70.6% and 4.4% of their exports went to other developed and developing countries in Europe, respectively. In addition, developed countries in North America and Oceania acted as major net exporters in global meat trade. Their meat products were exported to all other countries around the world. The USA alone accounted for about 11.7% (1.2 Mt) in 1993–1995 and 14.5% (3.6 Mt) in 2016–2018 of global meat exports. In Oceania, Australia and New Zealand accounted for 16.5% (1.7 Mt) of global meat exports in 1993–1995, but their proportion decreased to 10.2% (2.5 Mt) in 2016–2018. Instead, developing countries in South America played an increasingly important role as net exporters in global meat trade. Brazil, Argentina and Paraguay accounted for 4.9% (0.5 Mt) of global meat exports in 1993–1995, and their proportion rapidly increased to 9.7% (2.4 Mt) in 2016–2018. The new net exporters in developing countries rapidly increased their exports to other developing countries from 2.0 Mt (20.1% of total imports in developing countries) in 1993–1995 to 8.9 Mt (35.8%) in 2016–2018.

Net exporting and importing countries for red and processed meat trade (A, C) and annual red and processed meat flows between developed and developing countries across subregions (B, D) in 1993–1995 and 2016–2018: (A, C) blue indicates net exporting countries, red indicates net importing countries and gray indicates countries with missing data. (B, D) the Arc length of an outer circle indicates the sum of red and processed meat exported and imported in each group. The Arc length of a middle circle indicates the quantity of red and processed meat exports. The Arc length of an inner circle indicates the quantity of red and processed meat imports. AF, Africa; AM, America; AS, Asia; EU, Europe; OC, Oceania; H, Developed countries; L, Developing countries; NA, not available countries.
The impacts of red and processed meat trade on NCDs
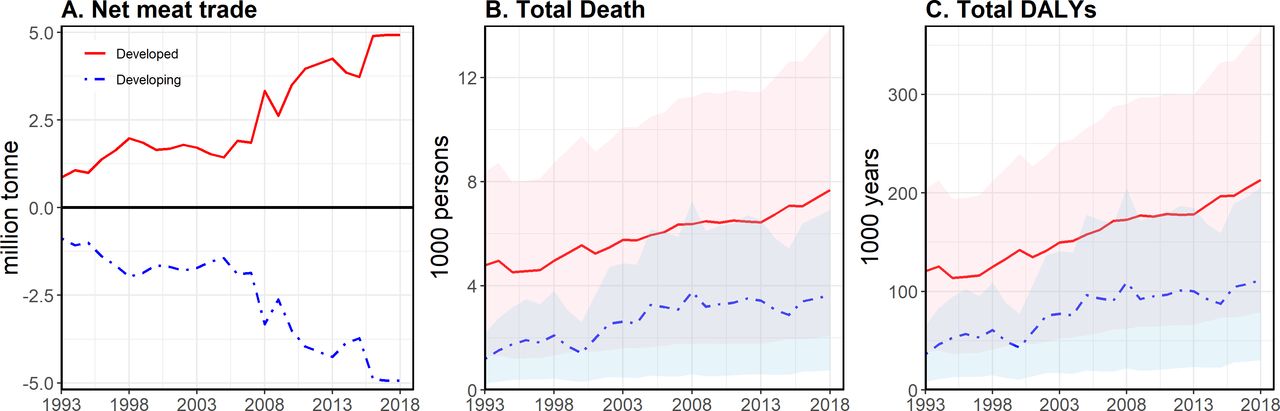
Our comparative risk analyses examined the number of deaths and DALYs attributable to the two dietary risk factors (i.e., diets high in red and processed meat via trade) from 1993 to 2018 (figure 2). Worldwide, the increases in red and processed meat consumption with trade accounted for 10 898 attributable deaths (95% CI 2 737 to 19 906) in 2016–2018, which increased 74.6% from 1993 to 1995. Global attributable DALYs also increased 89.9% from 165 008 DALYs (95% CI 49 156 to 287 714) in 1993–1995 to 313 432 DALYs (95% CI 104 891 to 546 741) in 2016–2018. In 2016–2018, approximately 68% and 66% of the attributable deaths and DALYs were in developed countries, while developing countries accounted for about 32% and 35% of the attributable deaths and DALYs, respectively. However, the change rates of attributable deaths and DALYs varied considerably by income group (figure 2). From 1993 to 2018, global meat trade contributed to a 55.0% and 71.2% increase in the attributable deaths and DALYs in developed countries, while developing countries increased 137.3% and 140.0% in attributable deaths and DALYs, respectively. In the global meat trade networks, developing countries increasingly acted as net importers, while developed countries acted as net exporters (figure 2). Developing countries increased their meat imports by 342.5% from 2.0 Mt (20.1% of global meat trade) in 1993–1995 to 8.9 Mt (35.8%) in 2016–2018, while developed countries increased 99.6% of meat imports from 8.0 Mt in 1993–1995 to 15.9 Mt in 2016–2018.

Net meat trade, total attributable deaths and total DALYs due to red and processed meat trade in developed and developing countries from 1993 to 2018: (A) the amounts of net meat trade calculated by subtracting meat imports from meat exports, (B) the number of attributable deaths due to meat trade with 95% confidence intervals (CIs) and (C) the number of attributable DALYs due to meat trade with 95% CIs. DALY, disability-adjusted life year.
Attributable deaths and DALYs due to increased red and processed meat consumption with trade accounted for 1.1%–1.6% of global deaths and DALYs attributable to the two dietary risk factors. However, the proportions of the attributable deaths and DALYs via meat trade to all deaths and DALYs regarding red and processed meat consumption greatly varied across countries. At the country level, in 1993–1995, the top 10 countries with the proportion of attributable deaths included Tonga, United Arab Emirates, Barbados, Fiji, Gabon, Bahamas, Greece, Malta, Brunei and Saint Lucia (table 1). In 2016–2018, the top 10 countries included Netherlands, Bahamas, Tonga, Denmark, Antigua and Barbuda, Seychelles, United Arab Emirates, Singapore, Croatia and Greece. From 2016 to 2018, meat trade in these 10 listed countries accounted for more than 7.4% of all deaths attributable to diets high in both red and processed meat (table 1).
Comparison of percentage of attributable deaths and DALYs via red and processed meat trade to all meat consumption-related deaths and DALYs for the top 10 countries in 1993–1995 and 2016–2018
Regarding the proportion of attributable DALYs via meat trade, the top 10 countries in 1993–1995 were the same as the top 10 countries for attributable deaths. In 2016–2018, the top 10 countries regarding the proportion of attributable DALYs were almost the same as the top 10 countries with attributable deaths in 2016–2018, but included Malta instead of the United Arab Emirates. From 2016 to 2018, meat trade in these ten listed countries accounted for more than 8.6% of all DALYs attributable to diets high in both red and processed meat (table 1). Additionally, we also identified major exporting partners for the top 10 importing countries (online supplemental table 3). In both attributable deaths and DALYs, the most important exporting partners changed from New Zealand, Australia and the USA in 1993–1995 to Brazil, Germany and the Netherlands in 2016–2018. In 2016–2018, Germany and Brazil rapidly increased their meat exports and thus raised the health risks of diet-related NCDs via trade in the top 10 importing countries. In Germany, red and processed meat exports increased from 0.6 Mt in 1993–1995 to 2.9 Mt in 2016–2018. Brazil increased its meat exports from 0.2 Mt in 1993–1995 to 1.8 Mt in 2016–2018.
Country-specific attributable death and DALY rates
Our country-level results also showed an overview of age-standardised attributable death and DALY rates per million people due to red and processed meat trade in 1993–1995 and 2016–2018 (figure 3). The attributable death and DALY rates had large spatial variations across subregions. In both 1993–1995 and 2016–2018, island countries in the Caribbean and Oceania had relatively high diet-related NCDs attributable to the meat trade. In addition to these island countries, Russia, Canada and the UK experienced relatively high attributable death and DALY rates in 1993–1995. After 25 years, instead of Russia, Canada and the UK, countries in Northern and Eastern Europe became greatly exposed to diet-related NCDs via meat trade. Over the same period, countries in South Asia and East and West Africa had notably low attributable death and DALY rates regarding meat trade.

Country-specific, age-standardised attributable death and DALY rates per million people due to red and processed meat trade: (A) death rates in 1993–1995, (B) death rates in 2016–2018, (C) DALY rates in 1993–1995 and (D) DALY rates in 2016–2018. DALY, disability-adjusted life year; NA, not available countries.
Figure 4 shows the changes in attributable death and DALY rates via red and processed meat trade at the country level over the periods of 1993–1995 and 2016–2018. Three-fourths of all 154 countries experienced increases in attributable death and DALY rates, while one-fourth of all countries decreased in attributable death and DALY rates from 1993 to 2018. These proportions were the same in developed and developing countries separately. Over the period of 25 years, countries that underwent rapid increases or decreases in attributable death and DALY rates with meat trade were highly grouped by geographical locations. For instance, large increases in the attributable death and DALY rates mainly occurred in Northern and Eastern European countries as well as island countries in the Caribbean and Oceania. Particularly, former USSR (the Union of Soviet Socialist Republics) countries in Northern and Eastern Europe had continuous, rapidly increasing attributable death and DALY rates due to meat trade. In contrast, the USA, Russia and many countries in South America and Western Asia decreased their rates of attributable deaths and DALYs due to meat trade.

Changes in age-standardised attributable death and DALY rates per million people from 1993–1995 to 2016–2018: (A) the changes in attributable death rates and (B) the changes in attributable DALY rates across countries. DALY, disability-adjusted life year; NA, not available countries.
Discussion
Geographical differences of diet-related NCDs via meat trade
By integrating bilateral meat trade flows and comparative risk assessment, we identified the cross-country variations of changes in diet-related NCDs due to red and processed meat trade and high-risk countries’ major exporting partners simultaneously. Our findings indicate that the increased intake of red and processed meat products via trade contributes to a rise in the attributable burden of diet-related NCDs in both developed and developing countries. Although developed countries still accounted for over 65% of attributable deaths and DALYs due to meat trade, the change rates in developing countries were twice as high as those in developed countries between 1993 and 2018. These higher rates are because many developing countries around the world exponentially relied on red and processed meat imports to meet their increased meat demands under rapid urbanization and income growth.9 14 33
Worldwide, the incidence of diet-related NCDs attributable to red and processed meat trade had great spatial variations among subregions. Over the period of 1993–2018, island countries in the Caribbean and Oceania became particularly vulnerable to diet-related NCD incidence and mortality due to large meat imports. These island countries with limited land for meat production greatly depend on meat imports, which causes an enormous attributable burden of diet-related NCDs.34–37 Additionally, from 1993 to 2018, countries in Northern and Eastern Europe exceedingly increased attributable death and DALY rates via meat trade. These rapid increases are partly because many of these countries, such as Slovakia, Lithuania and Latvia, joined the European Union (EU) between 2003 and 2004, and regional trade agreements for goods among EU members greatly accelerated meat imports to these countries with economic benefits (e.g., tariff exemption).9 38 39
Among the 154 countries in this study, 34 countries experienced decreases in both attributable death and DALY rates through trade from 1993–1995 to 2016–2018. These decreases are partly because of population growth exceeding the increases in meat imports in 24 out of the 34 countries. Thus, these countries comparably decreased per capita meat consumption from imports between 1993 and 2018. Another reason for the decrease is that half of these decreased countries (19 of 34) increasingly depended on domestic meat production for their demands. Despite decreases in attributable death and DALY rates via meat trade, more than a half of these countries (20 of 34) still raised the absolute number of diet-related NCD deaths and DALYs with increased meat consumption over the study period.17 40 41 Moreover, some of these countries increasingly acted as net meat exporters, especially in South America (i.e., Brazil, Paraguay and Argentina) and Europe (i.e., Germany). These net exporting countries may provoke rapid domestic land use changes and biodiversity loss due to large red and processed meat production for exports.11–13 42 43
The impacts of red and processed meat trade toward healthy diets
Our cross-country results indicate that national and international efforts for shifting toward healthy diets should consider the impacts of red and processed meat trade on diet-related NCDs. Specifically, the health impacts of red and processed meat trade have substantially risen in Northern and Eastern European countries, as well as island countries in the Caribbean and Oceania, which hinders international and national commitments to healthy diets. Although many dietary guidelines have been suggested for both human health and environmental sustainability across the globe,1 44 few international initiatives and national guidelines for sustainable diets explicitly address the spillover impacts of meat trade across countries. Thus, introducing cross-sectoral policies toward less dependence on red and processed meat imports is urgently needed to reduce diet-related NCD incidence and mortality in these vulnerable countries.34–37
In particular, engaging all national and international sectors of health, production and trade are crucial to transform global meat trade policies to address these spillover effects.45 For instance, since regional trade agreements of the World Trade Orgranization accelerate red and processed meat flows among countries,9 the World Trade Organization should strengthen collaborations with the Food and Agriculture Organization and the World Health Organization (e.g., the Technical Barriers to Trade Agreement) for the health agenda of trade agreement. In addition to international trade policies, national and regional policies need to address health issues from diet-related NCDs via red and processed meat trade. The EU, which accounts for a half of global meat trade, is preparing to charge carbon border taxes on imported goods based on the greenhouse gases emissions released during the process of their production. The carbon border taxes on meat products would be applied for future meat trade policies to achieve sustainable diets toward less red and processed meat consumption. Also, emissions of greenhouse gases during transport should be taken into account. Emissions of greenhouse gases increase with longer distances between importing and exporting countries (assuming other conditions remain the same). The framework of metacoupling (socioeconomic-environmental interactions within as well as between adjacent and distant places) can help guide the assessments of emissions from production within countries as well as emissions from transport between adjacent and distant countries.46–48 A number of studies that applied the metacoupling framework show drastic differences in trade between adjacent and distant countries.49–52
Additionally, future interventions need to address local contexts—such as food prices, food culture, environmental conditions and socioeconomic factors—to be more effective.2 4 Without considering local contexts, a rapid transformation toward plant-based diets may cause unpredictable health consequences regarding micronutrient deficiencies.4 Since our results indicate that net meat-exporting countries greatly contribute to increases in meat consumption and diet-related NCDs in other net importing countries, cross-scale and coordinated efforts between exporters and importers are crucial to adjust agricultural priorities from producing large amounts of red and processed meats for exports to healthy plant-based foods.1 For example, Brazil and Germany rapidly became crucial exporting countries, and their meat exports may increase meat consumption and the health risks of diet-related NCDs via trade in their major importing countries, such as Croatia and Seychelles.
Research limitations
We identified several research limitations before drawing conclusions. First, our results may underestimate diet-related NCD risks via meat trade, as we only included 20 major red and processed meat items. Other types of meat trade can cause additional NCD risks by increasing per capita red and processed meat consumption. Second, the FAO trade matrix data did not capture re-exporting processes. Many countries import and process red meat items for exports, and thus our results may overestimate diet-related NCD risks via trade in major re-exporting countries such as the Netherlands and Singapore. Re-exports in the Netherlands and Singapore accounted for over 50% of their merchandise exports.53 Third, we could not identify the dynamic changes in domestic red and processed meat production according to trade. If some countries could not import meat due to socioeconomic and political reasons, there may be a more concerted effort to produce meat domestically to meet domestic demands. Further analyses need to estimate such dynamics and their impacts on attributable deaths and DALYs at a country level. Finally, although we identified vulnerable countries that have high diet-related NCDs through red and processed meat trade, our comparative risk assessments could not determine which country-specific characteristics influence the amounts of meat trade and thus diet-related NCDs. For example, different health and trade policies between countries may lead to changes in the quantities of meat consumption via trade and thus impacting the attributable deaths and DALYs across countries. Further works need to explore how specific local contexts in each country interact with meat trade and diet-related NCDs by using comprehensive datasets.
Despite the above limitations, this study shows that global increases in red and processed meat trade contribute to the abrupt increase of diet-related NCDs, and the attributable burden of diet-related NCDs has large geographical variations among countries. To prevent unintended health consequences due to red and processed meat trade, future interventions need to urgently integrate health policies with agricultural and trade policies by cooperating between responsible exporting and importing countries. As such, our approach and findings provide a valuable foundation for implementing healthy diets in the era of the globalized meat trade.
Data availability statement
Data area available in a pulic, open access respository. All data analyzed in this study are available on reasonable request. All data analyzed during the current study are available from the corresponding author on reasonable request. Data that support the findings of this study are available within the paper and its Supplementary Information.
Ethics statements
Patient consent for publication
Ethics approval
Since all data used in this study were already in the public domain, ethical approval was not required.
References
Supplementary materials
Supplementary Data
This web only file has been produced by the BMJ Publishing Group from an electronic file supplied by the author(s) and has not been edited for content.
Press release
- Press release -
Press release
- Press release -
Footnotes
Handling editor Eduardo Gómez
Contributors MGC and JL designed the study. MGC and YL conducted the literature review, data extraction, and analysis and production of visualisation. MGC, YL and JL interpreted the data and wrote the manuscript. All authors contributed to manuscript revision, read and approved the submitted version. All authors had access to the data.
Funding Funding is provided by the National Science Foundation, NASA, Environmental Science and Policy Program at Michigan State University, Sustainable Michigan Endowment Project and Michigan AgBioResearch.
Map disclaimer The inclusion of any map (including the depiction of any boundaries therein), or of any geographic or locational reference, does not imply the expression of any opinion whatsoever on the part of BMJ concerning the legal status of any country, territory, jurisdiction or area or of its authorities. Any such expression remains solely that of the relevant source and is not endorsed by BMJ. Maps are provided without any warranty of any kind, either express or implied.
Competing interests None declared.
Provenance and peer review Not commissioned; externally peer reviewed.
Supplemental material This content has been supplied by the author(s). It has not been vetted by BMJ Publishing Group Limited (BMJ) and may not have been peer-reviewed. Any opinions or recommendations discussed are solely those of the author(s) and are not endorsed by BMJ. BMJ disclaims all liability and responsibility arising from any reliance placed on the content. Where the content includes any translated material, BMJ does not warrant the accuracy and reliability of the translations (including but not limited to local regulations, clinical guidelines, terminology, drug names and drug dosages), and is not responsible for any error and/or omissions arising from translation and adaptation or otherwise.