Article Text

Abstract
Introduction Since its emergence in late December 2019, COVID-19 has rapidly developed into a pandemic in mid of March with many countries suffering heavy human loss and declaring emergency conditions to contain its spread. The impact of the disease, while it has been relatively low in the sub-Saharan Africa (SSA) as of May 2020, is feared to be potentially devastating given the less developed and fragmented healthcare system in the continent. In addition, most emergency measures practised may not be effective due to their limited affordability as well as the communal way people in SSA live in relative isolation in clusters of large as well as smaller population centres.
Methods To address the acute need for estimates of the potential impacts of the disease once it sweeps through the African region, we developed a process-based model with key parameters obtained from recent studies, taking local context into consideration. We further used the model to estimate the number of infections within a year of sustained local transmissions under scenarios that cover different population sizes, urban status, effectiveness and coverage of social distancing, contact tracing and usage of cloth face mask.
Results We showed that when implemented early, 50% coverage of contact tracing and face mask, with 33% effective social distancing policies can bringing the epidemic to a manageable level for all population sizes and settings we assessed. Relaxing of social distancing in urban settings from 33% to 25% could be matched by introduction and maintenance of face mask use at 43%.
Conclusions In SSA countries with limited healthcare workforce, hospital resources and intensive care units, a robust system of social distancing, contact tracing and face mask use could yield in outcomes that prevent several millions of infections and thousands of deaths across the continent.
- epidemiology
- respiratory infections
- SARS
- public health
- mathematical modelling
This is an open access article distributed in accordance with the Creative Commons Attribution Non Commercial (CC BY-NC 4.0) license, which permits others to distribute, remix, adapt, build upon this work non-commercially, and license their derivative works on different terms, provided the original work is properly cited, appropriate credit is given, any changes made indicated, and the use is non-commercial. See: http://creativecommons.org/licenses/by-nc/4.0/.
Statistics from Altmetric.com
Key questions
What is already known?
Country level estimates of infections of SARS-Cov-2 have been made for sub-Sahara Africa.
What are the new findings?
Model-based estimates for small, medium and large population clusters under different scenarios of non-pharmaceutical interventions suggest epidemic can be brought to control with moderate social distancing, contact tracing and face mask use in urban clusters, and with minimal social distancing and moderate contact tracing measures in rural settings.
Introducing and maintaining of face mask use at around 43% could avoid increases in the number of infections as a result of loosening social distancing measures in urban clusters.
What do the new findings imply?
The estimates of number of infections in clusters of different size and with multiple scenarios of interventions give countries in sub-Saharan Africa (SSA) a clear target and control strategies.
With these estimates, governments in the SSA region would be able to plan better national and subnational epidemic responses.
Introduction
Since its emergence in late December of 2019 and subsequent declaration by WHO as a pandemic on 11 March 2020, SARS-CoV-2 virus has continued to spread in many regions with more than 3.2 million confirmed cases and 228 thousand reported deaths worldwide in more than 210 countries and territories as of 30 April 2020.1 The rapid progression of the number of infections and deaths due to SARS-CoV-2 has taken many by surprise, with many of its characteristics related to its transmissibility under continuous update.2 While the disease is still actively spreading in many regions of the world, researchers are working to quantify transmission parameters,2–7 and make estimates of infections and resulting deaths under different scenarios. However, these studies are either too specific to certain geographies8 9 or are too general to handle realistic scenarios10 11 in the context of sub-Saharan Africa (SSA) where majority of the population live in rural and semi urban areas with weak physical interconnections,12 13 and urban areas with limited access to basic water and sanitation facilities and space to self-isolate. To address this and provide estimates of the number of COVID-19 infections disaggregated by different population sizes both for urban and rural settings, we developed a stochastic process-based model structured into Susceptible-Exposed-Infectious-Removed compartments, and with parameters obtained from most recent studies. We chose three urban scenarios with three million, one million and 100 thousand population sizes and one rural setting with population of 200 thousand. To access the dynamics under different conditions and provide estimates of infection over time, we examined a total of 24 scenarios for each of four geographic settings. These settings are (1) large urban: a dense urban population size of ~3 million with possibility of having slum areas, but having relatively better awareness of social distancing measures while economically constrained to avoid large gathering, (2) medium-size urban: densely urban population of ~1 million and higher level of poverty that could constrains avoidance of large gathering, despite better awareness of social distancing measures (3) small urban: less dense urban population of ~100 thousand and higher level of poverty to afford personal hygiene products and low awareness of social distancing measures (4) large rural: sparsely populated large rural area with population of ~200 thousand, with poor awareness of social distancing measures and poor road infrastructure within. In urban settings social distancing would mean avoidance of schools, restaurants, bars and large gatherings related to market, social and religious ceremonies, while in rural areas social distancing wound be limited to avoidance of gatherings related to school, market, social and religious ceremonies.
Methods
Compartmental disease transmission model
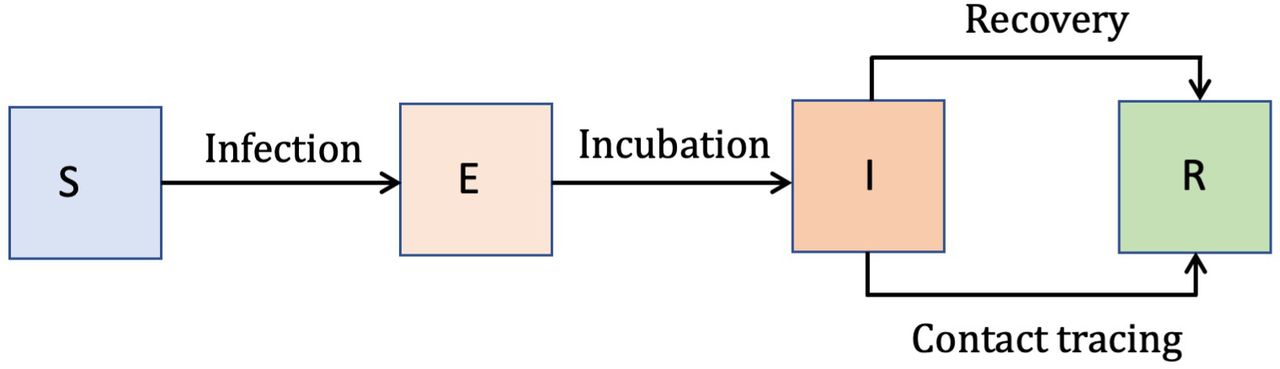
We developed a process-based stochastic model based on a system of ordinary differential equations with four human compartments: Susceptible (S), Exposed (E), Infectious (I) and Removed (R).14 15 Under this modelling framework, susceptible individuals get infected by the virus and progress to the exposed state E at a rate—the force of infection Λ. The force of infection is determined by the length of the infectious period (1/γ), the proportion of infectious individuals, and the basic reproduction number R0—the mean number of secondary infections from a single infected individual introduced into a fully susceptible population. Once exposed, infected individuals stay in that state for the duration of the incubation period (1/ξ) and progress to the infectious state I, where they stay for the length of the infectious period (1/γ)—until they are removed either through quarantine, recovery or death (figure 1, online supplemental methods). While there are recent evidence of decreases in IgG levels and neutralising antibodies after 2–3 months of infection,16 17 suggesting potential for infection after recovery, we have not considered the possibility of recovered individual returning to the susceptible state.
Supplemental material

The SEIR model structure. the four compartments include susceptible (S), exposed (E), infectious (I) and removed (R).
We assumed incubation period will have a Weibull distribution with mean of 5.5 days.5 To examine the robustness of the model to different incubation period distributions, with further confirmation the values were within range of values recently reported,18 we used Gamma distributed incubation period with mean of 5.5 days.9 In our model setup, contact tracing is assumed to affect those that are in the infectious state resulting in their transition to the removed state R. We also assumed time to isolation after illness onset with a Gamma distribution of mean 3.4 days.19 Social distancing reduces the contact rate between individuals. At the same time, use of face mask reduces the probability of infection given contact. Based on effectiveness of medical face mask estimated at 41%,20 we assumed the use of population level face masks made of cloth will have 25% effectiveness, about half the effectiveness reported for medical masks.
Based on reported estimates of the basic reproduction number, R0, which describes the average number of secondary infections caused by a typical primary infection in a completely susceptible population, ranging from 2.4 to 3.3,3 9 21 22and in considerations of the relative level of natural social distancing that rural areas are expected to have, we assumed R0 values of 3 urban and two in rural areas given the range of values reported from Europe and China, and the fact that social distancing, which is associated with population density, has been observed to bring down the value of R0 significantly.22 Several papers have reported values close to 3,3 9 21 22 while others have reported mean close to 2.23 Since rural settings are more sparsely populated and thus have some level of social distancing, we assumed the lower values of R0 as baseline values in those settings, while urban settings were assumed to have the higher estimates of 3. Because estimates of R0 and length of the infectious period cannot be viewed in isolation, we used estimates in their proper context and paired R0 values and length of infectious period estimates from similar sources. Accordingly, we assumed infectious period (preclinical and clinical) of 5 days.9
Force of infection is a differentiable function of the parameters R0, length of infectious period (1/γ), effectiveness (ω) and coverage of face mask (τ), the effectiveness of social distancing (ε), given by the equation,
 (1)
(1)
Where, 1/γ is the length of infectious period, ω is the effectiveness of face mask, τ is the coverage of face mask, ε is the effectiveness of social distancing, I is the number of infectious individuals and N is the total population.
Our model assumes that transmission occurs at community level, where cases may not have any traceable imported source. By the time such a case is reported and diagnosed, due to delays in reporting and inadequate testing, we assumed that there could be at least 50 infections going around unobserved. This is due to considerations of imperfect reporting as a result of (1) delays in testing and (2) the potential for presymptomatic infection.24 Similar initial numbers of infections have been estimated in recent analysis based on models fitted to hospital and death data.22
All model simulations were performed using the Partially Observed Markov Process package,25 available in R, with all scenarios run based on parameters either fixed or Monte Carlo sampled from their corresponding distributions. We run all scenarios for 100 realisations to account for stochasticity in the model process and to quantify uncertainties in the parameters. Results are reported as median effect estimates of new and cumulative infections and 95% credible intervals (CI) on a daily scale.
To examine the robustness of model to changes in parameter values we did a number of sensitivity analyses. First, we tested the model results by using a Gamma distributed incubation period9 instead of Weibull distribution. Given that the force of infection Λ is a differentiable function of five parameters (Eq. 1), we computed the sensitivity index of these parameters26 to the force of infection and estimated their significance in the infection process (table 1, online supplemental table S1). In addition, we run sensitivity analysis on all parameters, using both single parameter and variance based multivariate approaches,27 to assess their effect on the cumulative infection values by the end of 365 days after the trigger point based on prior ranges and baseline values for each parameter.
Parameters and assumptions used to run the model
Results
We run the simulation model based on an initial sets of scenarios by varying among two values for the effectiveness social distancing (0, 0.33 for urban; 0, 0.25 for rural), three values for the coverage of contact tracing (0, 0.25, 0.5), four values for the coverage of face mask (0, 0.25, 0.5, 0.8), for a total of 24 scenarios per each of the four geographies (large urban, medium-sized urban, small urban and large rural). While we started with one additional small rural setting having population of 100 k, we dropped the additional setting as its results were similar to those under the larger rural settings. For comparisons of these scenarios, we generated daily number of cases and daily cumulative cases over 1-year period starting from the trigger point, for each set of simulations (100 per scenario) summarised as the median and 95% CI for each scenario.
Counterfactual scenario
Our results show that with no interventions, that is, no social distancing, no contact tracing and no face mask usage, transmission would result in 94% and 80% of the population infected over a year’s period in urban and rural settings, respectively. In addition, nearly all infections in the urban settings and more than two-thirds of the infection in the rural settings would occur in the initial 90 days after the trigger point of community-level transmission (figure 2, left panel).
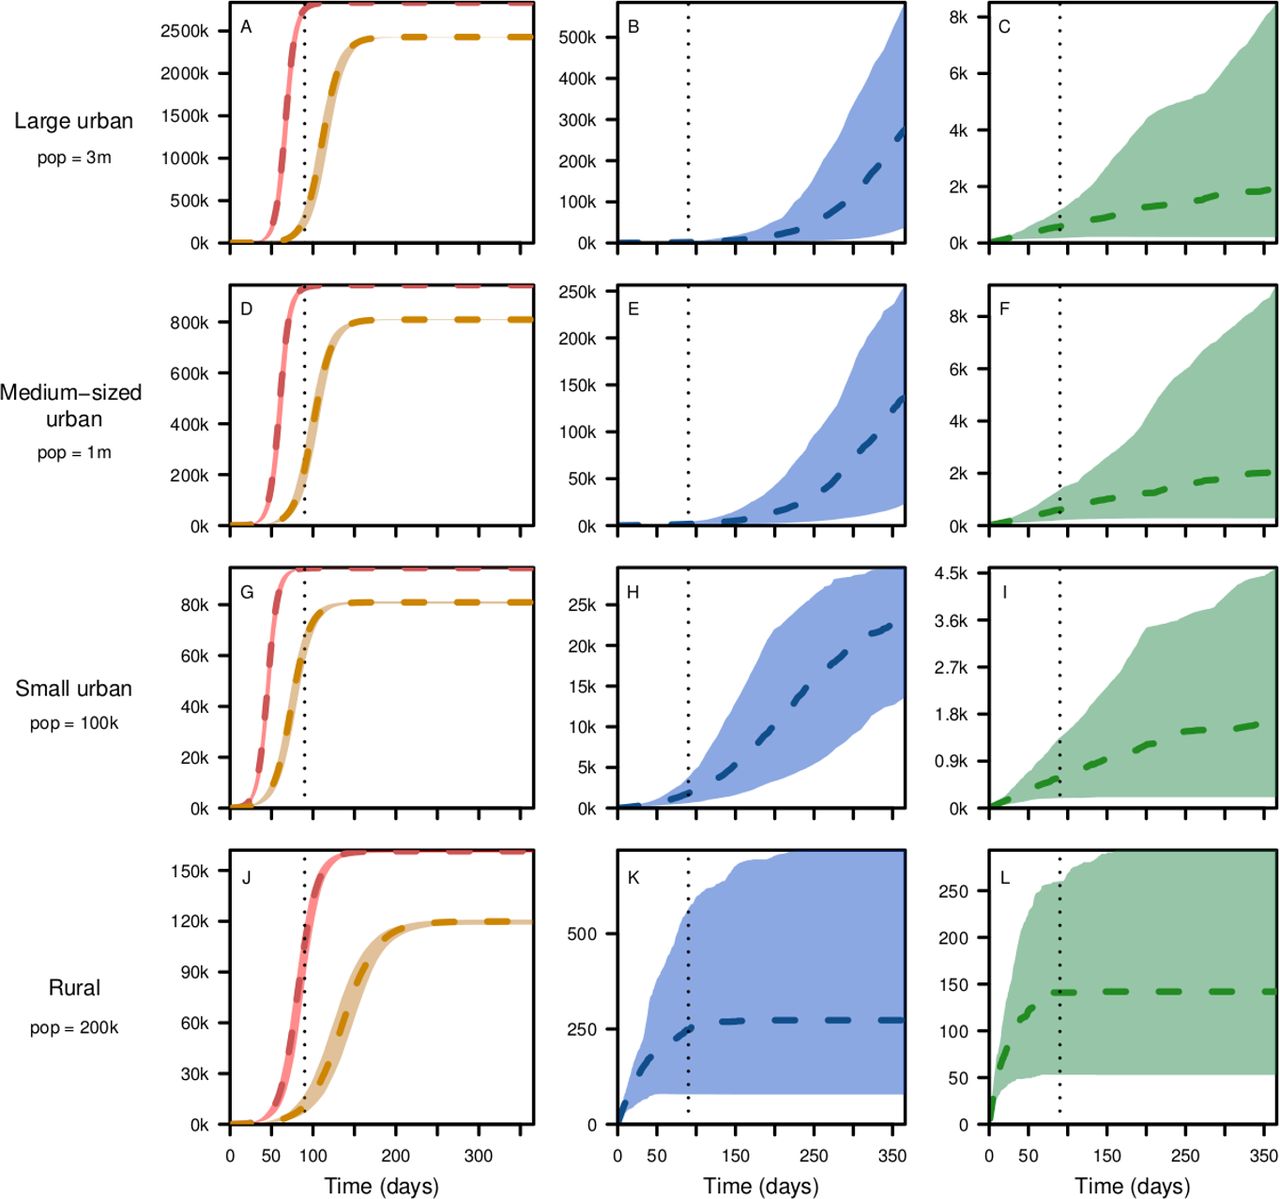
Cumulative number of infections in 1 year after the trigger point in large urban (A–C), medium-sized urban (D–F), small urban (G–I) and rural (J–L) settings from top to bottom, respectively, assuming no social distancing (left panel-red), with social distancing (33% in urban and 25% in rural) only (left panel-brown), with social distancing and 50% contact tracing (middle panel); and with 50% coverage of both contact tracing face mask use (right panel). The short-term projections (within the first 90 days) are shown by the dotted vertical lines. Curves (broken lines) show the median values and corresponding shaded regions show the 95% credible intervals.
Effects of social distancing
In the absence of other interventions, the effects of 33% social distancing in urban setting were moderate in the long term (at the end of the year), with only 14.3% (95% CI 14% to 14.7%) reduction in the number of infections over 1-year period. The effect of 25% social distancing in rural settings is larger at 25.7% (95% CI 25.2% to 26.5%) (figure 2, left panel, figure 3). The projections in the urban settings are in general smaller due to fact that the base projection (non-intervention) concerns a larger proportion of the population. In the short term (at the end of the first 90 days), however, these relative reductions are higher with 87.7% (95% CI 83.5% to 93.2%), 74.5% (95% CI 64.5% to 82.9%), 30% (95% CI 25.5% to 37.8%) and 89.4% (95% CI 84.4% to 92%) in the large urban, medium-sized urban, small urban and rural settings, respectively (figure 2, left panel).
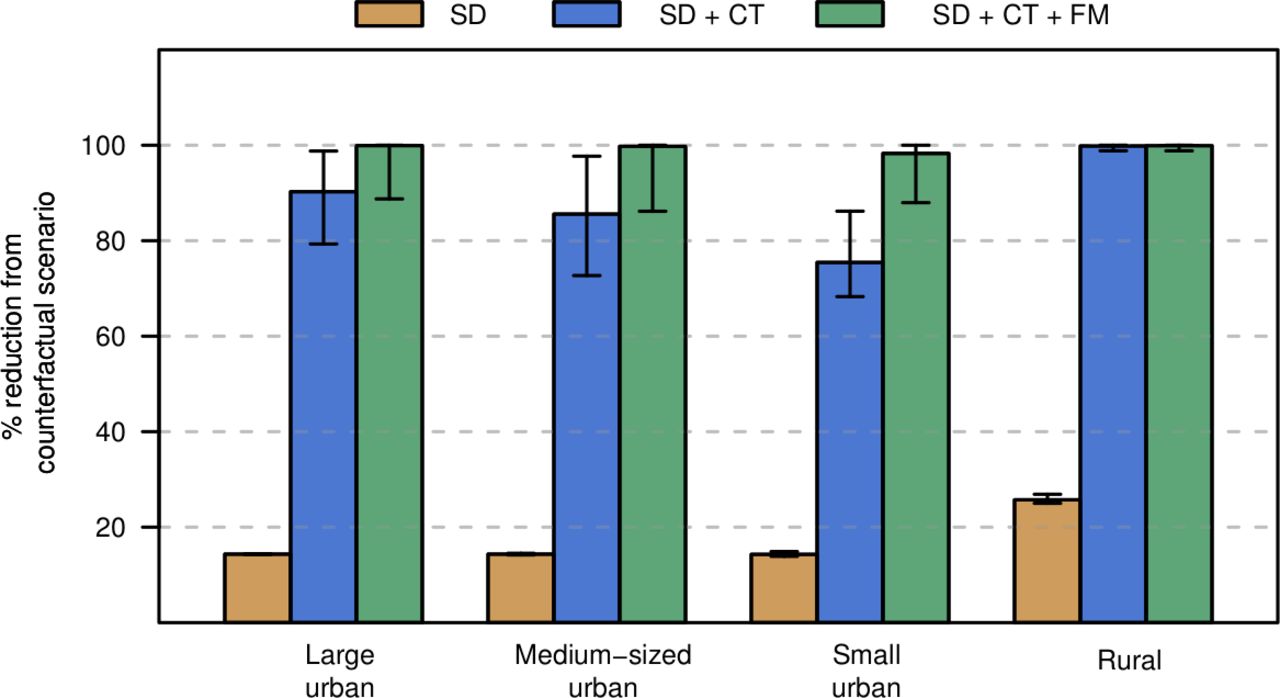
Percentage reduction in number of infections from the counter-factual scenario as a result of the three interventions serially stacked up on each other. The interventions included are social distancing (33% in urban and 25% in rural) only (brown), social distancing and 50% contact tracing (blue); social distancing and 50% coverage of both contact tracing and face mask use (green). Whiskers show the 95% credible intervals. The small and medium-sized urban settings have relatively smaller overall infections averted due to the effect of our frequency dependent dynamic which leads to larger proportion of infection in settings with smaller population sizes.
Added effect of social distancing and contact tracing
Based on our model projections, the effects of contact tracing are significantly large for all geographical settings when coupled with social distancing with effectiveness of 33% and 25% in urban and rural settings, respectively. Our results show additional decrease in the number of infections of 75.9% (95% CI 63.7% to 84.3%), 71.2% (95% CI 58% to 83.1%), 61·2% (95% CI 52.8% to 70.9%) and 74.1% (95% CI 74.3% to 75.5%) in the large urban, medium-sized urban, small urban and rural settings, respectively (figure 2, second column, figure 3). This dramatic decrease significantly contributed to the cumulative decreases in infections of 90.2% (95% CI 78% to 98.7%), 85.6% (95% CI 72.2%–97.5%), 75.4% (95% CI 66.8% to 85.6%), and 99.8% (99.5% to 100%) in the large urban, medium-sized urban, small urban and rural settings respectively (figure 3). The results in the rural setting indicate social distancing and contact tracing can lower the epidemic to manageable levels. The added effect of contact tracing is not only to lower the number of infections but also to delay the peak transmission period, effectively flattening the curve (online supplemental figures S1‒S4) and significantly reduce the burden to the healthcare delivery services.
Added effect of social distancing, contact tracing and face mask usage
When all three non-pharmaceutical interventions are applied, with 33% and 25% social distancing in urban and rural settings, 50% contact tracing and 50% face mask use, our results show a large number of infections could be averted especially in urban settings. Accordingly, these interventions would bring the number of infections down by additional 9.4% (95% CI 1.8% to 20.5%), 15.7% (95% CI 3.4% to 25.2%), 21.9% (95% CI 12.3% to 25%) and 0% (95% CI 0% to 1%) in the large urban, medium-sized urban, small urban and rural settings, respectively (figure 1, third column, online supplemental figures S1‒S4). The added effect of face mask is minimal in the rural setting because all infections would have been averted by social distancing and contact tracing only (figure 3). This additional decrease contributed towards the cumulative decreases in infections of 100% (95% CI 99.7% to 100%) in the large urban, medium-sized urban and rural settings, respectively, and 98% (95% CI 93.4 to 99.8%) in the small urban setting. The cumulative effect of all three interventions is relatively low in the small urban setting due to the effect of our frequency-dependent disease dynamic, which leads to proportionally large infections in small population centres.
Effects of early intervention
Rolling out early action with the implementation of social distancing, contact tracing and face mask could help avoid rapid growth of the epidemic and mitigate problems related to capacity of healthcare delivery. Compared with a scenario that triggers action after an initial 500 infections, our results show early introduction of 33% effected social distancing, 50% contact tracing coverage and 50% face mask usage lowered the daily numbers of infections by 82·9% (95% CI 77·4% to 91·1%) in the first 90 days, by 81·5% (95% CI 69·7% to 91·4%) in the first 180 days, and by 74·9% (95% CI 39·7% to 91·7%) in the first 365 days (figure 4A). Early introduction of 33% effected social distancing and 50% contact tracing coverage, with no face mask also lowered the daily numbers of infections by 80.9% (95% CI 70·8% to 89·3%) in the first 90 days, by 78·7% (95% CI 72·9% to 88·2%) in the first 180 days and by 43·3% (95% CI 25% to 80·4%) in the first 365 days (figure 4B). These results demonstrate the importance of early action in bringing down the daily number of cases and allowing health facilities to respond better to patients with mild and sever manifestations of SARS-Cov-2 infections.
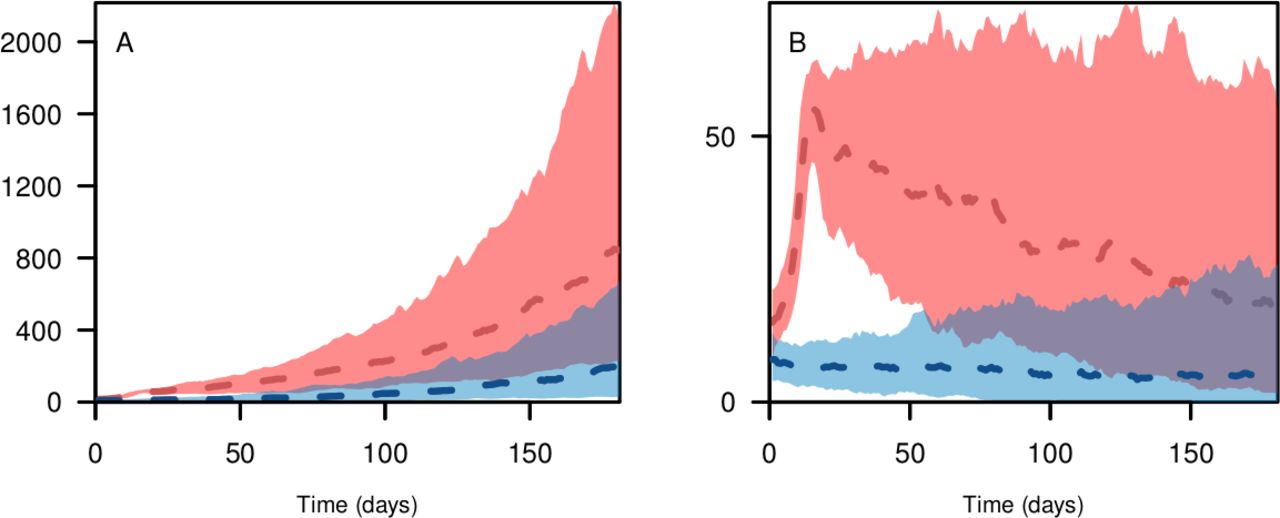
Daily number of infections in a large city of 3 million population in the initial 365 days with non-pharmaceutical interventions implemented at the start of epidemic (blue), or implemented after the number of infections reaches 500 (red), with (A) 33% social distancing and 50% contact tracing assumed and (B) 33% social distancing, 50% contact tracing and 50% face mask use assumed. Curves (broken lines) show the median value and corresponding shaded regions show the 95% credible interval.
Effects of face mask and social distancing measures
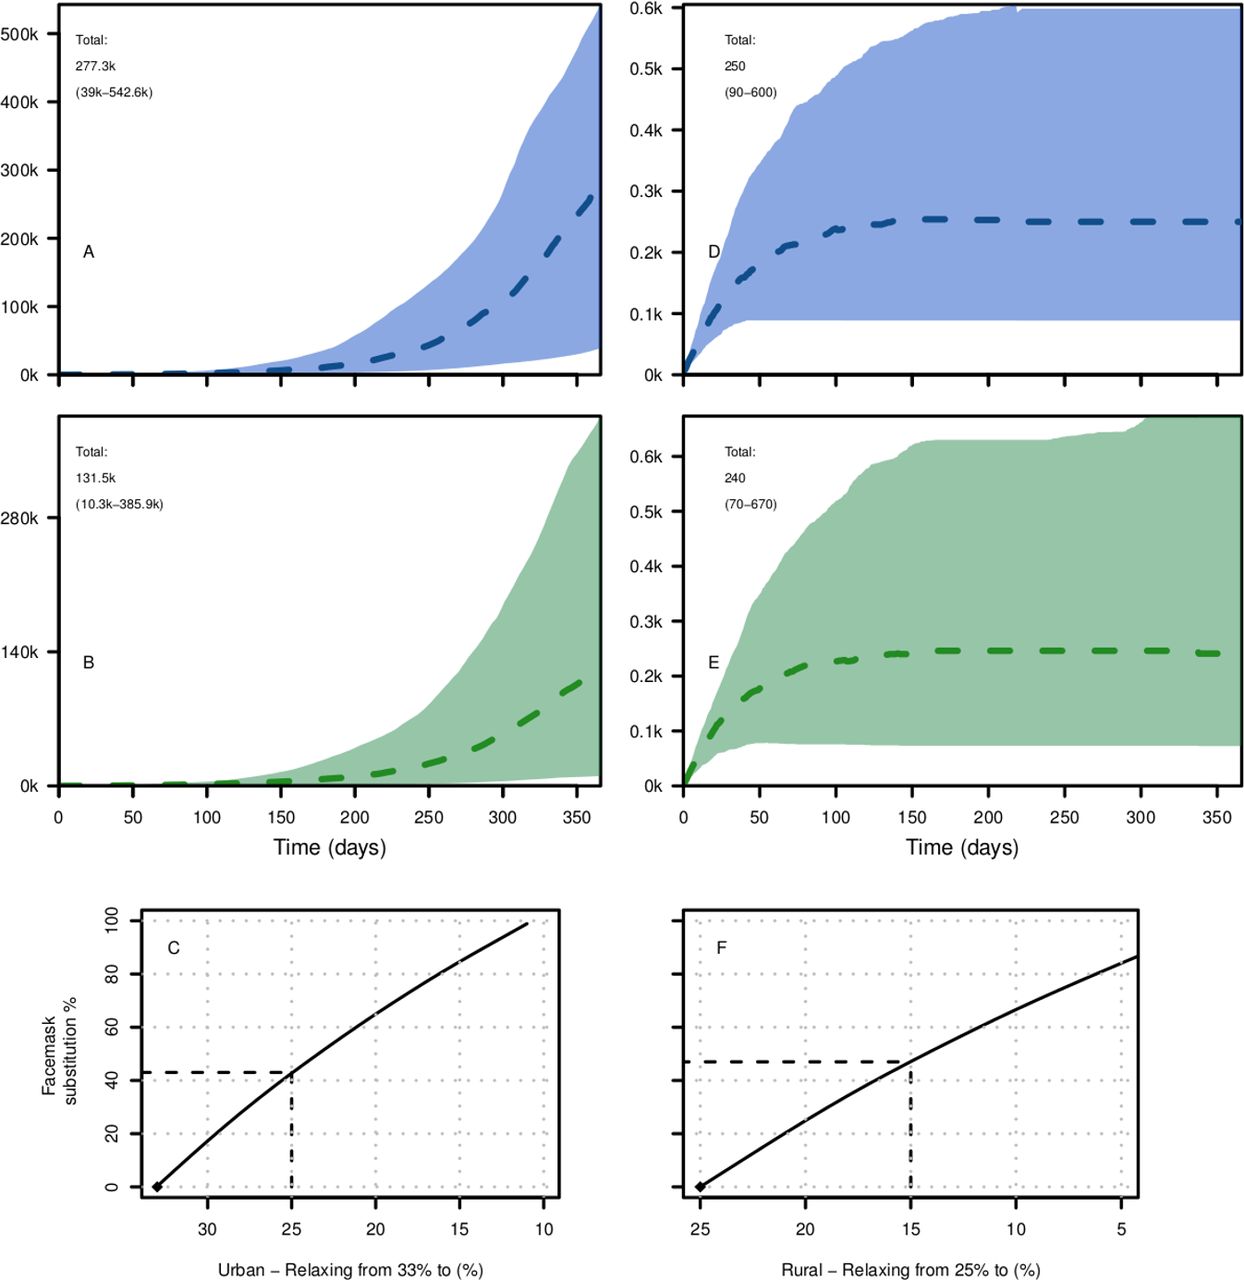
Easing of social distance measures could be a difficult policy decision for many SSA countries affected by this pandemic. To quantify the effect of relaxing social distance measures, we started with a scenario where the initial social distancing effectiveness of 33% in urban 25% in rural areas are maintained in addition to having 50% contact tracing coverage but excluding face mask (figure 5A‒D). We then incrementally lowered the effectiveness of social distancing, while increasing face mask coverage to maintain the same level of infections over 1-year period. Our results show a non-linear association between easing social-distancing and face mask coverage both in urban (figure 5C) and rural settings (figure 5F). Our results further showed that, for the scenario considered, decreasing social distancing from 33% to 25% in urban settings and from 25% to 15% in rural settings would require 43% and 47% coverage of face mask to make up for the increase in the number of infections as a result of decrease in social distancing respectively (figure 5C‒F). These figures are less than the 50% face mask coverage show in figure 5B‒E for urban and rural settings.
Cumulative number of infections in a large city of 3 million population with (A) 33% social distancing and 50% contact tracing, (B) and after relaxing social distancing to 25% social distancing, maintaining 50% contact tracing, and added 50% face mask use. Cumulative number of infections in a large rural district of 200 k population with 25% social distancing and 50% contact tracing assumed (D), and after relaxing social distancing to 15% social distancing, maintaining 50% contact tracing and added 50% face mask use (E). (C, F) Show the coverage of face mask introduced to substitute the effect of relaxing social distancing in the respective urban and rural settings. broken lines in C and F show face mask coverage that would have offset the effect of relaxing social distancing from those shown in A and D, respectively.
Sensitivity analysis
Length of infectious period 1/γ and basic reproduction number R0 were the most significant parameters in driving the force of infection (online supplemental table S1). Changing the distribution of the incubation period from Weibull5 to Gamma9 had no significant effect on the overall outcomes of infection over a year’s period (figure 2, online supplemental figure S5) . Single parameter-based sensitivity analysis, which assumes baseline values for all parameters except the one being assessed, further showed that reproduction numbers R0 along with the effectiveness of social distancing ε, coverage of contact tracing θ, length of infectious period 1/γ and time to contact tracing 1/ϕ had the highest effect on the cumulative infections over a year’s period (online supplemental figures S6‒S16). A further look at multivariate sensitivity analysis27 confirmed that social distancing ε, contact tracing θ, time to contact tracing 1/ϕ and basic reproduction number R0 had the highest effects on the infection numbers in the first year, while face mask coverage τ and effectiveness ω had moderate effects (online supplemental figure S17). Our model was least sensitive to the initial number of infections and incubation period 1/ξ (online supplemental figure S17).
Discussion
Our models have assumed that transmission of COVID-19 occurs at a community level where reported cases may not have any obvious imported sources. By the time such a case is reported and diagnosed, due to delays in reporting and inadequate testing, we assumed that there could be at least 50 infections going around unobserved. This is because even with effective contact tracing and isolation in place, due to possible delays in locating suspects, secondary and tertiary infections may have occurred without being traced and quarantined. We tested our model by considering lower number of initial infections (I<10), which resulted in lower probabilities of an epidemic growth due to the effect of contact tracing and stochasticity in our model leading to zero infections after sometime (not shown).
With the virus rapidly spreading around the world, SSA is anticipating a start of epidemic levels in disease and death rates as seen in other regions, with only 38 314 confirmed cases and 1595 deaths reported in 42 countries as of 30 April 2020.1 Though each African nation’s situation may be unique, patterns of population settlement and physical connectedness, as well as living conditions in most countries can be generalised into one of isolated rural, semirural or large urban settlements, the latter with a possibility of having slum area. We contend our classifications of population centres into three urban locations with population of 100 thousand, one million and three million and two rural districts with population of 100 thousand and 200 thousand represents the reality in most countries in SSA. To decide which scenario best representatives their situation, each country should consider their status of community transmission of SARS-CoV-2, strength of social distancing measures taken, risk of imported new cases, number of confirmed cases, the strength of the field epidemiology work to trace contacts and isolate, presence of isolation facilities, coverage of face mask usage20 and population density and sizes. In population centres where the potential for becoming new epicentre of transmission is high, these measures should be accompanied by travel restrictions between clusters28 to prevent importation of cases.
The effect of non-pharmaceutical interventions is not only in lowering the total attack rate and mortality, but also in slowing build-up of cases and delaying the time to peak transmission, thus allowing hospitals and healthcare systems mobilise their resources to effectively deal with sever and critical cases. This so-called ‘flattening the curve’ scenario14 will allow critical resources, including healthcare workers, hospital beds and medical equipment and supplies, to be used efficiently leading to more lives saved. Our results confirm recent evidences of the effectiveness of social distancing,29 ,30 contact tracing10 11 and face mask use31 against SARS-CoV-2 epidemics.
SSA’s large young population is expected to have relatively lower mortality rates given that the mortality rates so far observed was highest among older population.11 In addition, the majority of the population in SSA live in rural areas where the overall population density is low making natural physical distancing easier, thus mitigating the impact of the SARS-CoV-2 pandemic.7 14 Accordingly, based on age specific fatality rates from China32, age-specific33 proportion of symptomatic cases, and using age distributions obtained from United Nations Population Division,34 our results show interventions would have averted 5.2 k (95% CI 4.7 k to 5.8 k) and 7·5 k (95% CI 7.4 k to 7.5 k), deaths in the large urban setting with 33% social distancing and 50% contact tracing, and the two alternative face mask coverage levels of 0% and 50% respectively (online supplemental methods). When considering age-specific Infection Fatality Rates (IFR) from Europe,22 these mortality averted would be 1.3 k (95% CI 819 to 1.8 k) and 1.9 k (95% CI 1.1 k to 2.9 k), respectively.
Weak health systems, poor access to personal protection supplies, and overcrowded cities and slums that make social distancing a challenge can also exacerbate the spread of the virus. A widespread use of cloth face mask/cover in urban areas thus can alleviate the challenge of social distancing needed to decrease transmissibility of SARS-CoV-2 especially in urban centres where people may find it hard to keep distance.35 SSA countries and regions are advised to take their situation into account36 when they use estimates from these scenarios.
Our model is not without limitations. We have not considered symptomatic and asymptomatic infections separately, which may have overestimated the force of infection due to the lower shedding probability among non-symptomatic COVID-19 cases.9 We also have not assumed preclinical transmissions in our model. In our framework, contact tracing only applies to infectious individuals and not the latent stage, which might have underestimated its effect. We also have assumed that contact tracing will be completely effective with no onward transmission from those individuals suspected of the disease, which may not be realistic given the less optimal process in identifying suspects, and putting them in safe isolated location in many African settings. The estimates that we provided for mortality should also be taken only as rough initial attempts, as not much is known about the case fatality rate in SSA and also potentially high levels of mortality due to the generally poor underlying health and nutritional conditions among all ages in the SSA population. The fact that our model does not have age structure has limited our capacity to make more realistic estimates of age specific mortality. In addition, we did not consider the effect of importations of infected cases and how that may affect the trajectory of incidence in these clusters of population. Finally, COVID-19 has shown large disparities in its severely across geographies, which suggest poor understanding of the disease infectivity, severity and possible evolutionary processes. Thus, the parameters we have used, which are estimated based on transmissions in Asia and Europe, have their own uncertainties and further may not represent the realities in the SSA settings.
Conclusions
We developed a stochastic process-based model with parameters from recent published works, to estimate infections within the first 90 days and 1 year of initial cases for scenarios more realistic to many African settings in terms of population size and capacity to carry out interventions such as lockdown and closure of ports of entry. Our estimates have shown effective contact tracing coupled with social distancing and use of cloth face mask use could significantly bring down the number of infections and associated deaths to manageable levels when implemented early and in combination in urban areas. Our results also shown that the use of social distancing and contact tracing alone can bring the epidemic under control in rural settings. Our model estimates come at a time in which nearly all the African countries, affected by COVID-19, have introduced several non-pharmaceutical interventions including border closures and lockdowns of certain areas. The results in this work could be used to develop strategies of using non-pharmaceutical interventions to minimise impact not only on the number of infections but also on the economic cost of lock down and other stringent social distancing measures. Africa has the lowest testing rate of any part of the world.37 Since testing is a necessary precondition for contact tracing and isolation, countries should scale up their testing, contact tracing and isolation capacities within the short window of opportunity that remains to minimise the local impact of the pandemic.
Acknowledgments
We would like to thank Abigail Maps for her help in editorial works to make the manuscript more readable. We also thank members of the Ethiopian Diaspora High-Level Advisory Counsil on Coronavirus for comments and suggestions in the early stage of the manuscript.
References
Footnotes
Handling editor Seye Abimbola
Contributors DS and AS conceptualised the study. AS led the data analysis and programmed the model. AW, KB, YB and DS contributed to the analysis approaches. All authors interpreted the study findings, contributed to the manuscript and approved the final version for publication.
Funding The authors have not declared a specific grant for this research from any funding agency in the public, commercial or not-for-profit sectors.
Competing interests None declared.
Patient and public involvement Patients and/or the public were not involved in the design, or conduct, or reporting, or dissemination plans of this research.
Patient consent for publication Not required.
Provenance and peer review Not commissioned; externally peer reviewed.
Data availability statement Data are available in a public, open access repository. All code required to reproduce the analysis are available through our github site (https://github.com/asiraj-nd/covid19_ssa) .