Article Text

Abstract
Background Improving the resiliency of healthcare workers is a national imperative, driven in part by healthcare workers having minimal exposure to the skills and culture to achieve work–life balance (WLB). Regardless of current policies, healthcare workers feel compelled to work more and take less time to recover from work. Satisfaction with WLB has been measured, as has work–life conflict, but how frequently healthcare workers engage in specific WLB behaviours is rarely assessed. Measurement of behaviours may have advantages over measurement of perceptions; behaviours more accurately reflect WLB and can be targeted by leaders for improvement.
Objectives 1. To describe a novel survey scale for evaluating work–life climate based on specific behavioural frequencies in healthcare workers.
2. To evaluate the scale's psychometric properties and provide benchmarking data from a large healthcare system.
3. To investigate associations between work–life climate, teamwork climate and safety climate.
Methods Cross-sectional survey study of US healthcare workers within a large healthcare system.
Results 7923 of 9199 eligible healthcare workers across 325 work settings within 16 hospitals completed the survey in 2009 (86% response rate). The overall work–life climate scale internal consistency was Cronbach α=0.790. t-Tests of top versus bottom quartile work settings revealed that positive work–life climate was associated with better teamwork climate, safety climate and increased participation in safety leadership WalkRounds with feedback (p<0.001). Univariate analysis of variance demonstrated differences that varied significantly in WLB between healthcare worker role, hospitals and work setting.
Conclusions The work–life climate scale exhibits strong psychometric properties, elicits results that vary widely by work setting, discriminates between positive and negative workplace norms, and aligns well with other culture constructs that have been found to correlate with clinical outcomes.
- Safety culture
- Surveys
- Teamwork
Statistics from Altmetric.com
Introduction
Individuals who choose to work in healthcare often make personal sacrifices for their work. While the work can be rich with purpose and meaning, the demands on time and attention can be relentless to the point of being unhealthy for the healthcare worker. Regardless of the policies of a given healthcare organisation to promote healthy work–life balance (WLB) for workers, those workers commonly feel the pressure to continually prioritise work. This pressure is intensified by increasing patient complexity and volume, a lack of effective role models who demonstrate appropriate WLB and the enabling technology of mobile devices that do not allow workers to fully separate themselves from the work environment.
Healthcare workers report comfort in tending to their non-work needs such as taking adequate breaks and eating a balanced meal, only when cultural norms, supervisors and surrounding coworkers also demonstrate a commitment to WLB.1 As WLB is more of a cultural or normative-driven variable rather than a policy, it is essential to assess WLB in the context of culture and norms of behaviour. In this study, WLB behavioural frequency is assessed, and these behaviours are associated with common metrics of teamwork climate and safety climate in healthcare settings. In the USA, since the Joint Commission recommended and then required that hospitals routinely measure safety culture, many hospitals have evaluated teamwork climate (consensus of interpersonal relationship norms) and safety climate (shared perceptions of patient safety norms and quality measures in a given work setting).2 ,3 Published studies have linked safety climate and teamwork climate to clinical and operational outcomes.4–6
Focusing on the frequency of WLB behaviours such as how often a group of people skip meals or get home late from work circumvents some of the limitations with using scales and theories that emphasise satisfaction with work–family balance versus work–family conflict.7 Recent research has suggested that traditional WLB scales do not adequately measure the conflicts experienced by people without children.8 One frequently used method is to include a single WLB item. The leading researcher in assessing and understanding the prevalence and severity of physician burnout, Dr Tait Shanafelt, uses a single item: ‘My work schedule leaves me enough time for my personal/family life’ (response options were strongly agree to strongly disagree).9 A single item, while parsimonious, may not be very actionable for those charged with improving their workers' WLB. Finally, focus on universally applicable behaviours circumvents methodological conundrums identified in the literature such as work interfering with family, or marital problems interfering with work.10 Using a previous unexplored WLB dataset, this study explores the reliability, validity and initial benchmarking data of a WLB scale based on the frequencies of specific behaviours, rather than satisfaction with WLB.
Methods
Design and study population
This is a cross-sectional study of survey data collected in 2009 from 7923 healthcare workers across 325 work settings within 16 hospitals of a faith-based health system on the West Coast of the USA. Of these work settings, 319 had five or more respondents. Of these 319 work settings, 292 (92%) provided sufficient data for analysis of WLB, in that every respondent answered at least five of the seven questions regarding WLB items. This was a survey conducted every 18 months that included a variety of safety culture, employee engagement and WLB-related items. All staff with a 50% or greater full-time equivalent commitment to a specific patient care area for at least four consecutive weeks prior to survey administration were invited to complete the questionnaire, regardless of their involvement in patient safety endeavours. This included staff physicians, registered nurses (RN), charge nurses, nurse managers, physician assistants/nurse practitioners, licensed vocational nurses (LVN)/licensed practicing nurses (LPN), hospital aides, physical therapists, occupational therapists, pharmacists, respiratory therapists, technicians, ward clerks/unit secretaries, medical administrators and others. All work settings within each hospital and its affiliated ambulatory clinics were asked to participate. Paper surveys were administered and collected during pre-existing departmental and staff meetings.
The survey was comprised of demographic items, the Safety Attitudes Questionnaire (SAQ),11 intention-to-leave items, burnout items,12 depression items (CESD-10)13 and items pertaining to WLB behaviours. Together, these instruments constituted the ‘survey’ administered across all 16 hospitals. The SAQ is a psychometrically sound instrument for assessing safety-related climate domains regarding safety, teamwork, job satisfaction, stress recognition, perception of management and working conditions by systematically seeking input from front-line caregivers.11
Measurement of work–life climate
WLB items were adapted from the College Activities and Behaviour Questionnaire.14 The original stand-alone items did not form a composite scale, but rather were designed to be interpreted at face value. For our purposes, however, we modified the items of relevance to healthcare workers and examined their internal consistency as a scale. The final version of the scale contains seven phrases: during the past week, how often did this occur?
Skipped a meal
Ate a poorly balanced meal
Worked through a day/shift without any breaks
Arrived home late from work
Had difficulty sleeping
Slept <5 hours in a night
Changed personal/family plans because of work
The response scale for the work–life climate items ranges from: rarely or none of the time (<1 day); some or a little of the time (1–2 days); occasionally or a moderate amount of time (3–4 days); all of the time (5–7 days); and not applicable. An eighth item was created to reflect frustration in technology (‘Felt frustrated by technology’) subsequent to data collection; so, it was not available for analysis here. Together, these items reflect self-care and work–life norms at the individual, and when aggregated, at the group level.
Statistical analysis
Reliability analyses were used to evaluate the seven-item work–life climate scale. Internal reliability was assessed using Cronbach's α. Analysis of variance (ANOVA) was used to test for differences on the work–life climate scale score by hospital, work setting, healthcare worker role, gender, shift, patient population and years of working in each setting. Independent sample t-tests were also used to explore differences between quartiles. Work–life climate scale scores were computed by taking the mean of the seven items for each respondent using the 4-point scale (1 for rarely or none of the time (<1 day), 2 for some or a little of the time (1–2 days), 3 for occasionally or a moderate amount of time (2–4 days), 4 for all of the time (5–7 days)). Work–life climate scales were computed for the work setting by calculating the percentage of respondents with a scale score equivalent of <1 day or 1–2 days per week engaging in a specific behaviour (a 1 or a 2 on the 4-point scale). In addition to the means, we also report the per cent positive (% reporting behaviour 2 days a week or less) for items and scale scores of each healthcare worker role, work setting and hospital. We call this ‘percentage positive’ or ‘percentage reporting good work–life climate’. Exploratory analyses were conducted to put work–life climate into context by correlating mean work–life climate scores with mean teamwork climate and safety climate from the same survey using exploratory Spearman correlations. Additional correlations were made with other items in the same survey that were thematically related to WLB but not included in the work–life climate scale. All statistical analyses were performed using IBM SPSS V.22.
Results
Respondent demographics
There were 7923 surveys returned from the 16 hospitals studied. Overall response rate was 86% (7923 out of 9199 possible respondents). Demographic data for the entire sample is presented in table 1.
Respondent demographics and work–life climate Cronbach's α by demographic grouping
RNs accounted for 35% of respondents (n=2797), technicians 13% (n=1036), clinical support 11% (n=890), administrative support 8% (n=664), therapists 7% (n=555), nurse managers 4% (n=318), LVN/LPNs 3% (n=233), attending physicians 3% (n=230), other managers 1.4% (n=110) and pharmacists 1.3% (n=101). Less than 1% of the sample was comprised of resident physicians (n=54), physician assistants/nurse practitioners (n=52), social workers (n=48), environmental support (n=42), nutritionists (n=41) and fellows (n=4). A total of 3.7% of respondents did not identify with one of the listed healthcare worker roles. Respondents were predominantly female (75%) and day shift workers (59%), with diversity in the years of experience in their specialty. Missing data for each of the items ranged from 3.7% to 10.8%.
Work–life climate scale internal reliability and correlations with teamwork climate, safety climate, work–life-related items not in the final work–life climate scale
The overall work–life climate internal consistency was α=0.79 (table 1). By hospital, work–life climate internal consistency ranged from α=0.75 to α=0.82. Analyses of all responses regarding teamwork climate and safety climate were α=0.77 and α=0.78, respectively. Spearman correlation among the seven items in the work–life climate ranged from r=0.24 to r=0.57, p<0.001. A correlation matrix demonstrating a Spearman correlation of work–life climate with teamwork climate was r=0.31, p<0.001; and with safety climate was r=0.28, p<0.001, and is presented in table 2.
Correlation matrix among the work–life climate, teamwork climate and safety climate scales and convergent validity with related individual items not included in the work–life climate scale
Spearman correlation of individual items thematically similar to WLB, which were not in the final work–life climate scale, is also included in table 2. Spearman correlation of ‘arguing with a coworker’ with work–life climate was r=0.291, p<0.001, and with safety climate was r=0.293, p<0.001. Spearman correlation of ‘arguing with a coworker’ with teamwork climate was less (r=0.225, p<0.001).
Work–life climate scale quartiles
The mean work–life climate scale score across the 292 clinical work settings was M=54.54, SD=17.84, ranging from 0% to 100% of respondents reporting positive work–life climate. Work settings in the bottom quartile ranged from 0% to 42.9% of respondents reporting positive work–life climate, M=31.97, SD=11.20, and those in the top quartile ranged from 67% to 100% of respondents reporting positive work–life climate, M=77.00, SD=11.20 (table 3).
Top versus bottom work–life climate quartiles across work settings—individual WLB items, teamwork items and safety items
Independent sample t-tests indicated that top and bottom quartile work–life climate scores were statistically different in all seven individual items in our overall work–life climate scale (table 3).
Relationship to teamwork climate, safety climate and senior leadership WalkRounds
After evaluating the overall work–life climate scale, we compared this scale with the assessments of teamwork and safety climates which are other culture constructs that have been found to correlate with clinical and organisational outcomes. As demonstrated in table 3, independent sample t-tests indicated that top and bottom quartile work–life climate scores were associated with significant differences in teamwork climate t=4.88 (p<0.001) and safety climate t=4.33 (p<0.001). Table 3 provides data on the overall teamwork and safety climate differences between work settings in the top and bottom work–life climate quartiles, as well as the differences between the individual items which make up both the teamwork climate and safety climate. Participants indicating that they had received feedback about risks reduced as a result of WalkRounds (t=4.46, p<0.001) were also found to be statistically different between the work settings in the top and bottom quartiles for WLB. Figure 1 demonstrates the statistical differences in teamwork, safety and WalkRounds, with feedback between all four quartiles.

Differences between teamwork climate, safety climate and WalkRounds feedback between work settings divided into work–life climate quartiles. Each bar is the mean of the per cent positive responses for each work setting within a quartile.
Work–life climate scale variation by healthcare worker role, hospital and work setting
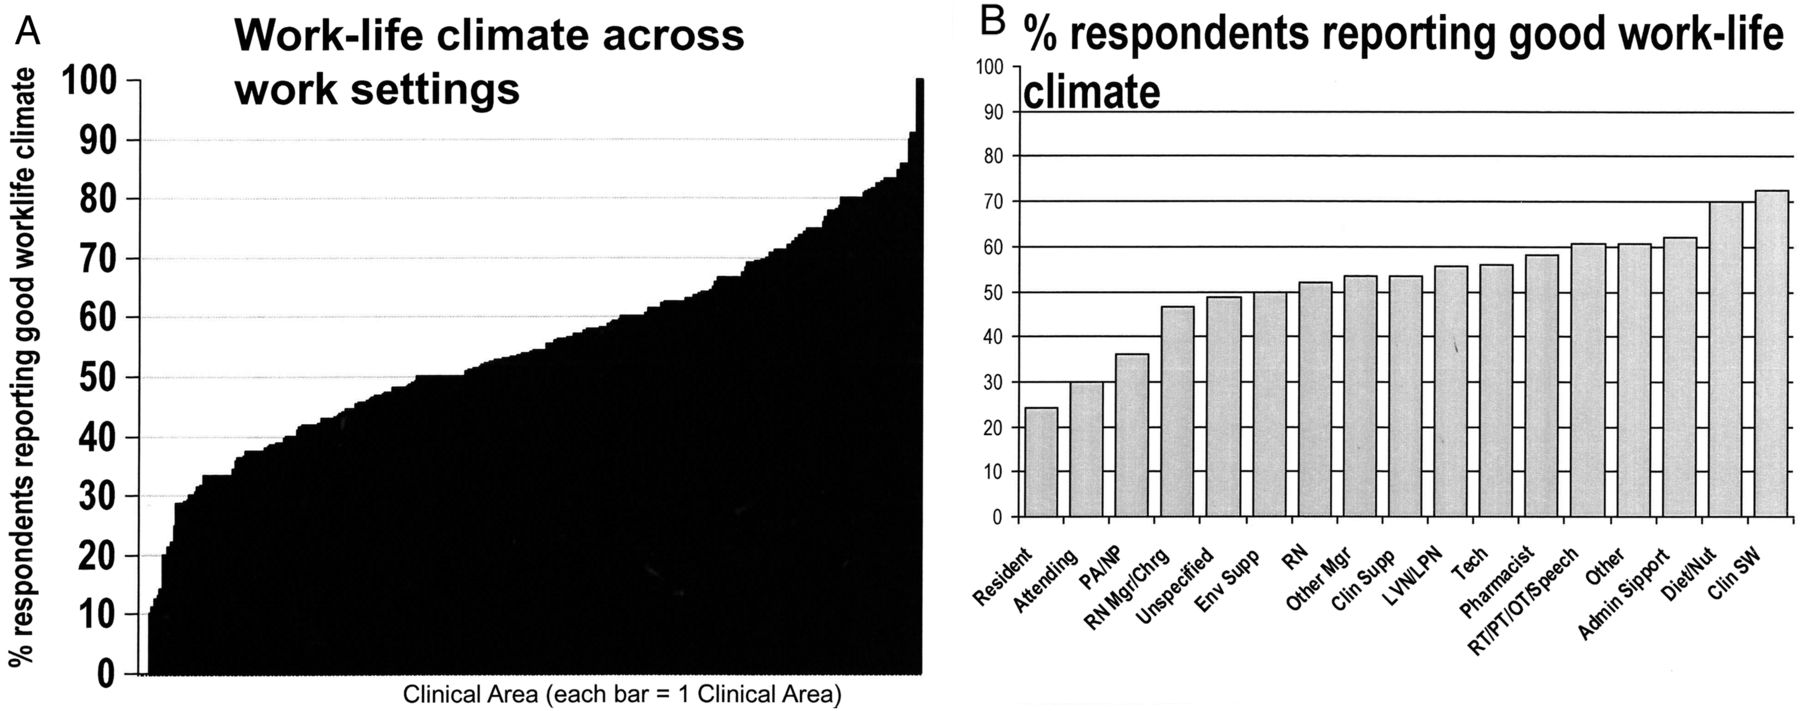
Univariate ANOVA demonstrated significant differences in work–life climate scale between healthcare worker role (F (17, 6812)=10.70, p<0.001), hospitals (F (14, 6815)=7.27, p<0.001) and work settings (F (291, 6538)=2.63, p<0.001). Figure 2 shows the per cent reporting good work–life climate (the scale score equivalent of performing specific behaviours 2 days per week or less) by healthcare worker role and by the 292 different work settings. Among healthcare worker roles, physicians (both resident and attending physicians), followed by nurse practitioners and physician assistants, report engaging in poor WLB behaviours most frequently. Further analysis using univariate ANOVA demonstrated significant differences in work–life climate scale by gender (F (1, 6550)=12.37, p<0.001), shift (F (3, 6121)=47.24, p<0.001), patient population (caring for adults, paediatric patients or both) (F (2, 5870)=9.08, p<0.001) and years in specialty (F (6, 6508)=2.18, p=0.042). Work–life climate was poorest among males, 12-hour shift workers, and evening and variable shift workers.
Good work–life climate or per cent positive is defined by those who reported performing the specific poor work–life balance behaviours 1–2 days/week or <1 day/week. The graph on the left shows the percentage of respondents reporting good work–life climate by each clinical work setting. The graph on right shows percentage of respondents reporting good work–life climate by healthcare worker role. LPN, licensed practising nurses; LVN, licensed vocational nurses; RN, registered nurses.
Discussion
Despite a growing concern about the psychosocial experiences of contemporary healthcare workers and an increased focus on this area as physician burnout and job dissatisfaction continue to increase, there are limited validated methods for measuring WLB in healthcare.9 ,15–17 Previously published literature often uses a single item: ‘My work schedule leaves me enough time for my personal/family life’ (response options were strongly agree to strongly disagree).9 A similar question on our survey, ‘Scheduling problems in this clinical area sometimes interfere with my quality of life’ (response options were strongly agree to strongly disagree), was an item that correlated well with our behavioural frequency work–life climate scale. Shanafelt demonstrated that more than half of US physicians are burned out and that satisfaction with WLB in the US physicians has worsened in the past 5 years.18 Consistent with prior evidence of the growing prevalence of physician burnout,9 ,18 the current study demonstrates that out of all healthcare workers surveyed, physicians (both resident and attending physicians), followed by nurse practitioners and physician assistants, report the greatest work–life imbalance, by reporting engaging in poor WLB behaviours three or more times per week. Moreover, these results suggest that work–life climate differs based on healthcare worker role and varies significantly by hospital and work settings.
This study found the survey scale for evaluating work–life climate in healthcare workers using behavioural frequency to be a reliable measure that exhibits strong psychometric properties. The scale elicits results that vary widely by work setting, discriminates between positive and negative workplace norms, and aligns well with other culture constructs that have been found to correlate with clinical and organisational outcomes. This is a unique survey eliciting questions specific to behavioural frequency to evaluate WLB. Surveying behavioural frequency does not elicit the same negative connotations and emotional reactions as does asking questions related to burnout or depression, because it is not specific to family, marital, or parental satisfaction or conflict. In addition, perhaps by focusing on behaviours, as they relate to work–life climate, healthcare workers will provide answers with honesty and higher accuracy.
The study results demonstrate that higher work–life climate scores are associated with improved teamwork and patient safety related norms and behaviours. Statistically significant differences were present in both teamwork climate and safety climate when comparing the top and bottom work–life climate quartiles, and better work–life climate scores were associated with both higher teamwork and safety climate scores across all quartiles. This statistically significant association is seen in the stair-step linear increases in both teamwork and safety climate scores, as illustrated in the progression from the bottom to top work–life climate quartiles. In the USA, the Institute of Medicine's landmark study, ‘To Err is Human’, ushered in an era of medicine focused on quality improvement to improve patient safety and limit preventable medical errors.19 In response to that publication, both the Institute of Medicine and Joint Commission have recommended evaluating safety culture and promoting effective team functioning as a method to create safe systems of healthcare delivery.3 ,20 Infrequent teamwork behaviours have been linked to poor patient outcomes, including major surgical complications and death.5 The link between work–life climate, teamwork climate and safety climate offers a new focus for intervention for leaders looking to improve healthcare quality.
Within the teamwork and safety climate items, the largest difference between quartiles was seen with the items ‘Disagreements in this clinical area are appropriately resolved’ and ‘I receive appropriate feedback about my performance’. A better overall work–life climate encourages appropriate responses even when encountering disagreements. Conversely, if staff is tired, hungry, late coming home or has not had a break in 12 hours, they are substantially less likely to be appropriate in disagreements, giving feedback or even feeling encouraged to promote proactive safety at work.
The link between WLB and feedback on WalkRounds with senior leaders, a quality improvement initiative, is preliminary evidence that work–life climate may be responsive to interventions.21 At the very least, it suggests that work–life climate can discriminate between work settings that do and do not participate in WalkRounds with feedback. As exemplified in figure 1, those work settings in the top quartile of work–life climate were almost twice as likely to experience WalkRounds with feedback about the risks that were reduced by ongoing safety initiatives from senior leaders. This evidence is consistent with the previous studies which demonstrated physicians with a lack of supervisory support tend to feel more emotionally exhausted, feel burdened with a heavier workload and describe increased work–family conflicts.22 Within the teamwork and safety climate items, one of the most statistically significant differences between the top and bottom work–life climate quartiles involved receiving appropriate feedback about performance (t value of 5.08, table 3). It is likely that feeling supported and receiving feedback on the merit of your work is a protective barrier against multiple emotionally exhaustive burdens. Published literature supports that even small changes on specific stressful working conditions such as reduced interruptions and conflicting demands, as well as improved coordination and support among teams, may be beneficial for improving working conditions and promoting quality of patient care.23 Given prior evidence that linked improved safety climate and reduced burnout with senior leadership WalkRounds,21 the addition of these WalkRounds might be used to specifically address issues and concerns regarding WLB, such as inquiring about eating a balanced meal, taking breaks during a shift or getting more than 5 hours of sleep in a night. Healthcare workers are more likely to demonstrate a commitment to WLB if this is a cultural norm supported by leaders and coworkers.1 Coworkers expressing concern about each other's personal well-being has been shown to be crucial in shaping positive workplace emotional cultures. Positive emotional cultures correlate with diminished rate of burnout, boosted rates of job satisfaction and increased patient satisfaction, patient family's satisfaction and patient mood.24
Given the content among the seven WLB items, work–life climate can be defined as the ability of a respondent to maintain personal boundaries such as eating, sleeping and taking breaks. The moderate amount of shared variance among the work–life climate items indicates that the frequencies of behaviours that violate personal boundaries are relatively consistent across these WLB domains. In addition to the shared variance among the items, univariate ANOVAs demonstrate there is a high degree of consistency within a work setting but not between work settings, which is the hallmark of a climate. Work–life climate is a related but distinct climate from other known healthcare climates including teamwork and safety. As demonstrated by Spearman correlation (table 2), work–life climate is more strongly correlated than teamwork and safety climate in relation to themes such as problematic scheduling and quality of life, feeling irritable and tired, dozing off at inappropriate times and dealing with unexpected emergencies. How often one argues with coworkers is an item with similar correlations across work–life, teamwork and safety climates.
There are several limitations of this study. We did not compare our work–life climate scale with other WLB scales in the literature.9 Our work–life climate scale focuses on concrete behaviours to evaluate the scale between work and non-work activities instead of using work–family conflict ratings or scales. Nevertheless, this methodological advance circumvents historical deficits with satisfaction scales and scales including the word ‘family’ in their items, by focusing exclusively on the frequencies of universal behaviours. Furthermore, we relied upon self-reported data from healthcare workers without any independently observable behaviours or outcomes. However, this is common practice for culture assessments in healthcare. The cross-sectional design of the study limits generalisability and causal effects when interpreting the relationship to teamwork and safety cultures. However, the clear association demonstrates a potential new focus on WLB for initiatives to improve teamwork and safety, and thus improve overall quality in healthcare. Our results focused on all members of the healthcare team. A higher percentage of respondents were nurses, as there are often more nurses than physicians or social workers within a hospital. However, we had excellent response rates from all healthcare worker roles. WLB differs among the healthcare roles, and future research could uniquely focus on each individual role. Furthermore, future research should look to focus on additional interventions to improve overall WLB and determining a threshold of how often poor WLB behaviours can occur before seeing detriments in work–life climate and safety climate.
Conclusion
The work–life climate scale is a novel and reliable tool to evaluate the overall WLB among healthcare workers. It correlates with teamwork and safety climate in a wide variety of clinical settings. The potential relationship with feedback on executive rounding suggests that work–life climate may be responsive to intervention, opening the door for initiatives that improve teamwork and safety by focusing on WLB. Interventions targeting improvements in WLB behaviours within a work setting could improve culture, with the ultimate goal of improving quality in healthcare. Healthcare workers are heralded for pushing the envelope of WLB, but data suggest better balance improves safety and teamwork. Ultimately, improving WLB among healthcare providers is likely to improve both the lives of the individual healthcare worker and the quality of the healthcare their patients receive.
References
Footnotes
Competing interests None declared.
Ethics approval Institutional Review Board at Duke University, Durham, North Carolina (Pro00033155).
Provenance and peer review Not commissioned; externally peer reviewed.