Article Text

Abstract
Objective: To construct a conceptual model of tobacco industry tactics to undermine tobacco control programmes for the purposes of: (1) developing measures to evaluate industry tactics, (2) improving tobacco control planning, and (3) supplementing current or future frameworks used to classify and analyse tobacco industry documents.
Design: Web based concept mapping was conducted, including expert brainstorming, sorting, and rating of statements describing industry tactics. Statistical analyses used multidimensional scaling and cluster analysis. Interpretation of the resulting maps was accomplished by an expert panel during a face-to-face meeting.
Subjects: 34 experts, selected because of their previous encounters with industry resistance or because of their research into industry tactics, took part in some or all phases of the project.
Results: Maps with eight non-overlapping clusters in two dimensional space were developed, with importance ratings of the statements and clusters. Cluster and quadrant labels were agreed upon by the experts.
Conclusions: The conceptual maps summarise the tactics used by the industry and their relationships to each other, and suggest a possible hierarchy for measures that can be used in statistical modelling of industry tactics and for review of industry documents. Finally, the maps enable hypothesis of a likely progression of industry reactions as public health programmes become more successful, and therefore more threatening to industry profits.
- tobacco industry tactics
- concept mapping
- tobacco control programmes
- ASSIST, American Stop Smoking Intervention Study
- MDS, multidimensional scaling
- UCSF/ANRF, University of California San Francisco/American Nonsmokers Rights Foundation
Statistics from Altmetric.com
- ASSIST, American Stop Smoking Intervention Study
- MDS, multidimensional scaling
- UCSF/ANRF, University of California San Francisco/American Nonsmokers Rights Foundation
A substantial peer reviewed literature exists describing the great variety of strategies and tactics the tobacco industry uses to undermine public health. A good deal of this work has documented, at least qualitatively, the tobacco industry’s specific actions to prevent or undermine tobacco control programmes and organisations.1–10 The tobacco industry has been concerned that large scale, comprehensive tobacco control programmes would reduce smoking and thus reduce profits.11,12
A prime example of a programme that the industry perceived as a threat was the American Stop Smoking Intervention Study (ASSIST)13,14 which was the first, large multi-state initiative (1991 to 1999) that sought to reduce tobacco use by changing the sociopolitical environment through media and policy advocacy, and the development of state infrastructure to deliver tobacco control.15 Given its scope, it is not surprising that ASSIST caught the attention of the tobacco industry. For example, Andrew H Tisch, then chairman and CEO of Lorillard Tobacco Company, delivered a speech in 1992 that described how threatening the ASSIST programme was to the industry.16
A major purpose of the ASSIST project was the evaluation of its effects. Detailed measures were collected on both the programmes (including the capacity, resources, and efforts involved in implementing the various programme components) and outcomes (both intermediate and long term). However, because of the presence of the industry, tobacco control programmes cannot be evaluated like most other programmes. While local, state, and federal governments are expending resources to reduce smoking rates and promote tobacco control, the tobacco industry is expending significant resources to promote sales of their product, influence governments, and undermine these programmes. The industry’s anti-tobacco control efforts constitute a countervailing force to tobacco control programmes that needs to be considered when evaluating programme effectiveness since industry efforts could actually swamp any impact coming from these programmes, reduce measurable outcomes, and lead to an underestimation and devaluation of the impact and effectiveness of tobacco control efforts.
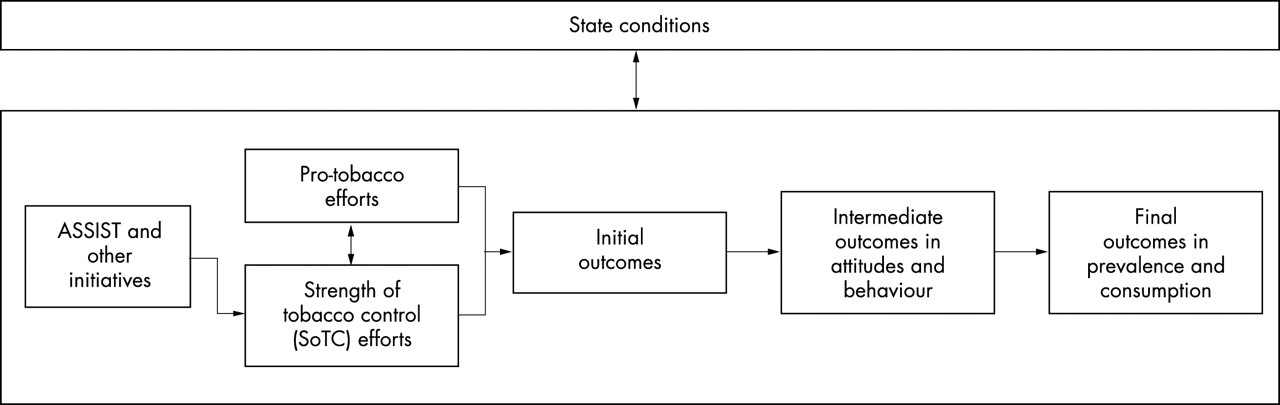
The ASSIST evaluation was the first major tobacco control evaluation to hypothesise a relationship between the industry’s anti-tobacco control efforts and the programme.17 ASSIST included the construct of pro-tobacco efforts in the overall evaluation model (fig 1). However, before this construct can be operationalised, it needs to be conceptualised well. Categorising the dimensions of anti-tobacco control tactics and building a comprehensive model of these actions is a necessary first step toward development of measurable components and indices that can be used in programme evaluation. While originating in connection with the ASSIST initiative, this problem of accounting for industry counter-efforts is not limited to that context alone, but is of relevance in the evaluation of any tobacco control programme.

General conceptual model for the ASSIST evaluation.17
Currently, there is no overarching conceptual model that could guide operationalisation of measures of industry tactics that might be useful for evaluation. Outside of the informal and anecdotal literature on specific industry tactics, about the closest thing to a current standardised framework that might be applicable for describing industry tactics is the UCSF/ANRF Tobacco Documents Thesaurus, a detailed glossary of terms used to index tobacco industry documents.18 However, the Thesaurus was not designed to provide a conceptual framework for tobacco industry tactics. It is essentially a vocabulary of standard subject terms, or keywords, used to index and describe all documents in the tobacco control field.19,20 While essential for document research, it has little utility for operationalising measures of industry tactics.
This paper describes the development of a comprehensive conceptual map of the tactics that the tobacco industry uses to undermine tobacco control efforts. The resulting conceptual map, developed in the context of the ASSIST evaluation, has utility beyond that context for the development of measures for programme evaluation, for improving strategic level tobacco control programme planning, and for informing current or future frameworks used to classify and analyse tobacco industry documents.
METHODS
The concept mapping methodology21 was used to develop the conceptual model of pro-tobacco tactics. Concept mapping is a participatory mixed methods approach that integrates group process activities (brainstorming, unstructured pile sorting, and rating of the brainstormed items) with several multivariate statistical analyses (multidimensional scaling and hierarchical cluster analysis) to yield both statistical and graphic representations of a conceptual domain.
Participants
The participants were selected because they had previously encountered overt industry resistance to tobacco control programming and/or research, had published research arising from searches of the industry documents, or had otherwise demonstrated understanding of industry challenges to tobacco control. Among those represented, all were from the USA, 15 were academics, seven represented advocacy organisations, seven contract research organisations, four government agencies, and five were from tobacco control funding organisations (classifications not mutually exclusive). All participants (n=34) utilised a web based program* to participate in the mapping process (brainstorming, or sorting and rating, or both). A subset of this group (n=13) participated in a face-to-face expert panel to interpret the results of the electronic mapping process.
Procedures
The general procedure for concept mapping is described in detail elsewhere.21 There were four distinct phases in the process: brainstorming, sorting and rating, data analyses and generation of the maps, and expert panel interpretation of the maps.
Brainstorming
The experts logged on to a private web page over a four week period. Each brainstormed statement was generated in response to the prompt: “One specific activity/tactic the tobacco industry uses to oppose tobacco control is . . .” They entered the statements in a list without regard to structure, hierarchy, or clustering of statements. The process resulted in generation of 226 statements.
In preparation for the sorting and rating task, the 226 statements were edited and consolidated. The process used was one of grouping statements that were similar, then constructing one statement that captured the content of the group of statements. The goal was to have a set of mutually exclusive statements, with only one main idea in each, and with no loss of content from the original list. In this manner, the original 226 statements were consolidated into the final set of 88 statements.†
Sorting and rating
Twenty one of the experts were asked to log on to another web page for the sorting and rating tasks. Each conducted an unstructured sorting of the statements.22–24 They grouped the brainstormed statements into piles “in a way that makes sense to you”. The only restrictions in this sorting task were that each statement could not be its own pile, there could not be a pile consisting of all the statements, and there could be no “miscellaneous” pile (any item thought to be unique was to be put into its own pile). Each expert was asked to supply a brief label that summarised the contents of each of their groups/piles.
Each participant was then asked to rate the 88 statements with these instructions: “Rate each statement on a 1 to 5 scale for its relative importance in undermining tobacco control efforts. Use a 1 if the statement is relatively unimportant (compared to the rest of the statements) in undermining tobacco control efforts; use a 5 if it is extremely important. Although every statement probably has some importance (or it wouldn’t have been brainstormed), try to spread out your ratings and use each of the five rating values at least several times.”
Data analyses and generation of the maps
The analyses‡ began with construction from the sort information of a binary, symmetric matrix of similarities. For any two items, a 1 was assigned if the two items were placed in the same pile by the participant, otherwise a 0 was entered.23 The total similarity matrix was obtained by summing across the individual matrices. Thus, any cell in this matrix could take integer values between 0 and 22 (the number of people who sorted the statements); the value indicates the number of people who placed the pair in the same pile. In addition, in this analysis the final matrix was filtered by changing any matrix values of 1 to a 0. In effect, this means that there needed to be at least two participants who place any two statements together in order for them to be considered at all similar. This filtering helps minimise the effects of any errors or spuriousness in sorting on the final results.
The total similarity matrix was analysed using non-metric multidimensional scaling (MDS) analysis25 with a two dimensional solution. The solution was limited to two dimensions because of ease of use considerations.26
The x,y configuration output from MDS was the input for the hierarchical cluster analysis utilising Ward’s algorithm27 as the basis for defining a cluster. Using the MDS configuration as input to the cluster analysis in effect forces the cluster analysis to partition the MDS configuration into non-overlapping clusters in two dimensional space. There is no simple mathematical criterion by which a final number of clusters can be selected. The procedure followed here was to examine an initial cluster solution that was the maximum thought desirable for interpretation in this context. Then, successively lower cluster solutions were examined, with a judgment made at each level about whether the merger seemed substantively reasonable.
The MDS configuration of the statement points was graphed in two dimensions. This “point map” displayed the location of all the brainstormed statements with statements closer to each other generally expected to be more similar in meaning. A “cluster map” was also generated that displayed the original statement points enclosed by polygon shaped boundaries that depict the clusters.
The 1 to 5 importance rating variable was averaged across persons for each item and each cluster. This rating information was first depicted graphically in a “point rating map” showing the original point map with the average rating per item displayed as vertical columns in the third dimension and, second, in a “cluster rating map” that showed the cluster average rating using the third dimension.
Expert panel interpretation of the maps
A panel of 13 tobacco control experts who were members of the larger group was convened for a face-to-face meeting to review and interpret the results of the mapping process. The interpretation session followed a structured process described in detail in Trochim.21 Participants examined the maps to determine whether they made intuitive sense and to discuss what the maps might imply about the ideas that underlie their conceptualisation. They discussed each cluster until a consensus was reached on an acceptable cluster label. Participants then examined the labelled cluster map to identify any interpretable groups of clusters or “regions”. These were discussed and partitions drawn on the map to indicate the different regions. Just as in labelling the clusters, the group then arrived at a consensus label for each of the identified regions. This step-by-step interpretation culminated in a discussion of the overall meaning of the various maps and representations, and in the articulation of a conceptual model of pro-tobacco tactics.
RESULTS
The usual statistic that is reported in MDS analyses to indicate the goodness-of-fit of the two dimensional configuration to the original similarity matrix is called the “stress value”. A lower stress value indicates a better fit. In a study of the reliability of concept mapping, Trochim reported that the average stress value across 33 projects was 0.285 with a range from 0.155 to 0.352.28 The stress value in this analysis was 0.237, which is better (that is, lower) than average.
The pattern of judgments of the suitability of different cluster solutions was examined and resulted in acceptance of an eight cluster solution as the one that both preserved the most detail and yielded substantively interpretable clusters of statements. The 88 statements are shown in table 1 in descending order by average importance within the eight clusters, along with their standard deviations. The point cluster map in fig 2 shows all of the pro-tobacco tactics statements (points) in relation to each other.
Statement numbers, statements within clusters listed in descending order of average importance, and importance rating mean and standard deviation (SD)
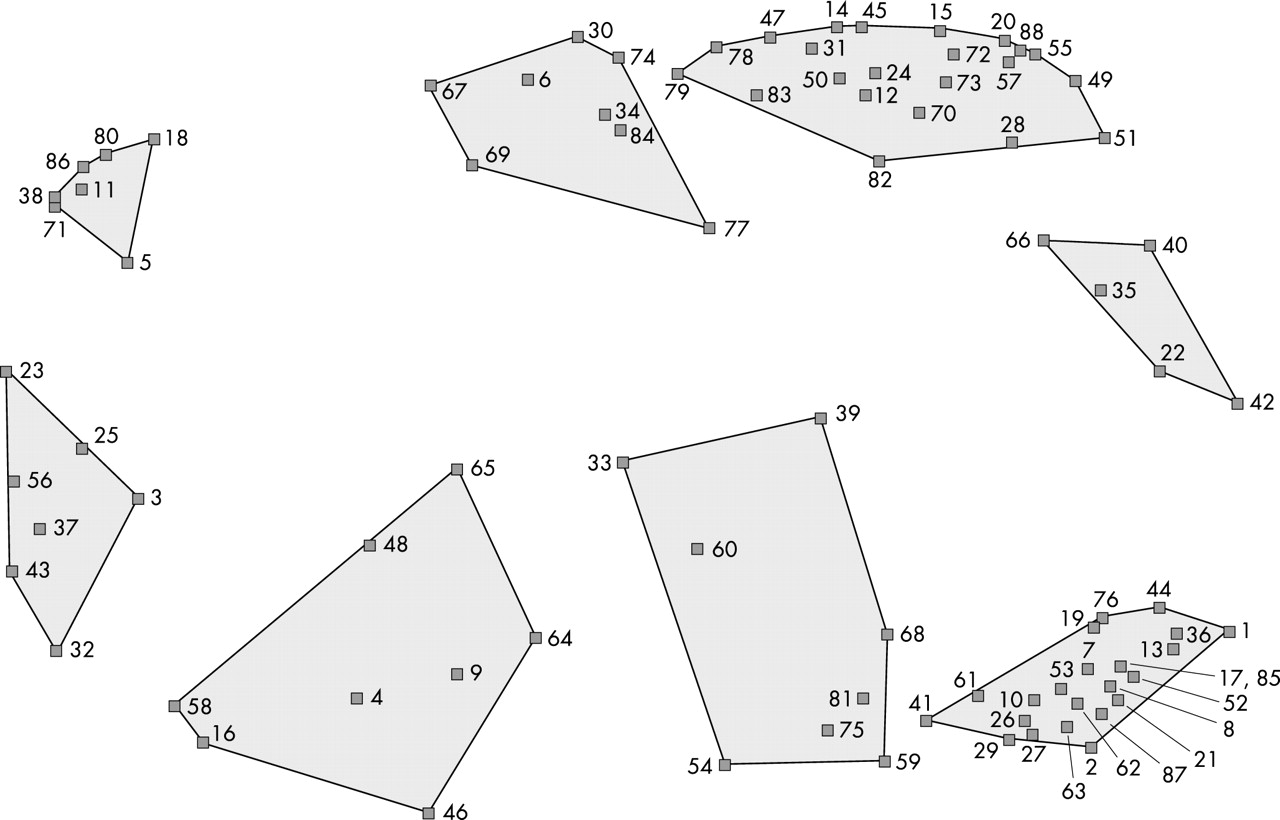
Point cluster map showing the multidimensional scaling arrangement of the 88 statements with the eight cluster solution superimposed.
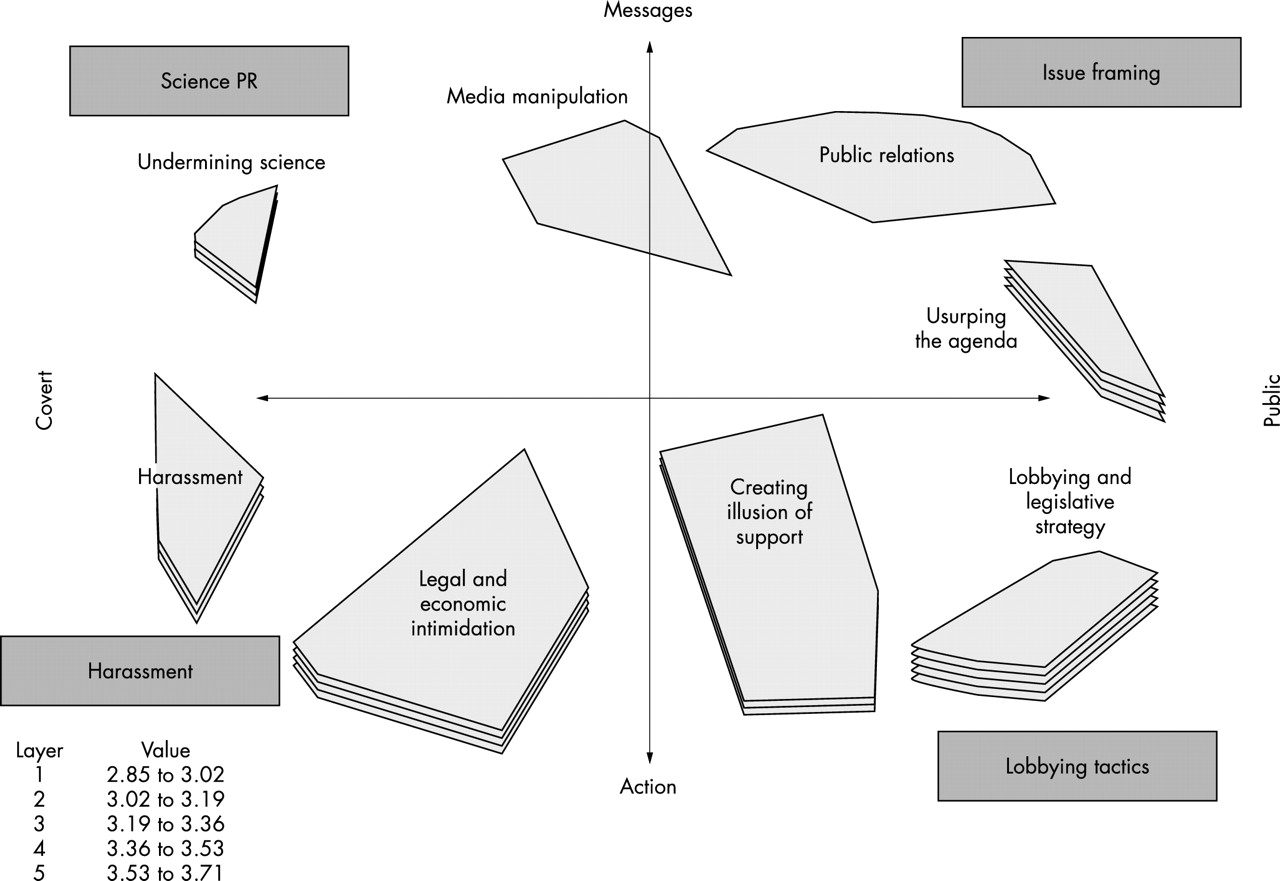
Figure 3 shows the cluster rating map where the layers of each cluster depict the average importance rating, with more layers equivalent to higher importance. Note that the average represented by the layers in the map is actually a double averaging—across all of the participants and across all of the factors in each cluster. Consequently, even slight differences in averages between clusters are likely to be meaningfully interpretable. The map shows that clusters along the bottom are judged more important in undermining anti-tobacco efforts.
Concept map showing clusters, cluster labels, relative importance ratings, and expert’s interpretations of dimensions and regions.
Expert panel interpretation
The expert panel interpreted the map and table in terms of several interesting patterns. The four clusters across the top were thought to describe the messages that the tobacco industry issues or tries to control—what the tobacco industry says. This includes attempts to undermine science and legitimate messages from scientific quarters (Undermining science), the manipulation of the media (Media manipulation), the industry’s public relations efforts (Public relations), and the tactics they use to gain control of the public agenda (Usurping the agenda). The four clusters across the bottom describe industry actions—what the tobacco industry does. This includes lobbying efforts (Lobbying and legislative strategy), the use of front groups and artificially created “grassroots” movements (Creating the illusion of support), intimidation (Legal and economic intimidation), and harassment of tobacco control professionals (Harassment).
The participants also interpreted a horizontal dimensionality. Toward the left on the map are clusters that represent tactics that are more hidden or covert in nature. On the right are tactics that tend to be more overt or public in nature. The dimensional interpretation is not meant to suggest that any cluster would be exclusively classifiable into one or the other extreme on a dimension. Undermining science is not exclusively Covert, while Lobbying and legislative strategy is not exclusively public. The relational nature of the map suggests that the clusters vary along the public-covert and message-action dimensions with varying levels of each end point present in each cluster.
Members of the expert panel then suggested that the two dimensions can be viewed as forming four quadrants based on the 2 × 2 combination of these dimensions and provided a short label for each quadrant: Public + Messages = Issue framing; Public + Action = Lobbying tactics; Covert + Messages = Science PR (public relations); and Covert + Action = Harassment.
Finally, the expert panel discussed these dimensionalities and agreed upon a final labelling for all areas of the map. These features are all depicted in fig 3.
DISCUSSION
The primary purpose of this project was the development of a conceptual framework that describes the tactics the tobacco industry uses to undermine tobacco control programmes. Such a framework may be used in a variety of ways. Here, we discuss the potential utility of the framework for evaluation measurement development, strategic planning, and to support efforts to classify and analyse tobacco industry documents.
Use in measurement development
Figure 3 could be used as the basis for the development of an index of tobacco tactics. To do so would require that each of the clusters be operationalised. The statements within each cluster suggest potential elements that might be measured as part of the index. For instance, one statement in the cluster Lobbying and legislative strategy was “Promoting smokers’ rights legislation”. This could be operationalised at the state level as the number of proposed bills or a measure of the amount of relevant legislative committee activity. Another statement was “Lobby to assure that funds are diverted to ineffective tobacco control activities”. Here, measures of tobacco control programme funding and evidence of lobbying activities might be utilised. In this manner, the statements in each cluster can act as prompts or suggestions for potential operationalisations.
In addition, the overall structure of the map suggests how such an index might be aggregated. For instance, sub-index scores for the clusters Public relations and Usurping the agenda can be aggregated into a total score that represents Issue framing. Moving one level up the hierarchy, the four sub-index scores that represent the quadrants can be aggregated into an overall index of Pro-tobacco tactics.
We know from the map results that the expert panel did not view all of the tactics as equally important. This importance rating information can be incorporated into the development of an index such that sub-index scores for each cluster are weighted by the average importance and the final index aggregation weighted by quadrant importance averages.
Use in tobacco control planning
The conceptual map can provide a high level strategic view of industry tactics that can help tobacco control planners better anticipate the tactics that the industry might use in certain circumstances. For instance, a potentially useful aspect of the map that surfaced in the interpretation can be seen as one moves from the right to the left side. The overt public industry tactics on the right of the map tend to be ongoing activities that the industry does routinely. Like virtually all other major industries, the tobacco industry has ongoing public relations and lobbying efforts as suggested in the clusters on the right.
But, how does the industry change its tactics in response to the perceived threat of increasing tobacco control efforts? The map and the expert panel suggested that they probably do so by moving from upper right toward lower left. Initially they most likely augment their public relations and lobbying efforts. If the tobacco control efforts become salient enough, the map suggests that the industry will be pressured increasingly to the more covert activities on the left side that include undermining science, legal and economic intimidation, and harassment.
The map thus provides a high level strategic model of the industry’s response to increased tobacco control efforts. This model can be used in tobacco control planning to better anticipate what the industry may do next.
Use in tobacco document analysis
The conceptual framework can be used for classifying industry documents specifically with respect to industry tactics and, as such, would augment and extend existing document classification and indexing procedures like the UCSF/ANRF Tobacco Documents Thesaurus. For example, each document could be classified for its relevance to the eight cluster areas. Once done, it would be immediately possible to retrieve all documents that provide evidence for a particular type of tactic (for example, cluster), or display all documents that reflect a broader cross-cutting (for example, a column category like “covert”) activity on the part of the industry.
For example, consider the cluster Creating illusion of support in the lower part of the map. The statements in that cluster (table 1) indicate several key sub-topics that are relevant and could help guide both the searching and classifying of documents.
For instance, for the statement “Creating the illusion of a pro-tobacco grassroots movement through direct mail database and paid-for petition names”, one document identified as relevant is a 1994 Philip Morris presentation that described their efforts to create the illusion of support: “We also are mobilising support among our consumers. Consumers who respond to our brand promotions receive an insert with their fulfillment packages . . .so far, more than 400,000 consumers have responded, and the programme has generated some 80,000 letters to Capital Hill, about 10,000 per month.”29 Similarly, for the statement “Using employees and their families to make campaign contributions that are difficult to track” one relevant document is a 1997 Brown and Williamson letter which states that “as a Brown & Williamson employee, you can play a major role in influencing elections, the future of our business and, of course, our respective jobs” by “making contributions to the B&W Employee Political Action Committee”. The letter discusses previous contribution levels for 1996 and options for method of contributing (payroll deductions or personal checks) and asks for a $200 contribution from each eligible participant.30 Or, for the statement “Flying in cadre of ‘experts’ to fight local/state legislation”, a 1993 Philip Morris document describes the objective “to support the defeat of unwarranted smoking restrictions and to discourage unfair discrimination against smokers”. Goals and tactics were: “promotion of ETS in the context of indoor air quality and use of experts to directly and indirectly influence legislation, rulemaking and standards in relation to ETS and workplace smoking issues.”31 These examples are meant to illustrate how the conceptual map can be used both as a suggestive device when searching the documents and as an expert derived hierarchical thematic taxonomy of pro-tobacco tactics that can be useful in coding and organising the documents subsequently identified.
Another document related application would be to develop a cross referencing between the map categories and other classification systems such as the UCSF/ANRF Tobacco Documents Thesaurus. For example, the Thesaurus includes the terms “lobbying”, “industry front group”, and “industry sponsored research” which could be linked with the map categories Lobbying and legislative strategy, Creating illusion of support, and Undermining science, respectively. This type of cross referencing would enable the tobacco documents to be accessed immediately through different conceptual schema that were devised for different purposes, without having to reclassify all documents from scratch.
In addition to its use in addressing the three issues described above, the conceptual framework can act as an organising device that encourages greater synergy between the three activities. For example, if in a local context, tobacco control planners determine that the industry is likely to increase its efforts in creating the illusion of support in the immediate future, the planners could examine that cluster on the map to help determine the specific tactics the industry might use, to think about how to measure or track the industry’s effort in this area, and to access the tobacco document evidence relevant to that cluster that describes the history of similar activities in other contexts.
Additional work could enhance the utility of this framework for document analysis. In this study, participants were asked to brainstorm industry tactics from their point of view and in their own language. This creates, in effect, a map that is decidedly anti-tobacco in its perspective. But the tobacco documents themselves are generated from an opposing perspective, using euphemisms and industry code terms designed to portray their pro-tobacco efforts in a good public light. Where anti-tobacco researchers might, for instance, talk about the industry “paying scientists to conduct research to create doubt about legitimate science” (statement 80), it is unlikely that industry documents would describe their activities in a similar manner. Document searches that rely directly on the language of the map are unlikely to be fruitful or get at the desired topics. This suggests that it would be useful to develop the type of cross referencing to the Thesaurus that was discussed above.
Finally, there were activities of the tobacco industry, such as manipulating product chemistry or price, that were not included in this map because the focus in this project was on specific activities/tactics the industry uses to undermine tobacco control programmes. The manipulation of chemistry or price were not perceived by participants as “tactics” for undermining tobacco control per se. Despite not being considered industry tactics for undermining tobacco control programmes, the importance of these issues is undeniable and they need to be addressed in comprehensive evaluations of tobacco control programmes.
What this paper adds
A major challenge in evaluating tobacco control efforts is the need to measure tobacco industry counter-efforts and their effects. Currently, no overarching conceptual model exists to guide operationalisation of measures of industry tactics that might be useful for evaluation. This study used a web based multivariate concept mapping methodology with a panel of tobacco control experts to develop a conceptual model of the tobacco industry interference with tobacco control programmes.
The resulting conceptual maps summarise the tactics used by the industry and their relationships to each other, and suggest a possible hierarchy for measures that can be used in statistical modelling of industry tactics and for review of industry documents. Finally, the maps enable hypothesis of a likely progression of industry reactions as public health programmes become more successful, and therefore more threatening to industry profits.
Regardless of the real world potential uses for the conceptual map, the structure is an intriguing one in its own right. It summarises a very complex area concisely and provides a compelling theoretical model that needs to be tested and extended empirically in follow up work. Replications of this study could be used to determine the reliability and generalisability of the model. In addition, the model is general enough at its highest level to be a potential framework that might be applied to understanding the tactics of other industries that attempt to undermine the legitimate work of public health programmes.
Acknowledgments
This article was supported by contract number N01-CP-95030 from the National Cancer Institute. Its contents are solely the responsibility of the authors and do not necessarily represent the official view of the National Cancer Institute.
REFERENCES
Footnotes
-
↵* The Concept System Global© web software was used for all web processes on this project. Further information on the software may be obtained from Concept Systems Inc, http://www.conceptsystems.com/
-
↵† Detailed and intermediate results, including the original list of 226 brainstormed statements, can be obtained at http://omni.cornell.edu/tactics/
-
‡ All analyses were accomplished and results produced using the Concept System software, version 1.75. Further information on the software may be obtained from Concept Systems Inc, http://www.conceptsystems.com/