Article Text

Abstract
Background The rapid global adoption of mobile health (mHealth) smartphone apps by healthcare providers presents challenges and opportunities in medicine. Challenges include ensuring the delivery of high-quality, up-to-date and optimised information. Opportunities include the ability to study global practice patterns, access to medical and surgical care and continuing medical education needs.
Methods We studied users of a free anaesthesia calculator app used worldwide. We combined traditional app analytics with in-app surveys to collect user demographics and feedback.
Results 31 173 subjects participated. Users were from 206 countries and represented a spectrum of healthcare provider roles. Low-income country users had greater rates of app use (p<0.001) and ascribed greater importance of the app to their practice (p<0.001). Physicians from low-income countries were more likely to adopt the app (p<0.001). The app was used primarily for paediatric patients. The app was used around the clock, peaking during times typical for first start cases.
Conclusions This mHealth app is a valuable decision support tool for global healthcare providers, particularly those in more resource-limited settings and with less training. App adoption and use may provide a mechanism for measuring longitudinal changes in access to surgical care and engaging providers in resource-limited settings. In-app surveys and app analytics provide a window into healthcare provider behaviour at a breadth and level of detail previously impossible to achieve. Given the potentially immense value of crowdsourced information, healthcare providers should be encouraged to participate in these types of studies.
- mHealth
- analytics
- global health
- anesthesiology
- practice patterns
This is an Open Access article distributed in accordance with the Creative Commons Attribution Non Commercial (CC BY-NC 4.0) license, which permits others to distribute, remix, adapt, build upon this work non-commercially, and license their derivative works on different terms, provided the original work is properly cited and the use is non-commercial. See: http://creativecommons.org/licenses/by-nc/4.0/
Statistics from Altmetric.com
Key questions
What is already known about this topic?
Mobile health applications (mHealth apps) constitute a vast and rapidly growing source of medical information and data collection for patients and healthcare providers.
Most of the work in this area have been focused on patient and end-user-facing apps as opposed to provider-facing apps.
Studies of these apps have been conducted on a limited scale and typically without accompanying demographic information about the user base.
What are the new findings?
This basic anaesthetic calculator has been adopted by a large number of providers around the world and across the spectrum of healthcare provider roles.
Primarily used in the care of paediatric patients, the app appears to have roles in both routine and emergency medical management.
Users from low-income countries used the app more frequently, rated the app as more important to their practice and used the app in a younger set of patients. These providers were more likely to be rural and practicing on their own. Physicians from low-income countries were more likely to download and use the app but represented a smaller proportion of the user base in low-income countries.
There is a relatively greater adoption rate and usage level for mHealth clinical decision support in low-income countries, suggesting both the need for this type of clinical decision support as well as comfort with the use of mobile technology to fill that need.
Recommendations for policy
Apps, even those without specific low-income and middle-income countries targeting, may be used to disseminate best-practice and continuing medical education to practitioners in resource-limited settings.
Apps are a valuable source of information about global practice patterns, crowd-sourced epidemiology and access to medical and surgical care.
Introduction
The rapid dissemination of mobile phones equipped with smartphone capabilities has put access to vast amounts of information and processing power at the fingertips of a broad swath of the global population. Smartphone sales surpassed ‘feature phone’ sales in 2013,1 and millions of ‘apps’ are now available in the app stores of leading mobile operating systems.2 For clarity, the term ‘app’ is an abbreviation of ‘application.’ The meaning of the term is evolving, but in this context, it refers to a relatively small programme with a specific or specialised purpose that can be downloaded onto a mobile device. Concurrently, mobile health applications (‘mHealth’ apps) have enjoyed significant growth due to high demand in the collection and dissemination of health-related information between patients, providers and researchers.3
The growth in mHealth has been accompanied by the opportunity to study population-level behaviour and dynamics via ‘app analytics’. ‘App analytics’ is a term broadly describing the capture, analysis and visualisation of metadata, such as details of app usage (eg, the screen being viewed) or more general information (eg, the location of the mobile device). These analytical capabilities have become very easy to integrate into apps, and analytics and data visualisation products are offered by leading companies such as Google, Amazon and Microsoft for all major mobile device operating systems.4–7
To date, there has been very little scholarly work related to healthcare app analytics. The studies that have been undertaken have often been limited by small sample sizes due to relatively small distribution or adoption of the studied apps. This in turn was a result of either the study design itself or a lack of organic growth of the user base. In addition, the existing studies in the literature have been primarily focused on mHealth apps used by patients. Such studies include behavioural interventions,8 9 ‘wearables’ for cardiology research10 and improvements in diabetes management.11–15 It has become important to understand the drivers of app download by patients and subsequent app usage, and app-based analytics have been used to validate interview-based findings in this area.16 17
The literature on analytics for mHealth apps designed for use by clinicians is even more limited. Several studies have examined app use in resident education.18 19 Another study by authors at Medecins Sans Frontieres (MSF; Doctors Without Borders) evaluated usage of an MSF clinical guidance app by 3500 users in 150 countries.20 Also, crowdsourcing of medical opinions has been investigated in a study of 72 providers.21 Most of these existing studies evaluated little more than the extent of use of the apps. This was generally due to a lack of demographic information about the user base. This lack of demographics made it difficult to answer more advanced questions such as relative use by physicians versus non-physicians or adoption of the app outside of the intended target community. There is significant interest in how these technologies may impact healthcare administration and governance in low-income and middle-income countries (LMIC).22
The current study attempts to overcome these limitations and begin to characterise in more detail the global mHealth adoption and usage patterns by physicians and other healthcare providers, particularly focusing on differences between LMIC and higher income countries. The focus of this study was on adoption and use of a free Android app designed for anaesthesia healthcare professionals providing age and weight based guidelines for airway equipment, physiological reference data and drug dosing. Data collection occurred via a custom analytics and survey administration module integrated into the app. The app was released in 2011, and it was installed on approximately 100 000 devices globally as of December 2015.
Methods
The app was written in the Java (Oracle, Redwood City, California, USA) programming language using the Eclipse (Ottawa, Canada) integrated development environment23 and the Android (Google, Mountain View, California, USA) software development kit.24 It was released publicly in the Google Play app store in 2011 under the name ‘Anesthesiologist’ to serve as a helpful adjunct for paediatric anaesthesiology providers. The data used by the app for dosage calculations were compiled from a number of sources, including standard textbooks of anaesthesiology,25–27 advanced cardiac life support28 and paediatric advanced life support29 protocols, Broselow tape information30 and drug package inserts available from the US Food and Drug Administration website.31 The app was refined on the basis of user feedback over the next several years. A screenshot of the app interface is provided in online supplementary file S1. In 2015, the Survalytics platform was designed, written and integrated into the app. This open-source module has been previously described.32 The Survalytics platform is designed to send survey questions to the app and to retrieve survey responses and other analytic metadata from the app. Survey data and app usage information are transmitted to and from the app utilising services provided ‘in the cloud’ by Amazon Web Services (Amazon, Seattle, Washington, USA).
Supplementary file 1
A detailed schema for the survey and analytic data collection was developed, including the collection of app usage, in-app activity, device location and language, and time of use (see online supplementary file S1 (‘Mobile Healthcare App Study JSON Document Schema’)). The survey questions administered are summarised in online supplementary file S1 . Users had the ability to opt in or opt out of the study at any time. Details about the data collection and analysis procedures are described in the online supplementary file S1 (‘Survalytics Detailed Description’). Raw data were downloaded and processed using R V.3.3 (R Core Team, Vienna, Austria).33–36
Statistical methods
The primary dependent variables examined in this study are: (1) provider rating of the importance of the app to their practice (5-point Likert scale); (2) the frequency of app use; and (3) app adoption penetration index per country. App use frequency was calculated using the methodology described in the online supplementary file S1 (‘Methodology for Calculation of App Use Frequency’). The app adoption penetration index by country was calculated by dividing the total number of app users by the physician workforce estimate and multiplying by 1000 (to obtain a whole-number index). Physician workforce estimates were obtained from WHO Global Health Observatory data37 and from estimates of surgical workforce published by Holmer et al.38 These data sources and their limitations are described in the online supplementary file S1 (‘Detailed Statistical Approach’). Negative binomial regression analysis was then performed to estimate the app adoption penetration index for each of the country income levels examined. Raw adoption rate was also calculated for each income level by dividing total app user count by total workforce estimate, in both cases including data only for those countries with available estimates.
The key independent variables examined in the study include healthcare provider type/role (eg, physician, trainee and medical student), provider country, country World Bank income level,39 length of time in practice, anaesthesia practice model (eg, physician administered), anaesthesia practice environment (eg, small clinic and university hospital) and practice size. Figure 1 provides an outline of the number of observations available in each category. Figure 1 also indicates the number of observations available after combining subsets. Tables presenting univariate regression models always include information about total sample size as well the sample size per category.
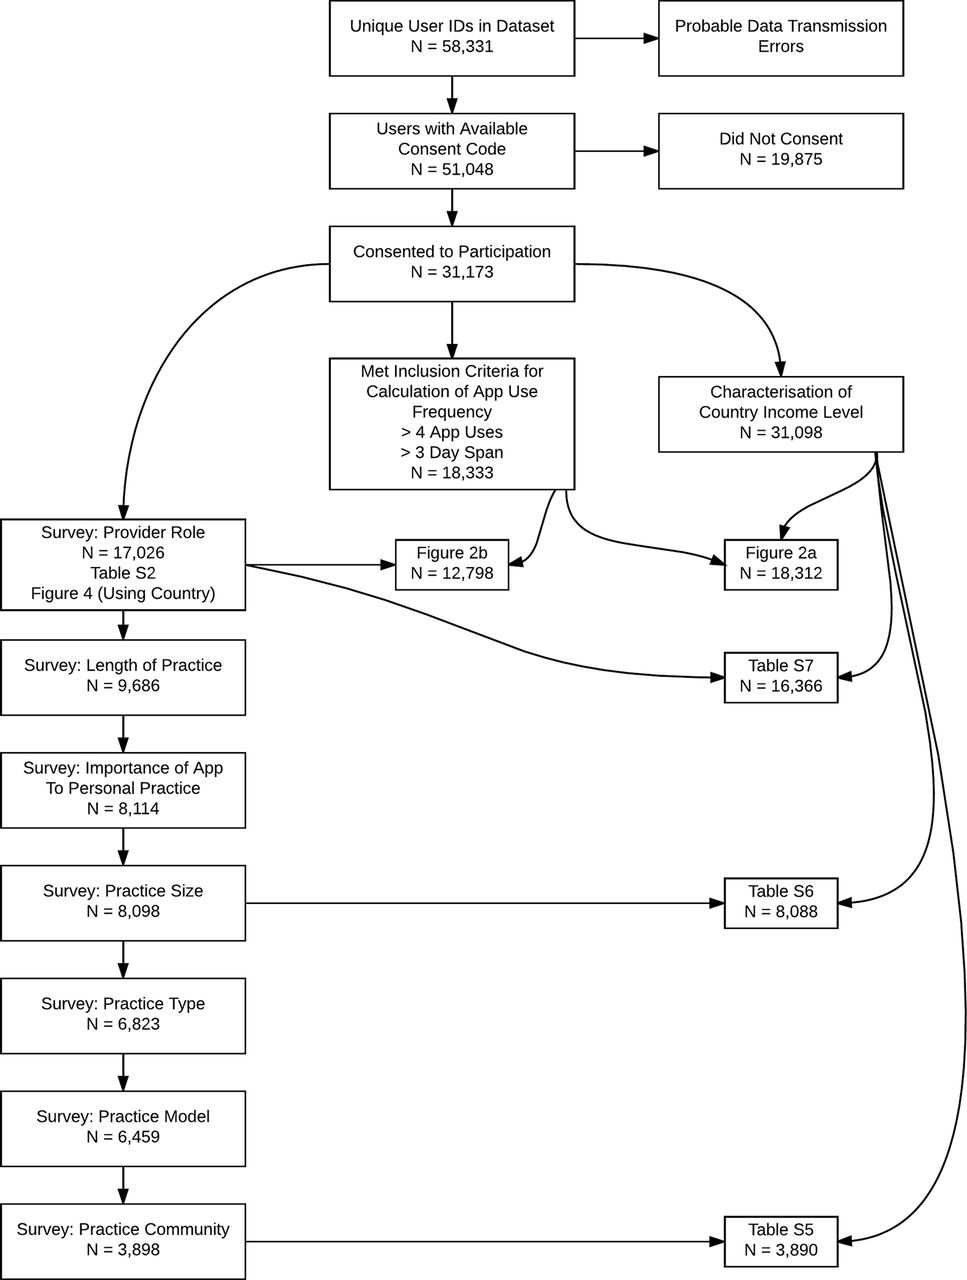
Overall roadmap of the approach to analysis of the data. This indicates the dependent and independent variables that were examined (see Methods) and the number of study participants in each of these subsets. Subsets were combined to create various tables and figures, and the number of study participants with data in the combined subsets are shown.
The key statistical methods used in the analysis of the app data included χ2 contingency table analysis, binomial logistic regression and negative binomial regression. A detailed description of the statistical approach can be found in the online supplementary file S1 (‘Detailed Statistical Approach’).
Results
Between December 2015 and October 2016, the app was updated to the study version by 51 048 users. Of these users, 31 173 (61%) agreed to participate in the study. Participating users were from 206 ‘countries’ (specifically, regions as defined by ISO-3166–1.) Of the 31 173 participating users, 17 026 (54.6%) went on to answer the first set of survey questions that related to provider type and included demographic questions as well as questions about the details of the users’ professional roles and practices. As shown in online supplementary file S1, the responding users included a broad spectrum of healthcare provider roles including primarily physicians, mid-level providers and trainees.
Users from low-income, lower middle income, upper middle income and high-income countries (HICs) represented 3%, 29%, 36% and 33% of users, respectively. Participating users from lower income countries used the app much more often (figure 2a)—the median usage rate for lower income countries was nearly twice that from HICs, and univariate negative binomial regression demonstrated that this difference was higher than all other income categories with very strong statistical significance (table 1, p<0.001). Users from lower income countries also had higher ratings for the importance of the app to their practice (table 2, p<0.001). Provider type was also significantly associated with the frequency of app use (figure 2b and table 1, p<0.001) and app importance (table 2, p<0.001), with roles that require less training generally correlating with higher rates of app use and higher scoring of app importance.
Univariate negative binomial regression testing the association of key independent variables with how frequently the user activated the app per 30 days. Frequency of app use was calculated using the methodology described in the supplementary appendix

Standard boxplots demonstrating frequency of app use as a function of key user characteristics (dots are outliers). N per category is shown. Negative binomial regression was used to assess the significance of the association between these factors. (A) User primary country World Bank income level and (B) provider role/provider type. NS, not significant.
Univariate binomial regression analysis testing the association of key independent variables with rating of app importance
As seen in table 1, greater app use was overall associated with country income level, provider type, app importance, practice model, practice size, length of time in practice and community served. As a robustness check of the persistence of the significance of these variables when the other covariates are included in the model, a multiple negative binomial regression of app use on all of these variables was performed. Each variable, in turn, was omitted from this negative binomial model, and a likelihood ratio test used to determine if the variable was significant. With the exception of practice model, all variables remained significant (analysis not shown.)
As seen in table 2, rating of app importance was overall associated with country income level, provider type, practice model, practice size and length of time in practice. Similar to the analysis described above, a multiple binomial regression of app importance on all of these variables was performed. Again, each variable was omitted from this model in turn, and a likelihood ratio test used to determine if the variable was significant. With the exception of practice size and length of time, all variables remained significant (analysis not shown.)
Figure 3 provides a choropleth map showing the app adoption penetration index for each country. The total number of physicians per country used to generate this choropleth came from the WHO Global Health Observatory.40 Negative binomial regression demonstrated that physicians in low-income countries were significantly more likely to adopt the app compared with physicians in countries of other income levels (online supplementary file S1, p<0.001, online supplementary file S1, p<0.001 and figure 3b). Practitioners in low-income countries were more likely to serve a rural community (online supplementary file S1, χ2 p<0.001) and practice in smaller groups or on their own (online supplementary file S1, χ2 p<0.001). Despite these elevated physician adoption rates, we observed that physicians are a smaller percentage of the app users in low-income countries, with mid-level anaesthesiologist assistants and certified registered nurse anaesthetists (CRNA) forming a significantly larger proportion of the app user pool (online supplementary file 1, p<0.001).

Penetration of app into the physician workforce by country. The app adoption penetration index was calculated as the estimated number of physician app users per 1000 physicians in the country. WHO Global Health Observatory data were used to obtain the estimated total number of physicians in the country. (A) Choropleth map; no data for countries in white. (B) Standard boxplot showing the app adoption penetration index grouped by World Bank country income level. Number of countries in each category is shown. Negative binomial regression was used to test the significance of the association between country income level and the app adoption penetration index (see online supplementary appendix).
Online supplementary file S1 shows app usage plotted against the hour of the day for users in the USA, HICs (USA excluded) and LMIC, respectively. These figures show that app use peaks from 07:00 to 09:00 depending on country income level. App use peaked between 06:00 and 07:00 in the USA, between 07:00 and 08:00 in all non-US HICs and between 08:00 and 09:00 in LMIC. The US data follow previously reported patterns of hourly surgical caseload, supporting the idea that the app is being used in both routine and urgent/emergent contexts.41 42 There was a consistent rate of usage until midnight, and a low level of usage overnight. Online supplementary file S1 shows usage rate by day of the week for all users. There were higher rates of use on weekdays. Consistent with nighttime and weekend app uses, 72% (5985 of 8282 total responses) reported having used the app in an emergency.
The app was used most often for paediatric patients (online supplementary file S1). More than 70% of app uses were for patients less than 12 years of age and about 33% for patients less than 1 year of age. There were differences in these proportions depending on country income level, with a higher proportion of app uses for patients less than age one and age three in low-income countries compared with HICs (p<0.001).
Discussion
This is the largest set of healthcare app analytics published to date. Furthermore, this is the first study to combine large-scale app analytics with app-delivered survey data to characterise details of the app user base and investigate how these characteristics influence app use. We find that this basic anaesthetic calculator has been adopted by a large number of providers around the world and across the spectrum of healthcare provider roles. Primarily used in the care of paediatric patients, the app appears to have roles in both routine and emergency medical management. Users from low-income countries used the app more frequently, rated the app as more important to their practice and used the app in a younger set of patients. These providers were more likely to be rural and practicing on their own. Physicians from low-income countries were more likely to download and use the app than their counterparts in HIC, but these physicians represented a smaller proportion of the user base in low-income countries. The latter finding may be due to a relative lack of access to physician-led anaesthetic care in low-income countries. However, it may also be due to a higher rate of app adoption by mid-level provides in low-income countries that is driven by some other unobserved factors. Without additional information about how the population of app users relates to the broader population of anaesthesia providers, we cannot state the degree to which such factors contributes to this observation. We note, however, that the relative lack of physician-led anaesthetic care in low-income countries is well documented.38 Together, our findings are consistent with a relatively greater adoption rate and usage level for mHealth clinical decision support in low-income countries, suggesting both the need for this type of clinical decision support as well as comfort with the use of mobile technology to fill that need.
Strengths and limitations
The large number of providers participating in the study lends strength to the findings. The decentralised manner of data collection reduces the risk of observer bias or effects in the data due to interactions between participants. Data collection was invisible to participants apart from the initial provision of consent and survey participation, increasing the likelihood that we were observing organic rates of app use, unaffected by the presence of the study.
Several limitations to the current study should be considered. First, we have not specifically tied app usage to change in patient outcomes. Based on the self-reported importance of the app and the patterns of usage, we assume that clinicians are finding that the app is providing decision support in ways that improve patient care. Specifically tying outcomes to app usage will require the collection of deanonymised data within a controlled healthcare ecosystem, in such a way that allows provider-level app usage to be tied to patient-level outcomes from the medical record. Such studies are planned for future work.
Results reported herein that rely on survey data are limited by the fact that they are self-reported. Due to the anonymous nature of the data collection (necessary for patient privacy) we cannot verify the demographic information provided. Issues relating to self-reporting are mitigated somewhat by the size of the study population but, even so, mischaracterisation bias should also be considered when evaluating our results. In particular, a systematic bias towards inflated credentials could inflate the apparent rate of physician adoption. Users falling outside of the given provider roles may not have consistently chosen a category; for example, it is not completely clear how providers who self-identify as ‘Anesthetic Medical Officers,’ ‘Clinical Anesthetic Officers’ or ‘Anesthetic Officers’ would have self-identified among the provided options. Given the relatively high proportion of ‘Anesthesia Technician’ respondents in LIC (online supplementary file S1), this is likely how they self-identified, a point that may be clarified in future work.
The study has a selection bias towards providers who have access to smartphones or tablets and are comfortable with their use. It also selects for users who are using Android devices, as the app is not currently available for iOS. However, mobile devices using the Android operating system represent 87.6% of the global market.43 It is unclear how selecting for a more tech-savvy provider population might influence our overall results, but it is likely that the provider mix using the more expensive iPhone technology would be different given the differential in rates of disposable income for different healthcare provider roles. An interesting future question is to ascertain whether there is a platform-dependent differential rate of download or provider mix in LMICs. To limit the number of survey questions and to alleviate any possible concern about study participation, we did not collect information about the age or gender of the participant. If there was a differential in the rate of smartphone adoption based on age or gender, then a systematic source of error may be present in the data.
Other sources of bias could relate to internet speed, cost of bandwidth or device memory. For example, it is possible that users in LMIC may not download apps simply for curiosity's sake as much as their counterparts in HIC. A subtle source of selection bias may be related to a higher concentration in the study sample of users who are practicing on their own or in small groups compared with the broader population of anaesthesiologists. If these users find the app to be more useful than their counterparts practicing in larger groups or as part of a hospital system, then there may be a systematic bias towards enrolment in the study of the users in this group.
Finally, this is an observational student and may suffer from bias due to self-selection of study participants. Systematic bias may be present due to differences in users who download but do not use the app versus those who use the app but choose not to participate in the study versus study participants. Due to this self-selection bias, it should be emphasised that the findings of app importance summarised in table 2 should not be interpreted as a reflection of absolute app importance among everyone who has downloaded the app, the large number of users who download the app but never use it or who choose not to participate in the study would likely have very different ratings of app importance. The main contribution of the findings in table 2 involve the differences in the ratings of app importance between the levels of the variables examined.
Finally, a weakness of the Survalytics platform was an inability to randomise the order of question presentation. Therefore, question order and the increasing non-response rates of questions occurring later in a survey may introduce bias into the responses.
Implications and future questions
Recent assessments of global access to surgical and anaesthetic care have noted a ‘grossly inequitably distributed’ workforce.44 45 Our results are consistent with and expand on these findings. In particular, our findings in online supplementary file S1 are consistent with the known relative lack of physician-led anaesthetic care in low-income countries. This provides evidence that this observational data set from a large pool of self-selected users reflects in some way the broader population of anaesthesia providers. Future studies should be focused on assessing the extent to which this is true. If this is indeed the case, this app then becomes valuable in two ways: first, as a research tool to track longitudinal changes in access to global surgical care and, second, as a vehicle for disseminating information about best practices in resource-limited settings. As an example of this type of information, a retrospective MSF study in resource-limited settings demonstrated that general anaesthesia with intubation carries mortality risk as compared with other anaesthetic techniques.46
The rapid dissemination of mobile phones equipped with smartphone capabilities, and the concomitant prolific development and adoption of provider-facing mHealth apps, has the potential to profoundly change in the way that healthcare is delivered around the world. For example, large-scale app analytics helped researchers understand how to optimise delivery of ‘just in time’ disaster relief information.47 The present work expands on previous app-related studies by enriching our understanding of how factors such as provider role and country income level relate to adoption and use of this type of resource. Prior work10 16–18 20 21 set the stage for this study by demonstrating the feasibility of using backend analytics to monitor usage patterns. It was natural to add another dimension to these studies by tying in an examination of the demographics of the user base. Doing so helps to guide app development design optimised for the providers actually using the tool. It also provides some insight into the value of information gleaned from the analytics; crowd-sourced epidemiology from a user base of physicians may turn out to have higher signal-to-noise than analytics gleaned from the general public. The ImmunizeCA study16 provided a tantalising glimpse into the power of large-scale analytics in patient-facing mHealth; by identifying themes about usage patterns among a small number of users, the authors were able to see patterns in the larger data set representing various aspects of app usage by a population of nearly 75 000 users. Large-scale app analytics in the healthcare arena may help policymakers address challenges posed to modern medicine by the thousands of apps described in the peer-reviewed biomedical literature as well as those ‘in the wild.’
One of these challenges is making sure that the apps deliver quality medical information. Regulatory bodies are unlikely to be equipped with the resources to properly review thousands of apps across far-flung medical specialties. Apps downloaded by hundreds of thousands of users have the potential to affect the care of millions of patients. Even for apps falling into ‘enforcement discretion’, there is a reasonable argument that app makers should be required to collect and publish analytics related to their usage and user base. The medical and scientific community can contribute by reviewing these apps and by validating other review mechanisms such as crowd-sourced peer review. This study demonstrates the feasibility of using cloud-based survey and analytic tools for both publishers and reviewers to obtain such data.
A second challenge relates to optimising the delivery of information to physicians, midlevel healthcare providers and trainees. Such optimisation requires understanding how apps are being used and how they are impacting the delivery of healthcare to patients. Both objectives can be achieved using tools like Survalytics to obtain direct and indirect information about app use. As suggested above, future studies might involve tying provider-level app usage data to patient-level outcomes from the electronic medical record to ascertain more closely the effect of app usage on outcomes.
The medical community has only just started to take advantage of the powerful research opportunities presented by access to large communities of users through app analytics. This study demonstrates the feasibility of using surveys and analytics integrated into mHealth apps to understand healthcare provider behaviour at both a breadth and a level of detail previously impossible to achieve. Apart from the primary findings in the data, this study demonstrates the value of combining analytics and survey data to form a detailed picture of app use, which may provide data to meet some of the challenges outlined above.
Acknowledgments
Vikas O'Reilly-Shah is supported by the Emory University Department of Anesthesiology for this work. George Easton is supported by research support from the Goizueta Business School, Emory University. Scott Gillespie is supported by the Atlanta Pediatrics Research Alliance, including Emory University, Children's Healthcare of Atlanta and the Georgia Institute of Technology. The manuscript benefited substantially from critical reads by several people; we would like to thank, in particular, John Brock-Utne, Grant Lynde, Paul Garcia, W. Tim Garvey, Daniel Green, Craig Jabaley, Gari Clifford, and Becky Kinkead for their time and comments. We would also like to thank the Children's Healthcare of Atlanta and Emory University Pediatric Biostatistics Core and the Children's Healthcare of Atlanta and Emory University Grant Editing & Manuscript Support Core.
References
Footnotes
Contributors VO-S designed data collection tools, monitored data collection for the whole trial, wrote the statistical analysis plan, cleaned and analysed the data and drafted and revised the paper. He is guarantor. GE analysed the data, contributed to the statistical analysis plan and revised the paper. SG contributed to the statistical analysis plan, analysed the data and revised the paper.
Competing interests All authors declare: no support from any organisation for the submitted work; no financial relationships with any organisations that might have an interest in the submitted work in the previous 3 years; no other relationships or activities that could appear to have influenced the submitted work. The app was initially released in 2011 by VO-S with advertising in the free version and a paid companion app to remove the ads. The app intellectual property was transferred to Emory University in 2015, and advertisements were subsequently removed, and the companion app to remove ads made freely available for legacy users not updating to the ad-free version. Following review by the Emory University Research Conflict of Interest Committee, VO-S has been released from any conflict of interest management plan or oversight.
Ethics approval The study was reviewed and approved as a minimal risk study by the Emory University Institutional Review Board (IRB# 00082571). This review included a finding by the FDA that the app falls into the category of 'enforcement discretion' as a medical device, meaning that at present the FDA does not intend to enforce requirements under the FD&C Act.
Provenance and peer review Not commissioned; externally peer reviewed.
Data sharing statement The full dataset, technical appendix and statistical code are available from the corresponding author upon reasonable request. Signed written consent was not obtained from participants, but participants were made aware of the study, were provided with IRB-approved informed consent information and provided the opportunity to opt out of the study at any time. Documentation of electronic consent was recorded. The presented data are anonymised, and both the risk of identification and the risks from identification are low.