Article Text

Abstract
Background In 2012, the WHO issued a policy recommendation for the use of seasonal malaria chemoprevention (SMC) to children 3–59 months in areas of highly seasonal malaria transmission. Clinical trials have found SMC to prevent around 75% of clinical malaria. Impact under routine programmatic conditions has been assessed during research studies but there is a need to identify sustainable methods to monitor impact using routinely collected data.
Methods Data from Demographic Health Surveys were merged with rainfall, geographical and programme data in Burkina Faso (2010, 2014, 2017) and Nigeria (2010, 2015, 2018) to assess impact of SMC. We conducted mixed-effects logistic regression to predict presence of malaria infection in children aged 6–59 months (rapid diagnostic test (RDT) and microscopy, separately).
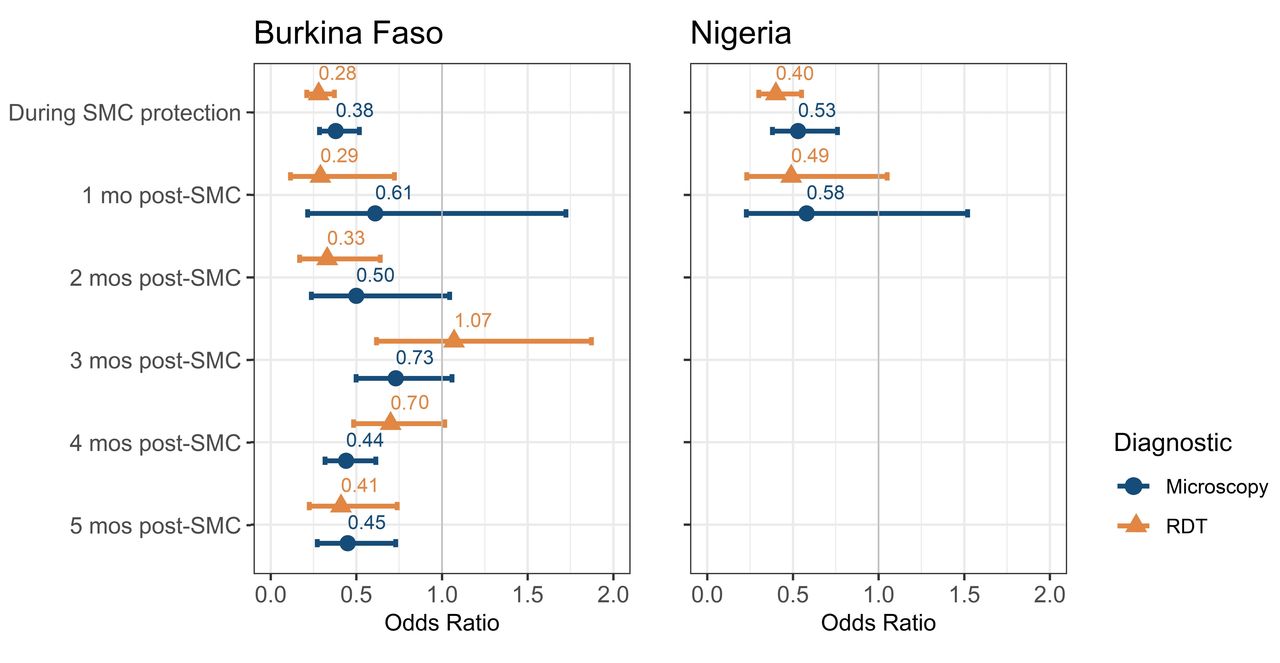
Results We found strong evidence that SMC administration decreases odds of malaria measured by RDT during SMC programmes, after controlling for seasonal factors, age, sex, net use and other variables (Burkina Faso OR 0.28, 95% CI 0.21 to 0.37, p<0.001; Nigeria OR 0.40, 95% CI 0.30 to 0.55, p<0.001). The odds of malaria were lower up to 2 months post-SMC in Burkina Faso (1-month post-SMC: OR 0.29, 95% CI 0.12 to 0.72, p=0.01; 2 months post-SMC: OR: 0.33, 95% CI 0.17 to 0.64, p<0.001). The odds of malaria were lower up to 1 month post-SMC in Nigeria but was not statistically significant (1-month post-SMC 0.49, 95% CI 0.23 to 1.05, p=0.07). A similar but weaker effect was seen for microscopy (Burkina Faso OR 0.38, 95% CI 0.29 to 0.52, p<0.001; Nigeria OR 0.53, 95% CI 0.38 to 0.76, p<0.001).
Conclusions Impact of SMC can be detected in reduced prevalence of malaria from data collected through household surveys if conducted during SMC administration or within 2 months afterwards. Such evidence could contribute to broader evaluation of impact of SMC programmes.
- Malaria
- Child health
- Epidemiology
- Public Health
Data availability statement
Data are available in a public, open access repository. Data may be obtained from a third party and are not publicly available. The DHS/MIS datasets analysed during the current study are available in the DHS repository, https://dhsprogram.com/Methodology/survey-search.cfm?pgtype=main&SrvyTp=country.The rainfall datasets analysed during the current study are available in the CHIRPS repository, https://www.chc.ucsb.edu/data/chirps. The geographical datasets for Nigeria analysed during the current study are available in the GADM repository, https://gadm.org/. The Burkina Faso HMIS datasets analysed during the current study are not publicly available but are usually available from the Ministry of Health on reasonable request.
This is an open access article distributed in accordance with the Creative Commons Attribution Non Commercial (CC BY-NC 4.0) license, which permits others to distribute, remix, adapt, build upon this work non-commercially, and license their derivative works on different terms, provided the original work is properly cited, appropriate credit is given, any changes made indicated, and the use is non-commercial. See: http://creativecommons.org/licenses/by-nc/4.0/.
Statistics from Altmetric.com
WHAT IS ALREADY KNOWN ON THIS TOPIC
Seasonal malaria chemoprevention (SMC) is a safe and effective intervention for preventing clinical malaria cases in children 6–59 months of age with a protective efficacy of 74% (95% CI 62% to 83%, p<0.001).
The impact under routine programme conditions has been assessed through research studies, however, sustainable methods of measurement still need to be identified.
WHAT THIS STUDY ADDS
Data from Demographic Health Surveys (DHS)/Malaria Indicator Surveys (MIS) are of high quality but have been previously overlooked in the context of measuring impact of SMC.
There is a decrease in odds of rapid diagnostic test-positive malaria infection in children living in areas during SMC administration in Burkina Faso (OR 0.28, 95% CI 0.21 to 0.37, p<0.001) and Nigeria (OR 0.40, 95% CI 0.30 to 0.55, p<0.001). This protective effect remains for up to 2 months post-SMC administration in Burkina Faso.
Impact was also seen in microscopy-confirmed infection for both countries but the effect was smaller.
HOW THIS STUDY MIGHT AFFECT RESEARCH, PRACTICE AND/OR POLICY
Data from DHS/MIS can be used with programme data from the same time period to measure impact of SMC in prevalence of malaria.
Ongoing SMC impact should be taken into account when estimating country malaria burden estimates from household surveys of malaria prevalence in children under 5.
Background
In 2012, the WHO issued a policy recommendation for the use of seasonal malaria chemoprevention (SMC), previously known as intermittent preventive treatment in children (IPTc), in areas of highly seasonal malaria transmission across the Sahel sub-region of Africa.1 2 Areas most suited for this intervention are characterised as having on average more than 60% of clinical cases occurring within a consecutive 4-month period, more than 60% of annual rainfall within 3 months, and >0.1 malaria attacks per child per transmission season.3 4
The intervention involves the administration of full courses of antimalarial sulfadoxine-pyrimethamine and amodiaquine (SPAQ) to children 3–59 months, to prevent malaria by maintaining therapeutic drug concentrations in the blood. Typically, each course is administered at monthly intervals at the beginning of the high transmission season by community distributors who administer one dose of SPAQ in person. Two further doses of AQ are administered by the caregiver; one dose on the second day and one dose on the third day since the administration of the first dose.5 Each full course of SPAQ provides protection for approximately 1 month.6 The full course and protective period are referred to as a ‘cycle’ of SMC.
SMC has been proven to be safe and effective.7 8 A meta-analysis of six randomised controlled trials in children under 5 in west Africa found a protective efficacy against clinical malaria of 74% (95% CI 62% to 83%, p<0.001).8 It is important to monitor and evaluate impact of malaria control interventions outside of trial settings to identify issues in implementation such as adherence, coverage or drug resistance.7 9 Impact evaluations of malaria control programmes measure the effect on population-level malaria indicators in relation to programme targets using a counterfactual.9 Data from national routine health management information systems (HMIS) provide longitudinal data, allowing evaluation of key outcomes such as malaria incidence, over time with counterfactual scenarios.9–11
It can be challenging to identify impact in routine data due to issues in data quality, measurement error and bias. For example, over the years 2013–2018 in Burkina Faso, average monthly malaria cases per health facility in children under 5 years have generally increased (figure 1) despite the fact that SMC was introduced from 2014. A simple examination of the data could suggest a lack of SMC impact. However, during this period, there were changes in access to health services such as removal of user fees for children under 5, improvement in case detection and diagnostics, changes in denominator or conversely stock-outs of diagnostics and treatments or health facility closures. Overall, there are concerns in using HMIS data, which makes it difficult to estimate the true impact of the programme unless confounders are accurately accounted for (for example, as done in analyses by Baba et al12 or Namuganga et al13).9 14 15
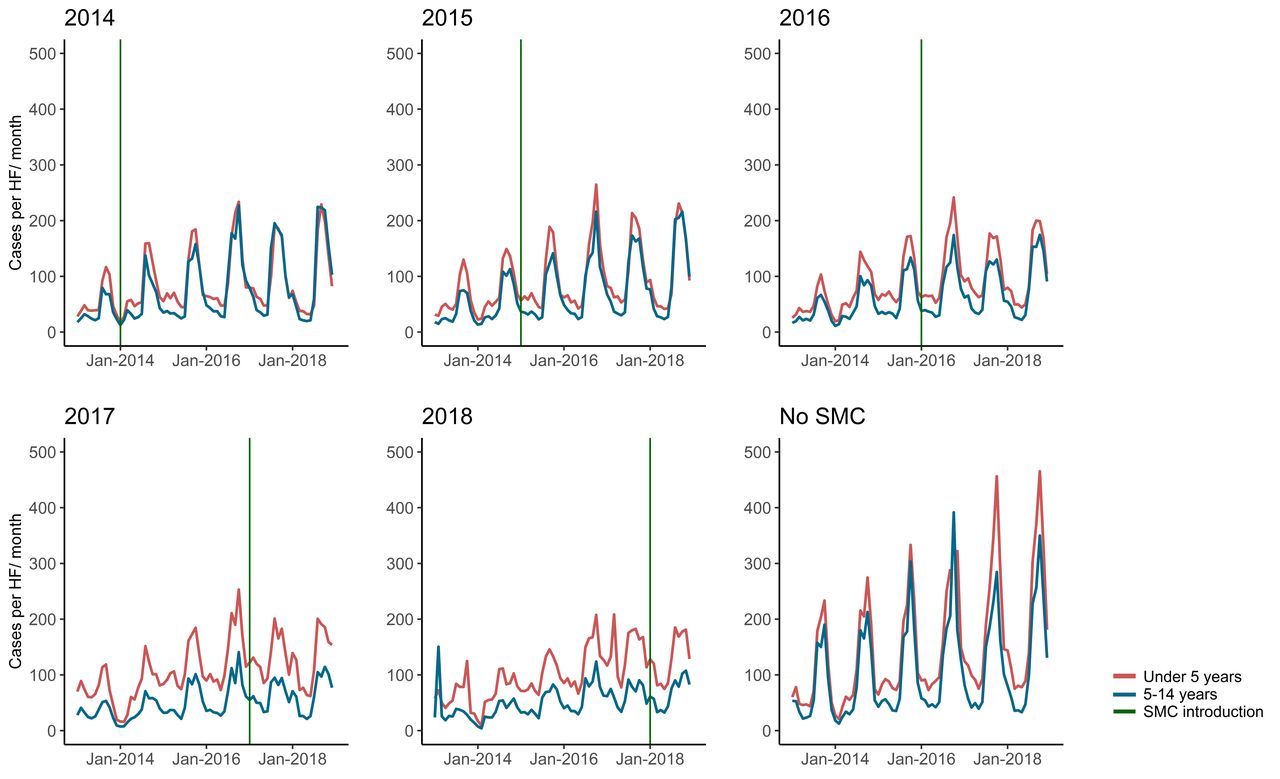
Monthly average RDT-confirmed malaria cases per facility by year of introduction, Burkina Faso (2013–2018). Data are shown for children under 5 years old and in those over 5 years old (National HMIS data, Ministry of Health Burkina Faso). Districts that introduced SMC after the study period in 2019 are noted as ‘No SMC’. Health facilities that reported data in at least 8/12 months of the year and 3 out of the 4 SMC administration months are shown. HMIS, health management information systems; RDT, rapid diagnostic test; SMC, seasonal malaria chemoprevention.
The most extensive impact evaluation to date, the Achieving Catalytic Expansion of SMC in the Sahel (ACCESS-SMC) programme, analysed HMIS case data in children under 5 from 2015 to 2016 using a difference-in-differences approach, with children over 5 as the comparison group to control for confounders.12 Average reductions of confirmed outpatient malaria cases in 2015 and 2016 were 41% and 48% in Burkina Faso; and 26% and 25% in Nigeria, respectively.12 These results are lower than expected given the high coverage and efficacy estimates from the case-control studies (efficacy 28 days post-SMC: 92% in Burkina Faso and 83% in Nigeria).12
Druetz et al also conducted a quasi-experimental study of children aged 3–71 months using a pre–post non-randomised control group design in Kaya district in Burkina Faso over 2014–2015.16 A reduction in malaria parasitaemia of 62% (95% CI 48% to 71%) was measured up to 4 weeks after the end of the first SMC cycle.16 Diawara et al conducted a non-randomised pragmatic trial in Mali with a pre–post study design in 2014. They measured malaria parasitaemia by blood smear before and 1 month post-SMC and found a reduction of 65% (95% CI 34% to 81%) with a difference in differences analysis.17 An analysis of the 2015 Mali Malaria Indicator Survey (MIS) found that rapid diagnostic test (RDT) prevalence in children who reported taking SMC dropped by 44% during SMC administration and up to 3 months after.18 Other MIS surveys have not routinely included SMC indicators.
Triangulating results from various impact evaluations using different data sources can address gaps or biases as well as strengthen evidence of programme impact. One approach that has been overlooked in the context of SMC is to combine implementation data with household surveys, which provide population representative data not subject to the same issues as routine data.9 14 15 Survey data are standardised, use the same diagnostic methods and the same definitions of indicators over time allowing for comparison over multiple years. However, surveys are conducted at long and sometimes varying intervals that are not specific to the timeliness of programmes (eg, the time period of the survey may not match the period in which the intervention took place); this is important because SMC impact will vary depending on when data are collected in relation to the transmission season and the administration schedule.
Here, we analyse MIS data from Burkina Faso and Nigeria to determine if SMC impact is detectable in Demographic Health Surveys (DHS)/MIS data after allowing for survey timing and other potential confounders. We chose these countries because the availability of programme data and the surveys were conducted before, during and after SMC. To our knowledge, no previous analysis on malaria prevalence using routine household surveys in Burkina Faso and Nigeria has been conducted.
Methods
Data
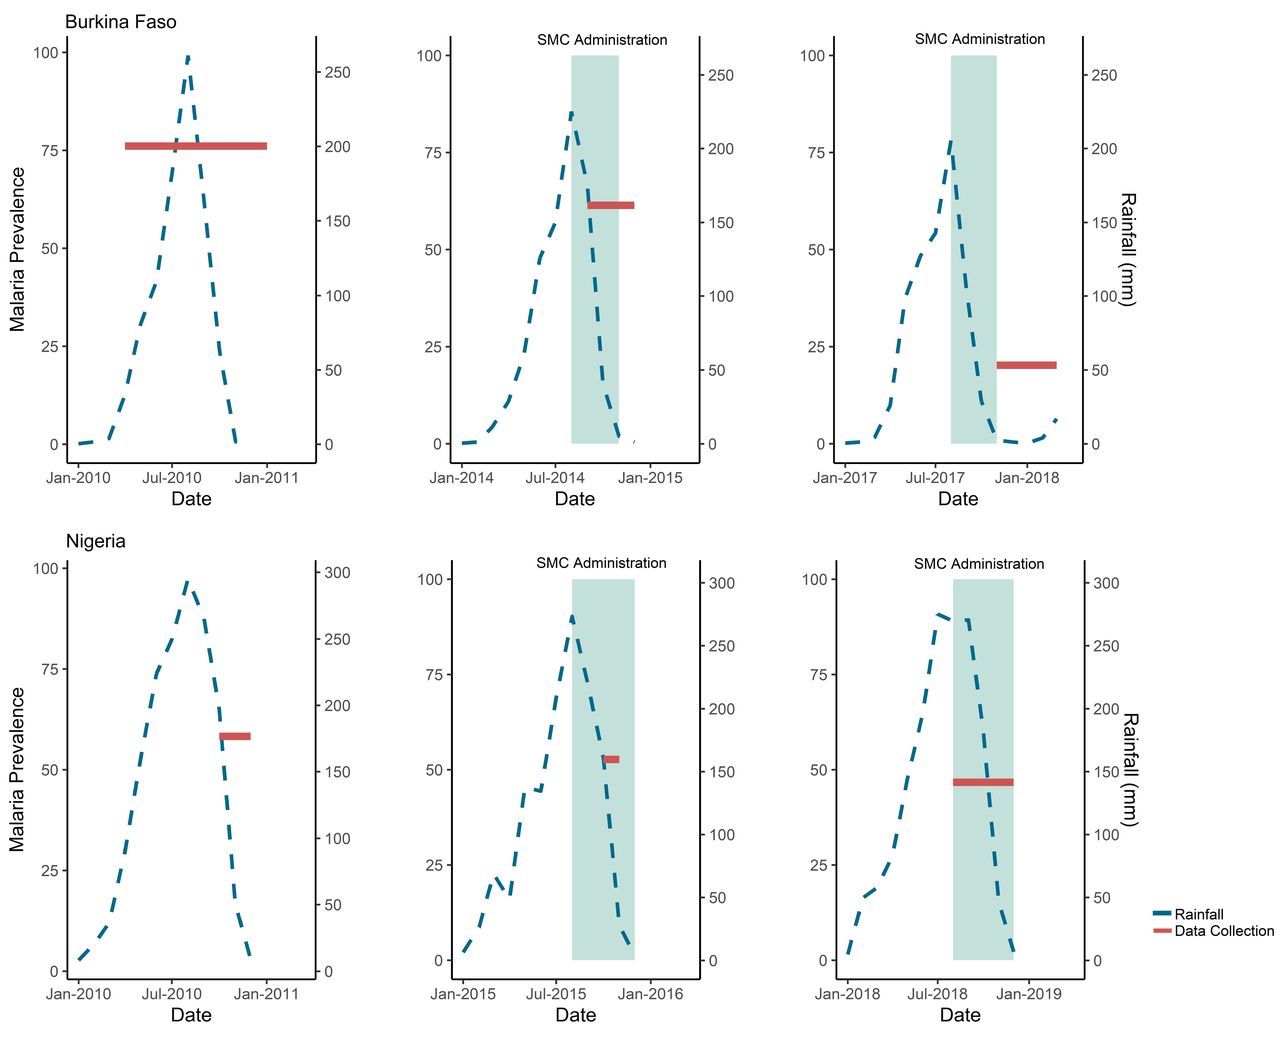
We used data collected through nationally representative household surveys by the DHS programme in Burkina Faso in 2010, 2014, 2017 and Nigeria in 2010, 2015, 2018 (figure 2).19 During these surveys, blood samples were taken from children 6–59 months after obtaining informed consent from caregivers, and tested for malaria by RDT and microscopy, which serve as separate endpoints for this analysis.20 Standard Diagnostic (SD) Bioline Pan/Plasmodium falciparum (Pf) RDT was used in all the surveys except the 2010 MIS in Nigeria. SD Bioline RDT detects the histidine-rich protein 2 (HRP-2) antigen and Plasmodium lactate dehydrogenase for the five species of Plasmodium.20–25 The 2010 MIS in Nigeria used the Paracheck Pf RDT, which tests for Pf.23 The different RDTs in Nigeria would have minimal effect on the results for the RDT analysis as they have similar sensitivities.26

Timing of rainfall, SMC administration and MIS data collection by month and year, Burkina Faso and Nigeria. Data shown are for prevalence of malaria measured by DHS/MIS and average monthly millimetres (mm) of rainfall by month and year of survey in Burkina Faso and Nigeria. Prevalence of malaria diagnosed by RDT by survey is shown by the red line spanning the months of data collection. Average monthly mm of rainfall is shown by the blue line. The timing of SMC administration is shown in comparison to the rainfall and survey data collection in teal. In Burkina Faso in 2014, there were seven health districts with SMC administration surveyed and in 2017 there were 56. In Nigeria in 2015, there were 6 LGAs with SMC administration surveyed and in 2018 there were 46. DHS, Demographic Health Survey; LGAs, local government areas; MIS, Malaria Indicator Surveys; RDT, rapid diagnostic test; SMC, seasonal malaria chemoprevention.
DHS/MIS used a randomised two-stage stratified sampling approach representative at the province level in Burkina Faso and state level in Nigeria.22 25 The sampling methodology, response rate, number of sampling strata and households are described in survey reports.20–25 Briefly, the primary sampling units are the enumeration areas defined by country census, selected using probability proportional to population size based on number of households and stratified into urban and rural areas.
To locate clusters within health district/local government area (LGA), global positioning system (GPS) coordinates were merged with spatial data from the Burkina Faso Mapping Institute (Burkina Faso) and GADM (Global Administrative Areas) (Nigeria) using Quantum Geographic Information System V.3.4.1.27 28 DHS/MIS adds error to the GPS locations of clusters for anonymity: typically, 2–5 km, but sometimes reaching up to 10 km (approximately 1% of clusters). This error is added such that clusters remain within the regional/state boundaries but may cross boundaries for lower administrative levels. Therefore, it is possible that some clusters may be allocated to neighbouring health districts/LGAs.
Programme data on introduction of SMC by district and year were merged with survey data since SMC indicators were not included in DHS/MIS surveys. In Burkina Faso, the entire country is eligible for SMC so all health districts surveyed were included. These data were obtained from the ministry of health. SMC was introduced in a phased approach starting with seven districts in 2014 and reached 59 districts in 2017. By 2019, the programme reached 100% geographical coverage across the 70 districts.
In Nigeria, only 9 of the 36 states plus the Federal Capital Territory were originally eligible for SMC.29 Only these states are included in this analysis, although, following a stratification exercise a total of 21 states are now eligible.30 This data was obtained from a review of grey literature.31–34 SMC was also introduced in Nigeria in a phased manner starting in 2013 with two LGAs in Katsina state.31 By 2018 the programme had scaled up to include 63 LGAs across 6 states (Borno, Katsina, Jigawa, Sokoto, Yobe, Zamfara).32–34
Rainfall data were obtained from the Climate Hazards Group InfraRed Precipitation with Station database at the coordinates of the survey cluster.35
Statistical analysis
Individual child data were analysed using logistic regression to predict presence of malaria infection (RDT or microscopy, separately). Random intercepts were fitted by health district or LGA. To adjust for seasonal variation in transmission, rainfall was included in the analysis by considering the total metres (m) of rainfall 4 months prior to the survey discarding the 1 month preceding due to the lag between rainfall and clinical malaria cases caused by vector population dynamics and the latent stage of the parasite. Sensitivity analyses were conducted using rainfall data for 1, 3 and 5 months prior to the survey. No change in the ORs were observed. In Burkina Faso, a generalised additive model was used, and a cyclic cubic spline term was fitted on month to further adjust for seasonal factors beyond rainfall using the mgcv package in R (V.3.5).36 For Nigeria, the surveys only spanned from August–December, so month was included as a categorical variable.
First, a bivariate analysis (including random intercepts for health district/LGA) was conducted to assess for crude associations between each variable and presence of infection. All covariates of interest were identified a priori and included in the model: SMC administration (no SMC, during SMC protection, 1, 2, 3, 4, 5 months post-SMC protection), year, age, sex, use of a net the night before data collection, wealth quintile, urbanicity, rainfall and treatment seeking behaviour (child who has had an antimalarial treatment for fever from a health facility in the previous 2 weeks). For the SMC variable, ‘no SMC’ refers to children living in areas that did not have SMC administration during the study period, or in areas before SMC was introduced. The SMC protective period was assumed to start the day of the first course to 28 days postadministration of the last course. Each subsequent month was defined as 30 days intervals since the last day of the protective period.
Treatment rate for case management was included in the model as it is a possible confounder if it differs between SMC and non-SMC areas. Since treatment is also a marker for recent infection, that is, the dependent variable, there could also be an argument for not including it. A sensitivity analysis running the model with and without the variable found no change in the OR for SMC impact.
The analysis was not adjusted for indoor residual spraying because data were not collected in every survey. During the survey period in Burkina Faso, there was a campaign in May 2010 in Diebogo. A sensitivity analyses excluding this district found no change in the OR. In Nigeria, there were spray campaigns in Doma and Nassarawa-Eggon from 2011 to 2013.37 There were no children sampled from Doma, and Nassarawa-Eggon did not introduce SMC until after the study period.
Sensitivity analyses were conducted to check the robustness of our results to the assumptions of the logistic regression model of normally distributed random effects for LGAs/districts. We reran the models using generalised estimating equation methods to allow for within-district/LGA correlation for both Burkina Faso and Nigeria. Additional sensitivity analyses were conducted for Nigeria using only states with SMC administration during the study period and only LGAs that had been surveyed in at least 2015 and 2018. There was no change to the ORs for SMC impact using any of these methods.
Results for unadjusted and adjusted models are presented for all variables included. Effect estimates for other variables should not be interpreted as fully adjusted as they would need their own adjusted models with consideration of causal pathways.38
Results
Burkina Faso
Data from 18 016 children aged 6–59 months were included in the analysis over the years of 2010, 2014 and 2017–2018 in Burkina Faso (n=6377, 6081 and 5558, respectively) (table 1). The three surveys took place over differing lengths of time and in different seasons: April 2010–January 2011, September–December 2014 (rainy season) and November 2017–March 2018 (figure 2).
Stratum-specific characteristics and ORs of RDT-diagnosed malaria in children 6–59 months, Burkina Faso
GPS locations for 59 out of 1070 clusters were not recorded and excluded as rainfall and time of SMC introduction could not be determined. The proportion of children with malaria diagnosed by RDT decreased sharply over the study years, from 72% in 2010 to 21% in 2017 (table 1, online supplemental file 1), although the later survey was conducted during the dry season. This contrasts with the increase in cases over time showed by the HMIS data (figure 1).
Supplemental material
Among the children who lived in a health district with SMC administration during the study period, 42% tested positive for malaria, compared with 67% of children who lived in a district without SMC. The sampled population was mostly rural (82%). Use of bed nets and antimalarial treatment varied over time (online supplemental file 2). The unadjusted odds of having malaria if living in a district with SMC administration, allowing for random district effects, was significantly lower than those living in a district without SMC administration during the protective period (OR 0.22, 95% CI 0.18 to 0.28, p<0.001).
There were no notable differences between districts that introduced SMC at different times prior to 2019 in terms of malaria prevalence, bed net use, or treatment seeking. The districts that introduced SMC in 2019 had a lower baseline prevalence (44% vs 71%–80%). Including random intercepts for district, the 2010 baseline data, and the SMC variable in the regression model adjusts for these differences.
After adjustment for year, sex, age, net use, wealth, urbanicity, treatment seeking behaviour, rainfall and seasonality there remained a significant association between living in a district with current SMC administration and RDT-diagnosed malaria (OR 0.28, 95% CI 0.21 to 0.37, p<0.001) (table 1). There is also strong evidence that the odds of malaria are lower up to 2 months post-SMC (1 month post-SMC: OR 0.29, 95% CI 0.12 to 0.72, p=0.01; 2 months post-SMC: OR: 0.33, 95% CI 0.17 to 0.64, p<0.001) (table 1, figure 3). The greatest change in the SMC OR on multivariable adjustment came from including the year and month variables in the model, most likely due to decreasing transmission over time, the different timings of the surveys and seasonality. After 2 months post-SMC, the impact of the intervention becomes less clear, with the trend showing no impact and subsequently moderate impact. This could be due to sampling variation or variable availability of data from different districts at different months post-SMC.

Odds of malaria determined by RDT and microscopy in Burkina Faso and Nigeria. A forest plot showing the OR and CIs of an adjusted random effects generalised linear model for associations between SMC administration and malaria infection as diagnosed by RDT or microscopy by country, adjusted for year, age, sex, use of a net the night before data collection, wealth quintile, urbanicity, rain, month and treatment seeking behaviour with random intercepts for district/LGA. LGA, local government area; RDT, rapid diagnostic test; SMC, seasonal malaria chemoprevention.
Similar results were seen with microscopy confirmed malaria compared with RDT-confirmed malaria, however, the effect was weaker (adjusted OR 0.38, 95% CI 0.29 to 0.52, p<0.001) (online supplemental file 3, figure 3). The impact of SMC on microscopy confirmed malaria was not sustained at a statistically significant level post-SMC, although there was a non-significant lower prevalence in SMC areas.
Nigeria
Data from 6661 children 6–59 months in Nigeria in 2010, 2015 and 2018 were included in the analysis (n=1551, 1812 and 3298, respectively; table 2). Unlike Burkina Faso, the surveys took place over similar time frames and seasons: October–December 2010, October–November 2015 and August–December 2018 (figure 2).
Stratum-specific characteristics and ORs of RDT-diagnosed malaria in children, Nigeria
GPS locations for 13 out of 1954 clusters were missing and excluded from the analysis. The proportion of children with malaria diagnosed by RDT decreased from 58% in 2010 to 47% in 2018 (table 2, online supplemental file 4). The sample was mostly rural (78%), and the majority of the children belonged to the lowest two wealth quintiles (61%–68%). Crude prevalence of infection initially appeared similar among children in an LGA with SMC administration during the time of a survey (49%), compared with those in an LGA without (51%). After inclusion of LGA-level random effects, SMC administration was significantly associated with lower prevalence of infection (OR 0.45, 95% CI 0.35 to 0.57, p<0.001) (table 2). This is becauseLGAs with earlier SMC introduction had higher infection prevalence prior to SMC.
After adjustment for year, sex, age, net use, wealth, urbanicity, treatment seeking behaviour, rainfall and month, children living in an LGA with SMC administration had significantly lower odds of a positive RDT compared with those living in an LGAwithout SMC (OR 0.40, 95% CI 0.30 to 0.55, p<0.001) (table 2, figure 3). Data were only collected up to 1-month post-SMC administration, however, impact of SMC on odds of malaria was not significant at this time (OR 0.49, 95% CI 0.23 to 1.05, p=0.07) (table 2, figure 3). Odds of microscopy-confirmed malaria infection were also lower in LGAs with SMC administration (OR 0.40, 95% CI 0.30 to 0.55, p<0.001) (online supplemental file 6, figure 3). This effect was not seen 1-month post-administration.
Discussion
As support continues for malaria elimination and additional means for malaria control are introduced, such as the malaria vaccine RTS,S/AS01E, alternative methods for measuring impact of interventions under programmatic conditions must be explored outside of trial settings.39 Conducting controlled and observational research studies to investigate effectiveness at scale over the long term is not sustainable. Multiple impact evaluations that address gaps or biases in data and triangulating between data sources strengthens the plausibility of programme impact.
Our analysis shows that data from routine surveys contributes to assessing impact of SMC even where only district level information is available. Children living in districts/LGAs of Burkina Faso and Nigeria with SMC administration had almost two-thirds lower odds of RDT-diagnosed malaria infection than those in areas without SMC after controlling for rainfall, treatment, net use and other variables. This impact was not obvious from average monthly malaria case numbers by health facility, which increased over the time that SMC was introduced in Burkina Faso. SMC impact is also not straightforward to see in household prevalence surveys, given the different timing of SMC and surveys in different districts, as well as variation in other confounders. Our multivariate analysis which allowed for timing was able to measure impact after allowing for these important factors.
Impact of SMC in Nigeria appeared slightly lower than in Burkina Faso for both RDT-confirmed and microscopy-confirmed malaria. SMC coverage, adherence to regimen and prevalence of molecular markers of resistance to SPAQ would influence the effectiveness of the SMC drug and impact at the population level.4 In general, coverage tends to be slightly higher in Burkina Faso than Nigeria. Coverage can also vary by state in Nigeria.34 40 Programmatic differences, such as door-to-door versus fixed point delivery, geographical reach, social mobilisation and acceptance may result in varying coverage and lower impact.2 12 Epidemiological differences, principally transmission intensity and seasonality, will affect the rate of reinfection after the period of protection. For example, if the high transmission season started earlier than SMC administration, children may be more rapidly reinfected after receiving SMC.
Analysis of malaria as diagnosed by microscopy showed slightly weaker impact of SMC in comparison to RDTs in both countries. The reason for this is unclear. A difference in the two metrics is also seen in the treatment-seeking variable. Children who sought treatment were almost two times more likely to have a positive RDT compared with those who did not seek treatment, indicating true recent malaria. In contrast, children who sought treatment had a one-third lower odds of microscopy-confirmed malaria compared with those who did not, suggesting treatment cleared current parasitaemia. This is probably due to the fact that RDTs can detect malaria infections 4–5 weeks after treatment and therefore detect more historic infections than microscopy.41
Although caution should be taken when generalising findings to other areas or time periods, similar magnitude of impact was found in research studies with an infection status outcome. Zongo et al found a protective efficacy of 34% against parasitaemia in Lena, Burkina Faso 1 month after SMC administration in 2010.6 A different IPTc trial in Boussé, Burkina Faso showed 59% protective efficacy 1 month after the end of the malaria transmission season, 6 weeks after the last course in 2008.42
Population-based household surveys provide high-quality and standardised indicators for measuring impact of malaria programmes, however, there are limitations. First, data are gathered at varying and sometimes long intervals (2–5 years) and they are not scheduled to assess specific programmes where timeliness is an important factor.9 This is important considering we find SMC impact may diminish after 3–5 months. Additionally, DHS/MIS surveys report data at administrative levels higher than programme roll-out, which may result in data not being collected in the same health district/LGA across the study years.
A limitation of this analysis is that we assume SMC administration is relatively homogenous in terms of coverage and adherence. To better incorporate the effect of varying levels of administration, indicators should be included in the DHS/MIS to capture SMC at the individual level and allow for more accurate modelling, as well as other diagnostic techniques such as PCR or serology. The analysis also assumes a constant impact of SMC with time since administration, such that the likelihood of being infected is not dependent on the number of SMC rounds previously received. This is a limitation of the data, since these surveys did not happen to fall over multiple months during the SMC administration period. This should be further explored in future analyses incorporating transmission dynamics of malaria, in particular rates of reinfection following SMC. In high transmission areas, it is less likely that SMC effects on prevalence would persist into the following year. Finally, due to the programme roll-out occurring later in areas with low transmission, it was not possible to assess whether SMC varied according to baseline prevalence.
It is difficult to determine if the observed impact on prevalence is consistent with impact on malaria incidence over the same period under investigation. Given the dynamic nature of SMC impact, a mathematical model could be used to bring together the relevant data such as prevalence, rainfall, cases, timing and uptake of SMC. This could inform if impact is consistent over time and comparable across countries. Prevalence surveys form a key part of these evaluations as they provide relatively unbiased and high-quality data. Understanding the impact of SMC on malaria prevalence as measured in DHS/MIS surveys is also important for the Global Burden of Disease estimates for malaria. These estimates rely on mathematical models based on surveys and routine data.43 44 If SMC in children under 5 is not accurately accounted for, it is possible that we may be underestimating the global burden of malaria in populations over 5.
Conclusion
Continuing monitoring and evaluation remains necessary to ensure the SMC programme continues to reach its intended goals, and to identify any issues in implementation. DHS/MIS survey data have not previously been widely used in this context. Our analysis shows that impact can be evaluated using prevalence of malaria as measured by these surveys. This adds to the evidence of impact of SMC and prevalence surveys can be brought together with other relevant data into a comprehensive analysis framework for future SMC impact evaluations.
Data availability statement
Data are available in a public, open access repository. Data may be obtained from a third party and are not publicly available. The DHS/MIS datasets analysed during the current study are available in the DHS repository, https://dhsprogram.com/Methodology/survey-search.cfm?pgtype=main&SrvyTp=country.The rainfall datasets analysed during the current study are available in the CHIRPS repository, https://www.chc.ucsb.edu/data/chirps. The geographical datasets for Nigeria analysed during the current study are available in the GADM repository, https://gadm.org/. The Burkina Faso HMIS datasets analysed during the current study are not publicly available but are usually available from the Ministry of Health on reasonable request.
Ethics statements
Patient consent for publication
References
Supplementary materials
Supplementary Data
This web only file has been produced by the BMJ Publishing Group from an electronic file supplied by the author(s) and has not been edited for content.
Footnotes
Handling editor Senjuti Saha
Twitter @lucy_okell
Contributors MAdC is the corresponding author and guarantor, responsible for the overall content of the study. MAdC, SR, CR, AR-F, PW and LCO conceived and designed the study. BS, TI, AT, CC, CO, OO and GT led acquisition of data. MAdC analysed data. All authors interpreted the findings. MAdC drafted the manuscript and all authors reviewed subsequent versions and approved the final version for submission.
Funding This study is funded through philanthropic donations to Malaria Consortium, mainly received as a result of being awarded Top Charity status by GiveWell, a non-profit organisation dedicated to finding outstanding giving opportunities through in-depth analysis. LCO and PW acknowledge funding from the MRC Centre for Global Infectious Disease Analysis (reference MR/R015600/1), jointly funded by the UK Medical Research Council (MRC) and the UK Foreign, Commonwealth & Development Office (FCDO), under the MRC/FCDO Concordat agreement and is also part of the EDCTP2 programme supported by the European Union and acknowledges funding by Community Jameel.
Map disclaimer The inclusion of any map (including the depiction of any boundaries therein), or of any geographic or locational reference, does not imply the expression of any opinion whatsoever on the part of BMJ concerning the legal status of any country, territory, jurisdiction or area or of its authorities. Any such expression remains solely that of the relevant source and is not endorsed by BMJ. Maps are provided without any warranty of any kind, either express or implied.
Competing interests None declared.
Patient and public involvement Patients and/or the public were not involved in the design, or conduct, or reporting, or dissemination plans of this research.
Provenance and peer review Not commissioned; externally peer reviewed.
Supplemental material This content has been supplied by the author(s). It has not been vetted by BMJ Publishing Group Limited (BMJ) and may not have been peer-reviewed. Any opinions or recommendations discussed are solely those of the author(s) and are not endorsed by BMJ. BMJ disclaims all liability and responsibility arising from any reliance placed on the content. Where the content includes any translated material, BMJ does not warrant the accuracy and reliability of the translations (including but not limited to local regulations, clinical guidelines, terminology, drug names and drug dosages), and is not responsible for any error and/or omissions arising from translation and adaptation or otherwise.