Article Text

Abstract
Introduction Although Rwanda’s health system underwent major reforms and improvements after the 1994 Genocide, the health system and population health in the southeast lagged behind other areas. In 2005, Partners In Health and the Rwandan Ministry of Health began a health system strengthening intervention in this region. We evaluate potential impacts of the intervention on maternal and child health indicators.
Methods Combining results from the 2005 and 2010 Demographic and Health Surveys with those from a supplemental 2010 survey, we compared changes in health system output indicators and population health outcomes between 2005 and 2010 as reported by women living in the intervention area with those reported by the pooled population of women from all other rural areas of the country, controlling for potential confounding by economic and demographic variables.
Results Overall health system coverage improved similarly in the comparison groups between 2005 and 2010, with an indicator of composite coverage of child health interventions increasing from 57.9% to 75.0% in the intervention area and from 58.7% to 73.8% in the other rural areas. Under-five mortality declined by an annual rate of 12.8% in the intervention area, from 229.8 to 83.2 deaths per 1000 live births, and by 8.9% in other rural areas, from 157.7 to 75.8 deaths per 1000 live births. Improvements were most marked among the poorest households.
Conclusion We observed dramatic improvements in population health outcomes including under-five mortality between 2005 and 2010 in rural Rwanda generally and in the intervention area specifically.
- child health
- health systems evaluation
This is an Open Access article distributed in accordance with the Creative Commons Attribution Non Commercial (CC BY-NC 4.0) license, which permits others to distribute, remix, adapt, build upon this work non-commercially, and license their derivative works on different terms, provided the original work is properly cited and the use is non-commercial. See: http://creativecommons.org/licenses/by-nc/4.0/
Statistics from Altmetric.com
Key questions
What is already known?
Much of the evidence that health system strengthening in rural Africa has improved health outcomes comes from studies of targeted regional interventions such as performance-based financing or community health worker programmes, rather than integrated interventions that encompass multiple components including infrastructure and supply chain investments, health management information system, workforce training and incentives at all levels, community health workers and free services for poor patients.
In addition to these experimental or quasiexperimental studies, a series of case studies have documented individual nations’ Pathways to Achieving Millennium Development Goal 4 target, the reduction of under-five mortality by two-thirds between 1990 and 2015.
These reports suggest that improvements in coverage of reproductive, maternal and child health indicators explain some, but not all, of the decline in child mortality and that these successes occurred in the context of national gains in health, nutrition and food security, sanitation, poverty reduction and access to clean water.
What are the new findings?
Coverage of most maternal and child healthcare interventions improved at a similar pace in our rural intervention area and other rural areas.
Despite experiencing poorer health outcomes in 2005, our rural intervention area caught up to or exceeded other rural areas on 23 of 25 population health indicators by 2010.
Infant and under-five mortality declined in our rural intervention area even more precipitously than in other rural areas of Rwanda between 2005 and 2010.
Key questions
What do the new findings imply?
The process of strengthening national health systems often involves trade-offs between a focus on first testing individual programmes that distributed widely, as is often practised by pilot programmes with multilateral institutions, or implementing multiple simultaneous programmes locally. Our results show that integrated health system strengthening interventions can be locally adapted to enable the rapid expansion of healthcare coverage as well as dramatic improvements in population health outcomes.
Integrated multilevel interventions can also help narrow the healthcare coverage and outcome gap between richer and poorer members of a society.
National governments can leverage non-governmental partners to achieve the health-related sustainable development goals through joint implementation of national health policy.
Introduction
The 1994 Rwanda Genocide was followed by a profound decline in population health that persisted for almost a decade. In the aftermath of the killing of nearly 20% of the population, HIV incidence soared, a cholera epidemic among the Rwandan refugees ensued and vaccination rates plummeted. In 2000, the new government launched a development initiative, Vision 2020, of which health equity was a major component, and in 2003, Rwanda established health as an inalienable right.1 The many healthcare initiatives implemented nationally between 2003 and 2010 included a national health insurance policy,2 performance-based financing of health programmes,3 a village community health worker programme,3 scale up of vaccinations,4 HIV treatment5 and malaria reduction initiatives.6 Between 2004 and 2011, antiretroviral therapy coverage increased sevenfold to 94%, and by 2011,7 the government of Rwanda spent 10% of public expenditure on health.8
In 2005, the non-governmental organisation, Partners In Health (PIH), and the Rwandan Ministry of Health (RMOH) began a collaboration to strengthen the health system in a region of southeastern Rwanda (henceforth referred to as Kirehe/S. Kayonza) where health outcomes were among the worst in Rwanda. Children in this area experienced higher rates of death, acute respiratory infection (ARI), diarrhoea and fever than in the other rural areas (ORAs) of the country.9 To address this, PIH and RMOH jointly led a regional effort based on the World Health Organization six building blocks of health system strengthening.10
The intervention included the renovation and equipping of dysfunctional health facilities, the recruitment, retention and training of a health workforce, the development of a medical record system, the procurement of medical products and technologies, financial support to offset health insurance premium costs and user fees and the development of governance strategies to ensure the longevity of the project. These interventions coincided with major RMOH reforms to coordinate external aid with government policies, scale-up a community-based health insurance scheme and introduce performance-based pay into the district health system.11 Notably, many of these interventions were designed to reduce child mortality rates by increasing the coverage of preventative measures such as vaccination and antenatal visits and through the expansion of community health worker networks and provision of high-quality medical care at primary, secondary and tertiary health facilities. The intervention included an accompagnateur community health worker role not present in the rest of the country to provide patients with HIV/AIDS, tuberculosis and other chronic conditions with daily home visits. Specific aspects of the RMOH-PIH intervention are described in the online supplement and reviewed elsewhere.12
Supplementary file 1
An important principle of the RMOH-PIH collaboration in Kirehe/S. Kayonza was to leverage existing resources rather than spend limited resources on building new systems. Routinely conducted Demographic and Health Surveys (DHSs) provide extensive data that can be used to measure health system outputs and population health outcomes.13 Here, we assessed the impact of the RMOH-PIH intervention using data from two DHSs sequentially conducted in Rwanda 5 years apart.
Methods
We evaluated the impact of the RMOH-PIH interventions by comparing the temporal trends in health outputs and outcomes between 2005 and 2010 in the intervention target region to those in the pooled population of all ORAs. First, we assessed health system outputs, focusing on a set of indicators meant to capture the coverage of maternal and child health services and then we assessed population outcomes including neonatal, infant and under-five mortality.
Data
We used Rwanda Demographic and Health Survey (RDHS) data collected from 21 338 women living in Kirehe/S. Kayonza (K/SK) and ORAs in 2005 (K/SK: 418, ORA: 8217) and 2010 (K/SK: 2073, ORA: 10 630) (table 1). RDHSs are nationally and subnationally representative two-stage cluster samples conducted roughly every 5 years by the RMOH, National Institute of Statistics-Rwanda (NISR) and ICF International. The surveys collect information from women aged 15–49 on their reproductive health histories, practices and desires; household composition; siblings’ survival; and children’s health and survival. The DHS birth history module included the date of the birth and death of each child born alive, and through the sibling module, the age and date of death for each biological sibling (see online supplement). The 2005 RDHS was underway at the onset of the RMOH-PIH collaboration. In order to expand the sample size to allow us to compare the intervention area to other areas, we coordinated with the NISR immediately following the 2010 RDHS to collect a supplemental sample of 1391 households from 54 primary sampling units (PSUs) in Kirehe/S. Kayonza using the same sampling frame, staff and questionnaires as the 2010 RDHS (figure 1).12 Most data were collected consistently across the three surveys (2005 RDHS, 2010 RDHS and Supplemental RDHS) although neither stunting and wasting was assessed in the supplemental survey. The response rates for surveyed women were 98% in 2005 and 99% in 2010. The RDHS urban/rural boundaries were adopted from the Rwandan government. Exact urban boundaries are not published, however, urban areas are described as being built up, population dense and having public services and facilities. All areas not meeting this definition are considered rural.14

Maps of RDHS strata and primary sampling units in 2005 (left) and 2010 (right) and the PIH-RMOH intervention area in southeastern Rwanda (green). PIH, Partners In Health; RDHS, Rwanda Demographic and Health Survey; RMOH, Rwandan Ministry of Health.
Summary of sociodemographic characteristics in 2005 and 2010
Indicators
We assessed the following child health-related health system output indicators: whether treatment was provided for recent episodes of ARI, diarrhoea or fever in children under age 5 years; whether children under age 2 years received the recommended three doses of diphtheria-polio-tetanus (DPT) or measles vaccine; whether children received vitamin A supplementation between age 6 months and 1 year; whether children were exclusively breastfed for the first 6 months of life; whether at least one, or the recommended four, antenatal care visits took place during the last pregnancy; whether the most recent birth was attended by a skilled health worker; whether the birth was delivered by caesarean section; whether women received postnatal care within 24 hours of delivery; women’s current contraceptive use; and their unmet need for contraception. The following population health outcome indicators were assessed: neonatal, infant and under-five mortality; adult mortality (men, women and combined); recent occurrence of ARI, diarrhoea or fever in children under age 5 years; and stunting and wasting in children under age 5 years.15
We calculated a composite coverage index (CCI) for both groups to monitor overall healthcare coverage across time in the intervention and comparison areas based on that proposed by Barros and Victoria (2013) but modified to exclude BCG tuberculosis vaccination coverage (which was not available) as an indicator.16 The modified CCI is a weighted average for a group that includes the prevalence of met need for contraception (FPS), skilled birth attendance (SBA), at least one ANC visit with a skilled provider (ANCS), third DTP vaccination (DPT3), measles vaccination (MSL), oral rehydration therapy (ORT) for children with diarrhoea and care seeking for pneumonia symptoms (CPNM) as follows:

Analysis
We integrated the data from the supplemental survey with that from the 2010 RDHS as follows. Sampling probability weights were recalculated for the combined 2010 dataset. To protect respondent confidentiality, we randomly geodisplaced PSU latitude/longitude coordinates in the supplemental survey up to 5 km within district boundaries according to DHS guidelines.17 All geographic information was linked to displaced PSU locations in a geographic information system (ArcGIS V.10, ESRI). We combined latitude/longitude coordinates and rural residence information to identify respondents living in Kirehe/S. Kayzona and ORAs. Additional PSU geographic characteristics included straight-line distance to the nearest main road in metres (downloaded from DIVA-GIS database), straight-line distance to Kigali province in kilometres (downloaded from Map Library database), elevation above sea level in metres (from RDHS) and 30-year (1971–2000) average total rainfall in millimetres during the months of January, April, July and October (downloaded from US National Oceanic and Atmospheric Administration Climate Prediction Center). We generated comparable household wealth scores for 2010 using the principle components generated from the 2005 RDHS,18 and we considered a household to be ‘poor’ if it ranked in the bottom 20% of wealth scores of the pooled 2005, 2010 and supplemental survey datasets. Three rural PSUs (representing 69 households and 70 women) were excluded from the 2005 dataset because the PSU GPS coordinate was missing, preventing the PSU from being linked to either Kirehe/S. Kayonza or ORA.
We compared baseline differences in woman, household and community (PSU) characteristics between the two comparison groups using χ2 tests and t-tests and temporal changes in and between groups using ordinary least squares regression with a year, group and year-by-group interaction term. Since the intervention area and ORAs may differ by factors that would have an impact on child mortality but which would not be altered by our health system strengthening intervention, we also compared the following social and geographic characteristics of sampled communities: fraction of each PSU with improved water, fraction of PSU adults who received a primary education, distance of PSU to a main road and to Kigali, elevation and average total rainfall in specified months. Finally, we compared health system outputs and population health measures at baseline.
Kirehe/S. Kayonza had been chosen as the site of the intervention, because it had the highest rate of under-five mortality in Rwanda in 2005; thus, it was not possible to identify another Rwandan rural site with comparable under-five mortality. In an attempt to identify an optimal comparison group for Kirehe/S. Kayonza, we first limited our comparison area to Eastern Province in proximity to the intervention area (see figure 1). We found under-five mortality was higher in the intervention area than the rest of Eastern Province or any other subregion, and comparisons of other indicators were mixed (see online supplement). When a subregion was not identified for comparison, we used propensity score matching with inverse probability of treatment weights to identify comparable communities from ORAs by assessing PSU characteristics that might differ between the intervention and comparison areas but which would not be expected to be altered by the intervention (distance to road, distance to Kigali, elevation and average rainfall). We generated a bias B value to capture the difference in the standard deviation between the means of the groups and an R value that is the ratio of variances in the two groups. Following Rubin, we considered the groups to be balanced if B was less than 25% and R was between 0.5 and 2.19 Kirehe/S. Kayonza and ORAs were balanced by the R value but not by the B bias value (B=340.9, R=0.54) (see online supplement). Since neither approach identified a more appropriate comparison group, we compared Kirehe/S. Kayonza to all ORAs adjusting models for sociodemographic characteristics that followed different trends in Kirehe/S. Kayonza and ORAs over time.
We used ordinary least squares regression with group, year and group–year interaction terms to model changes in binary health outputs and outcomes, controlling for differences in woman’s age and household wealth. We modelled change in childhood mortality rates using the DHS synthetic life-table approach, which uses the histories of all children a mother reports to have been alive during the previous 5 years.20 Adult mortality rates were based on a 5-year synthetic cohort of respondent’s siblings' births and deaths.21 Expected mortality rates were calculated by standardising mortality rates of ORAs to the age structure in Kirehe/S. Kayonza. We estimated mean changes between 2005 and 2010 as the absolute difference in rates, and we calculated variances of trends as the sum of year–group variances. We adjusted for clustering of observations by PSU using Taylor linearised variance estimation in regression models and jackknife repeated replications to estimate variance in all other analyses.21 We conducted regressions in Stata V.13 and mortality analyses in SAS V.9.2.
Ethics statement
Verbal consent was obtained for all respondents before interviews took place. Protocols for the Rwanda 2005 and 2010 DHSs were approved by the Rwandan government. Protocols for the 2010 supplemental survey were reviewed and approved by the Partners HealthCare Internal Review Board (protocol #: 2009 P-001941/8) and the Rwanda National Ethics Committee.
Role of the funding source
The funders had no role in study design, data collection, data analysis, data interpretation, writing of this report, nor the decision to submit this paper for publication. The corresponding author (DRT) had full access to all the data in the study and had final responsibility for the decision to submit for publication.
Results
Demographic and geographical data
At baseline, women in Kirehe/S. Kayonza and ORAs were similar in terms of age, marital status, employment and literacy. Households in Kirehe/S. Kayonza had fewer household assets but greater access to improved water sources than in ORAs (table 1). Kirehe/S. Kayonza also differs from ORAs in terms of its geography; this region has lower elevation and lower rainfall during the second half of the calendar year (table 1). Between 2005 and 2010, households in Kirehe/S. Kayonza acquired more assets than in ORAs and the age distribution of women shifted to the right. Access to improved water sources rose more steeply in the ORAs during the study period (table 1).
Health system outputs
Table 2 shows that after we adjusted for household wealth and woman’s age, baseline health system outputs were not significantly different in Kirehe/S. Kayonza with some exceptions: vitamin A supplementation was lower in Kirehe/S. Kayonza than in the ORAs (72.3% vs 84.3%, P=0.005), while contraception use among married women was higher (13.9% vs 8.2%, P=0.011) in Kirehe/S. Kayonza than in the ORAs (table 2, column D).
Health system outputs 2005–2010 in Kirehe/S. Kayonza (K/SK) and other rural areas (ORAs)
Most health system output indicators improved significantly between 2005 and 2010 in both groups (table 2, column H), although for many indicators, the comparison of trends between the two groups were not statistically significant (table 2, column I). Indicators that did not improve over time included exclusive breast feeding for the first 6 months of life and treatment of fever which did not change significantly in either group between 2005 and 2010 (table 2, column H). The proportion of children treated for ARI rose from 18.7% to 54.6% in Kirehe/S. Kayonza and from 26.2% to 36.5% in ORAs (P=0.001), while proportion of women receiving four antenatal visits rose from 10.4% to 26.9% in Kirehe/S. Kayonza and from 12.8% to 35.2% in ORAs (P=0.057) (table 2, column I). Overall health system coverage as measured by the modified CCI increased from 57.9% to 75.0% in Kirehe/S. Kayonza and from 58.7% to 73.8% in ORAs (table 2).
Population health outcomes
After adjustment, we found that most baseline measures of child health were worse in Kirehe/S. Kayonza than in ORAs (10.99% more ARI, P=0.005; 5.41% more diarrhoea, P=0.038; 11.91% more fever, P=0.003; 72 more under-five deaths per 1000 births, P=0.045), with the exception of stunting, which was 5.43% more prevalent in ORAs (P=0.018) (table 3, column D). We noted improvements between 2005 and 2010 for both groups in ARI, fever, neonatal mortality, infant mortality and under-five mortality (P<0.05 for all) (table 3, column H); these improvements were greater for ARI, diarrhoea, and fever in Kirehe/S. Kayonza (P<0.05 for all) (table 3, column J).
Health outcomes 2005–2010 in Kirehe/S. Kayonza (K/SK) and other rural areas (ORAs), adjusting for mother’s age and household wealth
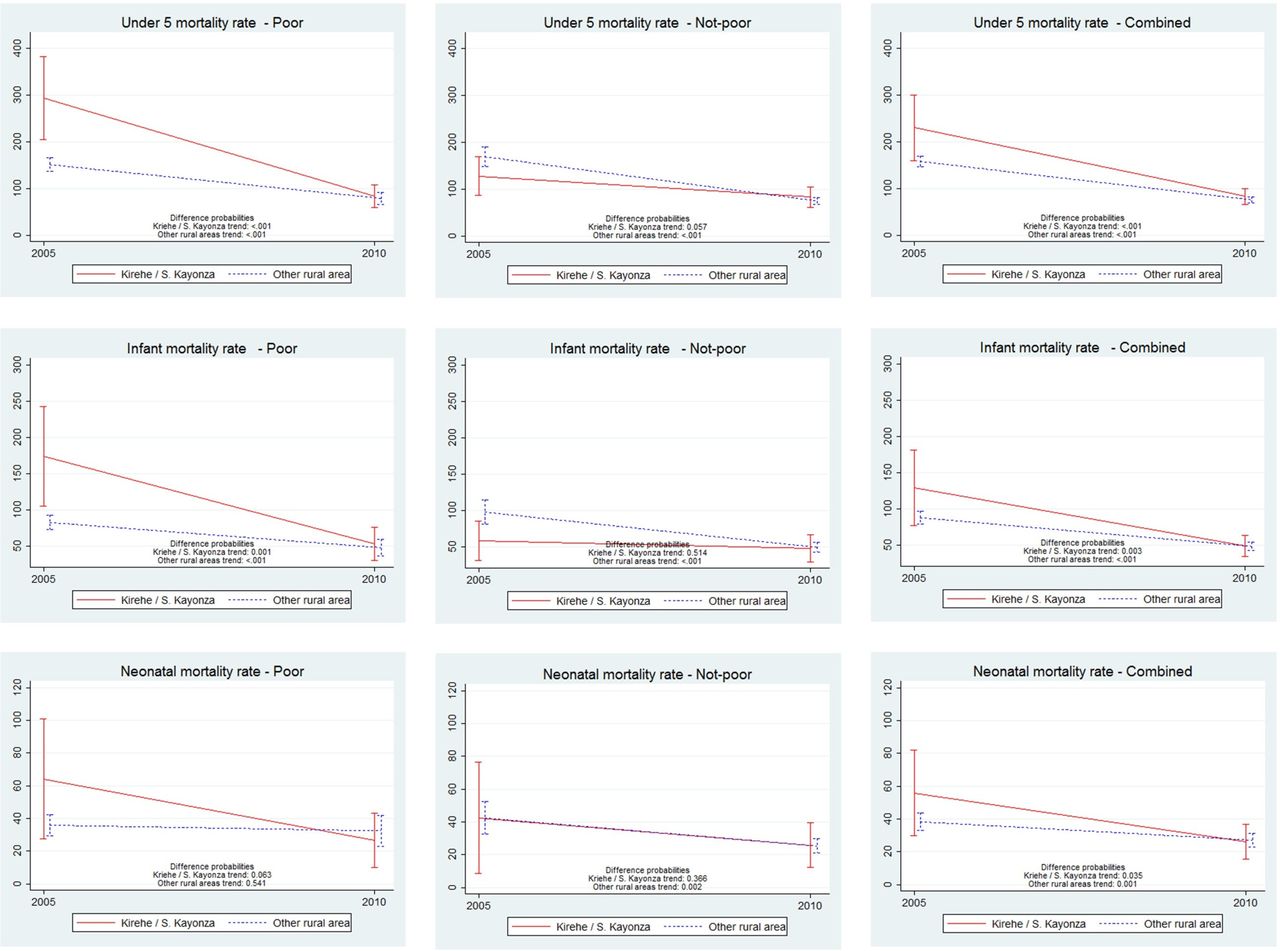
Importantly, under-five mortality dropped precipitously in both groups during the study period from 229.8 to 83.2 under-five deaths per 1000 live births in Kirehe/S. Kayonza (P<0.001) and from 157.7 to 75.8 in ORAs (P<0.001) (table 3, column H). These changes represent annual reductions in under-five mortality of 12.8% and 8.9% for the intervention and ORAs, respectively (table 3, column I). The greatest reductions in childhood mortality occurred among the poorest households in Kirehe/S. Kayonza with a dramatic drop in mortality from 275.4 to 89.4 deaths per 1000 live births in Kirehe/S. Kayonza (annual rate of reduction: 13.5%) compared with 152.2 to 76.2 deaths per 1000 live births in ORAs (annual rate of reduction: 9.0%). Figure 2 shows that the gains in child survival in wealthier strata were much less steep. By 2010, there were no significant differences between Kirehe/S. Kayonza and ORAs in terms of child health outcomes (P>0.05 for all) (table 3, column G).
Comparison of trends in under-five, infant and neonatal mortality between 2005 and 2010 in Kirehe/S. Kayonza versus other rural areas by household wealth status.
In 2005, the standardised male adult mortality rate was lower in Kirehe/S. Kayonza than in ORAs (P=0.016), and there was no difference in rates for women (P=0.233) (table 3, column D). Both female and male adult mortality in Kirehe/S. Kayonza dropped between 2005 and 2010 (from 497 to 257 deaths per 100000 among women and from 400 to 326 deaths per 100000 among men) (table 3, columns C and F), and there was no difference in the change in standardised adult mortality rates between the two groups (P=0.062) (table 3, column J).
Discussion
Between 2005 and 2010, coverage of health system outputs improved dramatically in the area of southeast Rwanda targeted by the intervention and in ORAs of the country. This increased coverage was accompanied by steep declines in adult, under-five, infant and neonatal mortality in both settings. Although changes in health system outputs were similar in both groups, the average annual declines in under-five, infant and neonatal mortality were steeper in the intervention area. The differences in these rates of decline in population outcomes did not meet statistical significance, however, possibly because the 2005 RDHS was underpowered to detect subregional differences, and we did not oversample the intervention area at baseline.
These data are consistent with the findings from a recent overview of global trends in child mortality that identified Rwanda as a top performer worldwide in reducing under-five mortality between 2000 and 2015.22 Though Rwanda is classified as a least developed country, its national 9.9% annual rate of reduction in under-five deaths is surpassed only by the upper middle-income nation of the Maldives.23 This reduction is more than twice the global rate of 4.4% during the same time period.23
Multiple studies in other settings suggest that national health gains can often mask substantial heterogeneity in health system performance and outcomes.24 25 In many settings, impoverished and/or geographically inaccessible areas have experienced slower progress in achieving health goals.26 27 In other studies, socioeconomic status did not correlate well with health system performance.28 Our results show that the historically unprecedented improvement in health indicators not only extends to urban and wealthier areas of the country, but is also possible among its poorest and most geographically isolated residents. Notably, almost all of the decline in under-five mortality occurred among the lowest two wealth quintiles in the Kirehe/S. Kayonza region where the intervention included specific components (subsidies of insurance premiums and copays, nutrition support and compensated village-based community health workers) designed to address inequities in access to care.
How were the remarkable improvements in health outcomes made in the regions and socioeconomic groups we assessed? Several previous reports describe the major components of Rwanda’s national health strategy during this period of success.22 29 Like Rwanda’s plan to improve health outcomes throughout the country, our intervention was deliberately comprehensive, and it is challenging to disentangle specific components that contributed to the health gains observed. Interestingly, despite the fact that under-five mortality was almost one-third lower in ORAs than it was in Kirehe/S. Kayonza in 2005, the modified CCI of the set of interventions thought to reduce under-five mortality was very similar between the groups. Nonetheless, Kirehe/S. Kayonza initially trailed the ORAs in two interventions most likely to target common causes of death among children in lower-income and middle-income countries: case management of pneumonia and diarrhoea. Importantly, these indicators capture access to curative care rather than preventive measures and may be better proxies for existence of health systems than are interventions such as vaccination or vitamin A supplementation, which can be delivered without investment in the kinds of health system building blocks that were targeted in Kirehe/S. Kayonza. The modified CCI increased similarly in both groups, but Kirehe/S. Kayonza had closed the gap in case management for diarrhoea and achieved higher coverage for exclusive breast feeding and case management of ARI by 2010. In contrast, ORAs outperformed Kirehe/S. Kayonza in measles vaccination, vitamin A supplementation, ANC4 and skilled birth attendants, all of which might be expected to have a less direct impact on overall mortality.
In addition to a focus on equity, the construction or renovation of two district hospitals, and higher coverage of horizontal interventions addressing major causes of child death, the Kirehe/S. Kayonza intervention combined a rigorous programme of compensated village-based community health workers with improvements in infrastructure and staffing of the facilities to which community health workers referred patients for care. The indicators of healthcare coverage assess the frequency, but not the quality, of the care provided, and are therefore coarse tools by which to measure the impact of the range of interventions embodied in the six WHO building blocks. For example, treatment of malaria with an antipyretic rather than artemesin meets the criteria for case management of fever as assessed in the DHS but is unlikely to have a major impact on child mortality. Recognising the challenges of designing an evaluation that captures the relative effects of these components of our care model, we suggest that the impact of the Kirehe/S. Kayonza intervention is partly attributable to the coordinated strengthening of services at multiple levels (community, health centres and hospitals) with a focus on quality of care.30
We note several important limitations to this study. First, mother-reports may be imperfect measures of illness and treatment, especially for such indicators as ARIs including pneumonia and whether the child received antibiotic treatment.31 Second, the sample size at baseline was small. Dwyer-Lindgren and colleagues have shown that under-five mortality estimates derived from birth histories with sample sizes under 500 can be biased and usually underestimate the true value of mortality.32 They also show that underestimation of mortality tends to occur when estimates are based on surveys conducted in high mortality settings. With a sample size of only 359 birth records in the 2005 survey of the very high mortality intervention region, it is possible that the true Kirehe/S. Kayonza baseline under-five mortality rate was even higher and the decline between 2005 and 2010 steeper than we estimated.
Third, the cross-sectional nature of the surveys did not allow for tracking changes in individuals, households or communities. Anecdotal evidence suggests that a number of chronically sick individuals and their families from nearby districts moved to Kirehe/S. Kayonza after health system improvements began. The opening of new health facilities and establishment of the PIH-Rwanda headquarters in Kirehe/S. Kayonza also attracted new, better educated employees to the region and stimulated related commerce. The cross-sectional study design does not allow for determining to what extent changes in health were driven by the health system strengthening intervention in the baseline population, compared with other demographic changes in the population that occurred during the intervention period. Fourth, we were only able to measure WHO building block indicators available in the RDHS questionnaire; data about perception or quality of care, for example, could not be included. As in any household questionnaire, selection and recall biases may have also affected estimates.
Finally, the ideal evaluation of this intervention would have involved comparing the 2010 indicators in the intervention group to a population that had identical 2005 health status but which had not received the intervention. As discussed in the Methods section, the intervention site was chosen because it had the highest under-five mortality in the country, and we were thus unable to identify an area with a similarly high rate of under-five mortality. If improvements in child mortality rates are easier to achieve when the baseline levels are high, our finding of a steeper decline in mortality in the intervention group may simply reflect this discrepancy in the baseline rate, rather than any meaningful difference between the intervention and ORAs. However, we find little evidence in the literature to support this ‘low hanging fruit’ hypothesis with most repeated measurements of mortality over time in a specific population demonstrating a linear decline on a log scale.33
Conclusion
Rwanda experienced historic health improvements between 2005 and 2010, and those improvements were even more pronounced in Kirehe/S. Kayonza where RMOH-PIH rolled out an integrated health system strengthening intervention in 2005. This area had substantially poorer performance on population health outcomes in 2005 but narrowed that gap considerably by 2010. Furthermore, the drop in under-five mortality in Kirehe/S. Kayonza was modestly higher than that of the historic drop experienced nationally and in ORAs. Although we are not able to attribute health improvements in Kirehe/S. Kayonza to the RMOH-PIH programme alone, the RMOH-PIH programme likely played a key role in these monumental health achievements.
Acknowledgments
We thank ICF International and the Rwanda Ministry of Health for collecting these data and supporting the cleaning of supplemental survey data in Kirehe and Southern Kayonza districts. We also thank Paulin Basinga, Jeanine Condo, Saleh Niyonzima, Adolphe Karamaga, Cathy Mugeni and Fidele Ngabo, who contributed to the design and implementation of these methods, and James Robins and Bethany Hedt-Gauthier for discussions about statistical modelling. Finally, deepest thanks to the hundreds of staff and healthcare providers who have worked in Kirehe and Southern Kayonza over the last decade to deliver quality care and continually pursue improvements in Rwanda’s health system. This paper is a product of a collaborative working group that was led by Harvard Medical School. Data collection for this project was paid for by the Doris Duke Charitable Foundation through the Population Health Implementation & Training (PHIT) Partnerships that link implementation research and training directly to health care delivery.
References
Footnotes
Handling editor Seye Abimbola
Contributors The following people were involved with the design and/or implementation of the health system intervention in K/SK: CA, FCR, PD, KEF, DBF, PEF, AH, AM, PN, MLR, SS and AB. MHB, LRH and MBM helped to conceive of the evaluation design. DRT and SA conducted the analysis. DRT, MHB and MBM drafted the paper. All coauthors closely reviewed the paper, contributed additional interpretations and approved the final version to be published.
Funding This study was funded by Doris Duke Charitable Foundation (Population Health Implementation & Training (PHIT)).
Disclaimer The content of this article is solely the responsibility of the authors and does not necessarily represent the official views of the institutions to which the authors are affiliated.
Competing interests Past and current employees of PIH and RMOH contributed to the study design and writing of this manuscript because they had knowledge of the programme under evaluation and of Rwanda’s health system and context. No PIH or RMOH affiliated coauthors were involved with statistical analysis and interpretation.
Patient consent Detail has been removed from this case description/these case descriptions to ensure anonymity. The editors and reviewers have seen the detailed information available and are satisfied that the information backs up the case the authors are making.
Ethics approval Protocols for the 2010 supplemental survey were reviewed and approved by the Partners HealthCare Internal Review Board (protocol #: 2009 P-001941/8) and the Rwanda National Ethics Committee.
Provenance and peer review Not commissioned; externally peer reviewed.