Article Text

Abstract
Introduction Malawi’s malaria burden is primarily assessed via cross-sectional national household surveys. However, malaria is spatially and temporally heterogenous and no analyses have been performed at a subdistrict level throughout the course of a year. The WHO recommends mass distribution of long-lasting insecticide-treated bed nets (LLINs) every 3 years, but a national longitudinal evaluation has never been conducted in Malawi to determine LLIN effectiveness lifespans.
Methods Using District Health Information Software 2 (DHIS2) health facility data, available from January 2018 to June 2020, we assessed malaria risk before and after a mass distribution campaign, stratifying by age group and comparing risk differences (RDs) by LLIN type or annual application of indoor residual spraying (IRS).
Results 711 health facilities contributed 20 962 facility reports over 30 months. After national distribution of 10.7 million LLINs and IRS in limited settings, malaria risk decreased from 25.6 to 16.7 cases per 100 people from 2018 to 2019 high transmission seasons, and rebounded to 23.2 in 2020, resulting in significant RDs of −8.9 in 2019 and −2.4 in 2020 as compared with 2018. Piperonyl butoxide (PBO)-treated LLINs were more effective than pyrethroid-treated LLINs, with adjusted RDs of −2.3 (95% CI −2.7 to −1.9) and −1.5 (95% CI −2.0 to −1.0) comparing 2019 and 2020 high transmission seasons to 2018. Use of IRS sustained protection with adjusted RDs of −1.4 (95% CI −2.0 to −0.9) and −2.8% (95% CI −3.5 to −2.2) relative to pyrethroid-treated LLINs. Overall, 12 of 28 districts (42.9%) experienced increases in malaria risk in from 2018 to 2020.
Conclusion LLINs in Malawi have a limited effectiveness lifespan and IRS and PBO-treated LLINs perform better than pyrethroid-treated LLINs, perhaps due to net repurposing and insecticide-resistance. DHIS2 provides a compelling framework in which to examine localised malaria trends and evaluate ongoing interventions.
- malaria
- PCR
- epidemiology
Data availability statement
All relevant data are within the manuscript and supplement. DHIS2 data that support study findings are available from the authors with written permission from the Malawi Ministry of Health.
This is an open access article distributed in accordance with the Creative Commons Attribution Non Commercial (CC BY-NC 4.0) license, which permits others to distribute, remix, adapt, build upon this work non-commercially, and license their derivative works on different terms, provided the original work is properly cited, appropriate credit is given, any changes made indicated, and the use is non-commercial. See: http://creativecommons.org/licenses/by-nc/4.0/.
Statistics from Altmetric.com
Key questions
What is already known?
The WHO recommends mass distribution of long-lasting insecticide-treated bed nets (LLINs) every 3 years. LLINs are used alongside indoor residual spraying (IRS) intervention programmes in sub-Saharan Africa, but the maximum LLIN effectiveness lifespan is unknown.
Most published studies on LLIN effectiveness are cross-sectional with a narrow geographic range, often taking place within a single district and prohibiting estimation of how malaria changes spatially and temporally in response to national interventions.
Previously published national Malaria Indicator Surveys are also limited by cross-sectional designs and reporting of malaria estimates across broad regions. Studies using large, longitudinal and fine-scale datasets are needed to understand the effectiveness and lifespans of national LLIN and IRS interventions in Malawi.
Key questions
What are the new findings?
This longitudinal observational study is the first analysis to determine the effects of a national mass LLIN distribution campaign and application of annual IRS on monthly malaria risk, using District Health Information Software 2 (DHIS2) health facility data stratified by age group and insecticide type. With data over 30 months from 711 facilities encompassing 20 962 observations, findings suggest that the protective effects of LLINs disappear 1–2 years after LLIN distribution in Malawi, leaving millions unprotected.
The magnitude of protective effects varied by intervention type and geographical location, but nationally, piperonyl butoxide (PBO)-treated nets and application of IRS performed better than pyrethroid-treated nets in adjusted analyses. Areas receiving annual IRS sustained low malaria risk over two high transmission seasons, and subsequent application of IRS reduced malaria risk in areas where pyrethroid-treated nets previously had no effect.
What do the new findings imply?
Nationally, LLIN lifespan was shorter than expected under existing recommendations for mass distribution campaigns and varied by geographic region and intervention type. Mapping of confirmed malaria risk at the health facility level demonstrates the feasibility of using DHIS2 to estimate local and temporal variations in malaria risk continuously across an entire country.
Relative to pyrethroid-treated nets, national roll-out of PBO-treated nets in 2018 would have averted 665 522 (95% CI 505 858 to 825 185) confirmed cases of malaria over the 2019 and 2020 high transmission seasons following the mass campaign and national use of IRS would have averted an estimated 752 771 (95% CI 532 559 to 972 983) cases. Policy decisions regarding the type of LLIN used and application of IRS in national rollouts have the potential to substantially alter Malawi’s malaria burden, preventing morbidity, mortality and a strain on health centre resources for diagnosis and treatment.
Introduction
Malaria is endemic in Malawi, accounting for 30% of outpatient visits and 34% of inpatient admissions in-country.1 Historically, national malaria measures have been exclusively estimated cross-sectionally, such as through United States Agency for International Development (USAID)-funded Malaria Indicator Surveys (MIS) in 2012, 2014 and 2017. MIS are designed to offer a high-level glance at malaria prevalence among children 6–59 months in Malawi’s three regions, however, malaria in Malawi is known to be geographically heterogenous at the subdistrict level,2 varies at the household level,3 and differs across age groups and seasons. MIS only sample during high transmission months, prohibiting estimation of how patterns fluctuate throughout the year and requiring extensive time and resources dedicated to active data collection. Other research involving annual parasite rates in children4 and predicted risk across smaller land areas5 have only achieved a detailed focus by modelling survey data. National longitudinal studies using large fine-scale datasets are needed to inform programmes and policy.
Through District Health Information Software 2 (DHIS2), a health management information system, each health facility reports monthly composite statistics to the Malawi Ministry of Health via District Health Coordinators. Malaria data include total confirmed case counts for persons <5 years of age and ≥5 years of age each month, which can be used to track the burden of disease continuously over time through passive surveillance. Similarly constructed DHIS2 malaria data have already been analysed in Uganda, Zimbabwe and Kenya to determine the effects of vector control and artemisinin-based combination therapy, assess reporting completeness and map the spatial distribution of malaria by district.6–8 At present, Malawi’s DHIS2 malaria data have only been assessed at the district and national levels, recording 7.0 million confirmed cases in 2018.9 No analyses have used DHIS2 at the health facility level, providing the detail necessary to target local areas for intervention.
Long-lasting insecticide-treated bed nets (LLINs) are integral to Malawi’s malaria prevention efforts, and fundamental to achieving the reduction goals outlined in Malawi’s Malaria Strategic Plan 2017–2022. LLINs provide a physical and chemical barrier to mosquito bites, and nets treated with various insecticides are selected for implementation based on vector-resistance and cost. Implementation occurs through mass distribution campaigns and continuous distribution to pregnant women at antenatal care visits and to newborns following birth.1 Insecticide-treated nets (ITNs) provide individual and community level protective benefits within a year of distribution,10 but there is no consensus on the maximum LLIN lifespan. WHO recommendations suggest conducting mass distribution campaigns every 3 years,11 however, field research across Africa suggests that nets have a much shorter lifespan, and rapidly become ineffective due to holes, reduced concentrations of insecticide and repurposing.12–15 Malawi also recently implemented annual indoor residual spraying (IRS) in one district in 2018, expanding to additional districts each year.9 Prior research on mass distribution campaign effectiveness in Malawi has been limited by the use of cross-sectional survey data16 and narrow geographic range,17 and there has never been a national longitudinal assessment or comparison between various LLIN types and application of IRS.
We present the first national longitudinal analysis of confirmed malaria risk at the health facility level, using DHIS2 to estimate geographical and temporal variation from January 2018 to June 2020. We assess risk before and after a mass bed net distribution campaign in late 2018 and stratify by intervention type including pyrethroid-treated nets, piperonyl butoxide (PBO)-treated nets and IRS. Fine-scale evaluation of malaria risk over time and direct comparison of intervention types provides insight into the effectiveness of national interventions. Given that DHIS2 is routinely used in 72 low-income and middle-income countries, capturing metrics from 2.3 billion people,18 this study design can be replicated across the globe to inform regional and national health policies for malaria and other diseases.
Methods
Study design and population
This observational, longitudinal surveillance study uses DHIS2 confirmed malaria case statistics and population counts to assess risk of disease cross-sectionally by month. Malawi’s population is 17.5 million, with 2.6 million (15%) under the age of 5 years.19 The entire population lives in moderate to high malaria transmission zones and are at risk of infection.9 The outcome of interest was confirmed malaria cumulative incidence (cases/population). Cases included individuals presenting at health facilities with a confirmed malaria diagnosis captured in DHIS2 from January 2018 through June 2020. Confirmed cases are recorded as aggregated monthly counts at the health facility level within strata of age, test result and other variables; DHIS2 contains no individual-level data. Population estimates were extracted from WorldPop data.20 Although it is possible for an individual to experience more than one malaria episode per month or per season, we refer to cumulative incidence as a ‘1-month risk’ or ‘5-month risk’ for simplicity. The exposure of interest was the 2018 LLIN mass distribution campaign and/or annual IRS.
District Health Information Software 2
Malawi DHIS2 data are only available at the health facility level from 2018 onward. Indicators were summed within age groups to create counts of malaria cases confirmed through microscopy or rapid diagnostic test in the following settings: outpatient, inpatient and community village health clinic (applicable to children <5 years). DHIS2 captures data from both public and private health facilities but does not capture asymptomatic cases, symptomatic cases that do not present for care and those that seek diagnostic and treatment services through traditional medicine.
A total of 756 facilities recorded data in 2018, 925 in 2019 and 926 as of June 2020, resulting in 25 099 total observations (online supplemental figure 1). Health facilities were linked to geographic coordinates through existing data sources21 and cross-referenced using Google Maps and OpenStreetMap. Health centres with duplicate coordinates and names were combined into single entries.
Supplemental material
Spatial analysis and population measurements
Population estimates were derived from the WorldPop project which releases population raster maps modelled from census counts, night-time lights, settlement buildup, landcover, roads and other variables, downscaled to 100×100 m grid squares and stratified by <5 and ≥5 years age groups.20 Since existing rasters were created using UN population projections based on the 2008 census, we used an open-source algorithm22 to recalculate up-to-date estimates using 2018 census counts within each traditional authority boundary.23
To determine population denominators for each health facility, we delineated catchment areas using Thiessen polygons (figure 1). A Thiessen polygon is defined as a region that contains all areas that are closer to a particular health facility than to any other neighbouring facilities. Catchment areas were overlaid on the recalculated WorldPop rasters and <5 and ≥5 population counts were summed within areas. Longitudinal environmental data were visualised to assess potential bias in risk estimates between years (online supplemental figure 2). We used Climate Research Unit gridded Time Series V.4 which interpolates values from in situ weather station data, creating national monthly estimates of average temperature and total precipitation.24
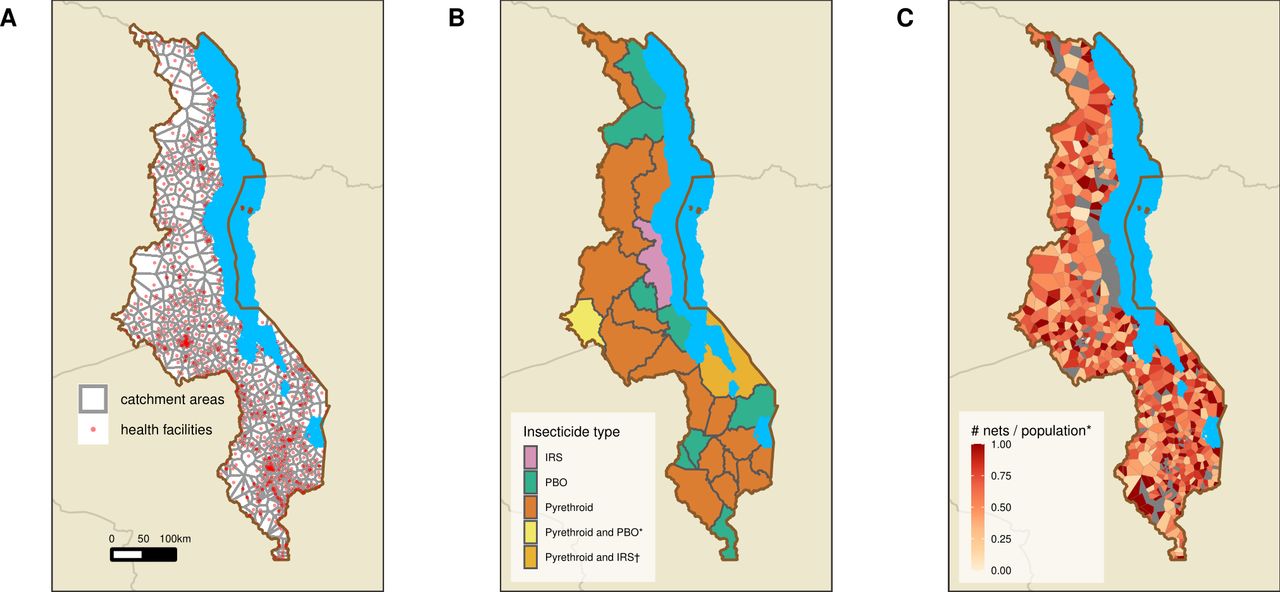
Health facility catchment areas and distribution of long-lasting insecticide-treated nets from September to December 2018 during Malawi’s mass distribution campaign, and implementation of IRS in October and November 2018 and in November and December 2019. (A) Health facility catchment areas for health facilities with data in Malawi’s District Health Information Software 2 in 2018–2020 (n=711), calculated by Euclidean distance using Thiessen polygons. (B) Assigned intervention and insecticide type by district. *Mchinji distributed 69.4% pyrethroid-treated nets and 30.6% PBO-treated nets; †IRS in 2019 only. (C) Density of nets (number of nets per person) by health facility catchment area. *Values >1 set to 1. IRS, indoor residual spraying; PBO, piperonyl butoxide.
Bed net mass distribution campaign and annual IRS
Malawi’s most recent mass distribution campaign occurred from September to December 2018, across 27 of 28 districts. Each district administered either permethrin or deltamethrin (Olyset or Permanent; ‘pyrethroid’) treated nets, or permethrin+PBO-treated nets (Olyset Plus; ‘PBO’), with one district, Mchinji, distributing both (figure 1). Mchinji was assigned pyrethroid-treated nets in analyses, as 69.4% of LLINs were pyrethroid-treated. LLIN type was anecdotally assigned by the malaria burden within each district and population size, but we found no association between intervention assignment and baseline 2018 malaria risk at the health facility (p=0.3) or district levels (p=0.3). Health facilities coordinated household distribution via centralised locations within their catchment areas such as primary schools, health posts and churches. LLINs were distributed by 648 health facilities and 602 (92.9%) were linked to DHIS2 and used in health facility level risk analysis. Small private facilities and health posts were not involved in LLIN distribution. All distribution facilities were included in district level calculations. Bed net type and distribution count data were obtained from Malawi’s National Malaria Programme, with data collected from district leads. Count data were reported at the health facility level. Due to a national shortage of nets, one district, Nkhotakota, was assigned to receive IRS. Mangochi received pyrethroid-treated nets in 2018 and IRS in 2019 and was not included in adjusted modelling. IRS with pirimiphos-methyl CS was administered from October to November 2018, and pirimiphos-methyl CS and clothianidin from October to November 2019 in Nkhotakota and November to December 2019 in Mangochi.
Statistical analysis
One-month risk differences (RDs) were calculated by comparing risk by month and in high (January to May) and low (June to December)1 transmission seasons before and after the mass distribution campaign. Quasi-Poisson regression models were used to estimate and compare risks under scenarios where all health facilities received pyrethroid-treated nets, PBO-treated nets or IRS. Models estimating risks under these scenarios adjusted for baseline 2018 malaria risk and LLIN coverage, and the delta method was used to estimate 95% CIs. RDs were not adjusted for environmental variables as LLIN distribution was unrelated to environmental factors or geospatial area. Risk values were visualised using maps and graphs stratified by time and age group. All tabulations, models and maps were run using R V.3.6.2 (R Foundation for Statistical Computing, Vienna, Austria) and the sf (v0.9–2; Pebesma, 2020) and ggalt (v0.4.0; Rudis, 2017) packages.
Patient and public involvement
Due to the nature of this longitudinal study, patients or the public were not involved in the design, conduct, reporting or dissemination plans of our research.
Results
This analysis included 711 facilities with DHIS2 data in 2018, 2019 and 2020, encompassing 20 962 (of 25 099; 83.5%) total health facility reports. DHIS2 is an evolving system and most of the facilities added in 2019 and 2020 were small private clinics or dispensaries, servicing local areas for specific outcomes such as reproductive health services or HIV testing. As a result, our analysis still captured 97.1% (16.6 M/17.1 M) of total confirmed malaria cases reported into DHIS2 during the study period (online supplemental table 1). The majority (580, 81.6%) of health facilities reported data for the entire 30-month study period and nearly all facilities (709, 99.7%) reported data for at least 24 months. Over 10.7 million bed nets were distributed in 2018; 1 net was distributed for every 1.6 (range by district: 1.3–2.2) people nationally (online supplemental table 2) and 1 net for every 0.24 children <5 years. Nkhotakota sprayed 112 264 structures with insecticide in 2018, resulting in a coverage rate of 95%.9 IRS coverage in 2019 was 89% in Nkhotakota (population=393 077) and 78% in Mangochi (population=1 148 611).
One-month risk varied geographically and seasonally among all age groups, with elevated estimates during high transmission seasons nationally and year-round along the shores of Lake Malawi (figure 2). Risk was higher among children <5 years than among individuals ≥5 years and was heterogenous within district boundaries.

Median 1-month risk of malaria (cases per 100 people) by high (January to May) and low (June to December) malaria transmission season and health facility catchment area, 2018–2020, among (A) the total population, (B) children <5 years and (C) individuals ≥5 years of age. Confirmed case data are taken from Malawi’s District Health Information Software 2 and population denominators from adapted WorldPop 2018 estimates. *Risk values >50 are set at 50 cases per 100 people.
During high transmission seasons, there were 4.3 million recorded malaria cases nationally in 2018, 3.0 million in 2019 and 4.1 million in 2020. Spanning all seasons there were 6.8 million cases in 2018 and 5.1 million in 2019, an overall annual reduction of 1.7 million cases following the LLIN campaign. One-month malaria risk was lower during high transmission months in 2019 as compared with 2018, an association which held for all age groups and intervention types (figure 3, online supplemental table 3). One-month risk rebounded across all groups in 2020, except for areas receiving IRS. Malaria risk over 5-month high transmission seasons decreased from 25.6 cases per 100 people in 2018 to 16.7 cases per 100 people in 2019 (table 1), a crude RD of −8.9. 95% CIs were precise to one-tenth of a percent due to the thousands of individuals included in each age group. Five-month risk increased up to 23.2 in 2020, with a seasonal RD of −2.4 comparing 2018 and 2020. Variations in risk were greater among children <5 years with seasonal RDs of −30.2 and −16.8 cases per 100 people, comparing risk in 2019 and 2020–2018, respectively; estimates among individuals ≥5 years showed similar trends (−5.3 and 0.1). Malaria risk was less varied during low transmission seasons, with seasonal RDs of −8.0, –1.4 and −2.4 cases per 100 people among <5 years, ≥5 years and all ages comparing 2019–2018.
Risk of malaria (cases per 100 people) by high (January to May) and low (June to December) malaria transmission seasons, stratified by age group and insecticide type, January 2018 to June 2020

One-month risk of malaria (cases per 100 people) from January 2018 to June 2020, stratified (A) by age group and (B) by insecticide type. ‘No data’ refers to health facilities which did not have any bed net distribution or IRS information. Dark grey colour blocks represent months where the mass distribution campaign occurred (September to December 2018) and light grey blocks represent months which fall during the yearly high malaria transmission season (January to May). Risk was measured monthly and curves are smoothed using X-splines. IRS: 1 district; 22 health facilities; 387 523 people; PBO: 9 districts; 127 health facilities; 3 150 863 people; Pyrethroid: 17 districts; 423 health facilities; 10 854 018 people; Pyrethroid and PBS: 1 district; 48 health facilities; 1 141 817 people; No data: 91 health facilities; 2 221 396 people. IRS, indoor residual spraying; PBO, piperonyl butoxide.

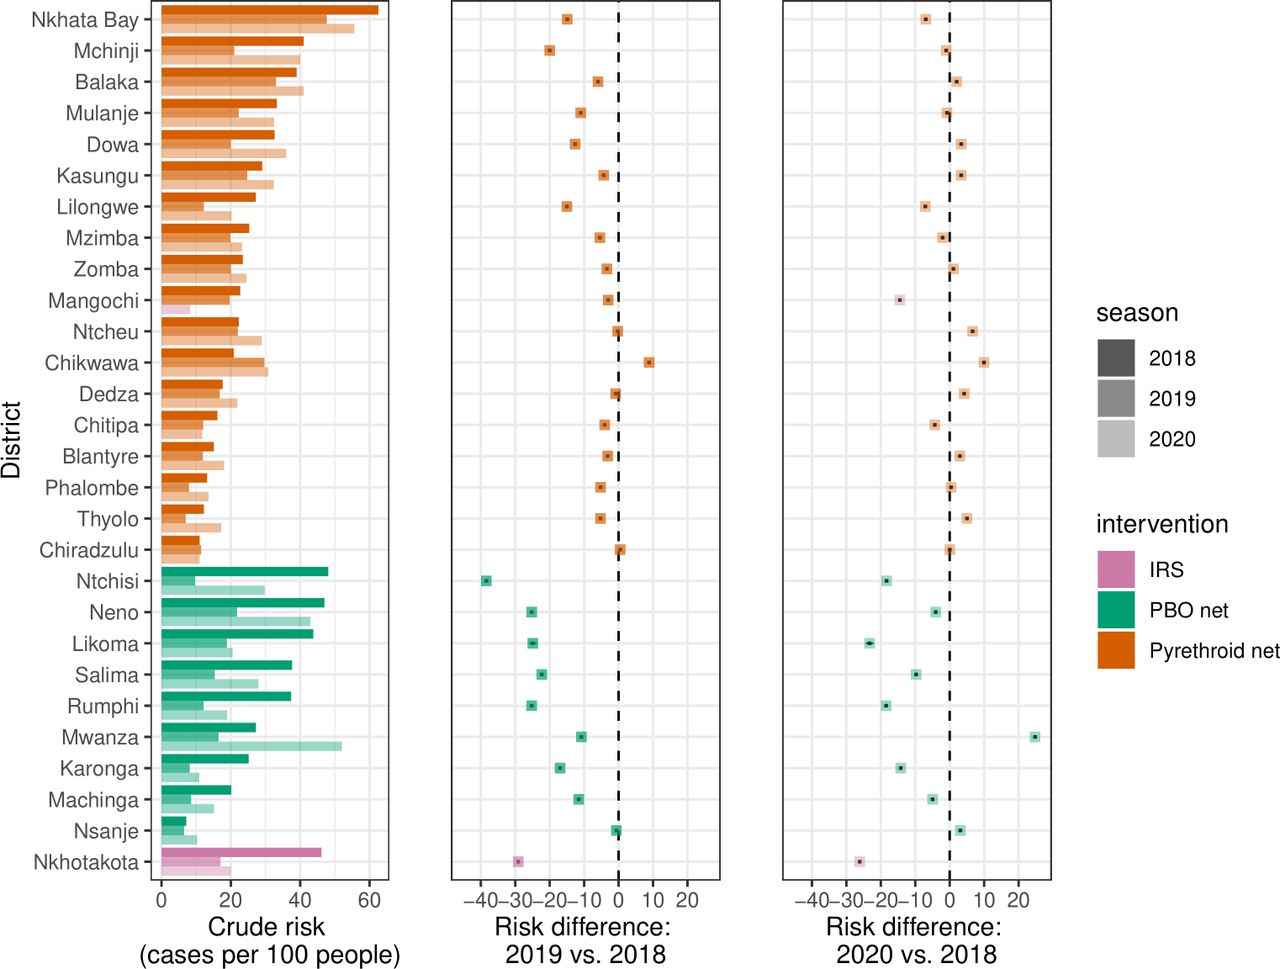
Risk of malaria (cases per 100 people) and risk differences from 2018 to 2019 and 2020, stratified by district and type of intervention. Data are shown for months falling within the high malaria transmission season (January to May), and estimates represent 5-month risks. Risk difference point values and 95% CIs are shown by black dots and lines underlying each coloured point, although CIs are not readily visible because of the narrow range. Mchinji’s net distribution was comprised of 69.4% pyrethroid-treated nets and 30.6% PBO-treated nets. IRS, indoor residual spraying; PBO, piperonyl butoxide.
Risk followed a similar pattern of decline and rebound when stratified by LLIN type. Administration of PBO-treated nets resulted in 5-month RDs of −17.4 and −6.2 comparing 2019 and 2020–2018 high transmission seasons, whereas RDs in areas with pyrethroid-treated nets were −6.3 and 1.9, respectively. Use of annual IRS sustained protection, with an RD of −29.1 cases per 100 people comparing 2019 and 2018 high transmission seasons and an RD of −26.1 comparing 2020 and 2018. In Mangochi, pyrethroid-treated nets somewhat reduced risk in 2019 (RD: −3.2), but IRS spraying in 2019 dramatically reduced risk in 2020 (RD: −14.6). IRS and PBO-treated nets moderately reduced risks during the 2019 low transmission season (RD: −9.6 to –9.1) relative to 2018, but there was minimal change in areas receiving pyrethroid-treated nets (RD: −1.3).
Implementation of IRS, PBO and pyrethroid-treated nets resulted in varying effects by district (Figure 4, online supplemental figure 3). Ntchisi, receiving PBO-treated nets, underwent the greatest reduction in risk of −38.4 cases per 100 people comparing 5-month high transmission seasons in 2019 and 2018 (online supplemental table 4). Overall, 12 of the 28 districts (42.9%) experienced increases in malaria risk between 2018 and 2020 high transmission seasons. Nkhotakota, receiving annual IRS, experienced the greatest reduction in risk (−26.1) between 2018 and 2020 high transmission seasons.
After adjusting for baseline 2018 malaria risk and LLIN coverage in quasi-Poisson models, we estimate that if all districts had received pyrethroid-treated nets, 5-month malaria risk would have been 5.1 cases per 100 people (95% CI 4.8 to 5.3) in 2019 and 7.1 (95% CI 6.8 to 7.4) in 2020 high transmission seasons. If all districts had received PBO-treated nets, malaria risk would have been lower in both years at 2.8 (95% CI 2.5 to 3.1) and 5.6 (95% CI 5.2 to 6.0). If all districts had received annual IRS, malaria risk in 2019 would have been 3.6 (95% CI 3.1 to 4.1) and 4.3 (95% CI 3.7 to 4.8) in 2020. Had all districts received PBO-treated nets, risk would have been −2.3% lower (95% CI −2.7 to −1.9) in 2019 compared with 2018 high transmission seasons, and −1.5% lower (95% CI −2.0 to −1.0) in 2020 compared with 2018, relative to pyrethroid-treated nets. Had all districts received annual IRS, risk would have been 1.4% lower (95% CI −2.0 to −0.9) in 2019 compared with 2018 high transmission seasons, and 2.8% lower (95% CI −3.5 to −2.2) in 2020, relative to pyrethroid-treated nets.
The 2018 Malawi census recorded 17 563 749 million people19; using our adjusted risk values we estimate that relative to national roll-out of pyrethroid-treated nets, national distribution of PBO-treated nets in 2018 would have averted 665 522 (95% CI 505 858 to 825 185) confirmed cases and application of annual IRS would have averted 752 771 (95% CI 532 559 to 972 983) cases over the 2019 and 2020 high transmission seasons.
Discussion
Over 30 months, 1-month risk of malaria was highest from January to May and among children <5 years of age, but varied locally, indicating that aggregate measures across large geographic areas can obscure local disease variation. Malawi experienced declining national 1-month risk in 2019 and subsequent rebound in 2020, however, patterns varied by district and intervention type. In 2020, 12 of 28 districts (42.9%) experienced increases in malaria risk, suggesting that protective effects disappear 1–2 years after LLIN distribution. PBO-treated nets performed better than pyrethroid-treated nets in adjusted analyses. Annual IRS application sustained decreased malaria risk over two transmission seasons, and a single IRS application in 2019 reduced malaria risk in a district where pyrethroid-treated nets had no effect. Our findings suggest that national roll-out of PBO-treated LLINs or annual IRS would have the potential to avert hundreds of thousands of cases relative to pyrethroid-treated nets. Policy and programmatic decisions have the potential to substantially alter Malawi’s malaria burden.
Longitudinal analysis demonstrates a reduction in malaria risk following mass LLIN distribution among our study population, but a subsequent re-bounding of disease suggests that LLINs do not universally retain effectiveness through two high transmission seasons. Prior research in Malawi has depicted increased malaria prevalence among children 2 years after mass distribution of 5.6 million nets.16 Individual ITN use was associated with a lower individual risk of malaria at baseline, but this association disappeared within 2 years. Similarly, research among adolescents and adults has shown that sleeping under an LLIN was not associated with reduced risk of malaria prevalence 3–4 years after a mass distribution campaign, even after stratifying by bed net insecticide type,25 perhaps due to LLIN damage and repurposing. Risk of malaria was heterogeneous at the health facility level, with wide variations depending on geographic location and month, aligning with estimated differences at the subdistrict level.2 3 Fine-scale longitudinal mapping of malaria risk allows for local monitoring and evaluation, including targeting of resources to small areas during periods of high transmission.
Potential sources of a short LLIN lifespan include repurposing, damage, and insecticide-resistance, and attenuation of insecticide concentration.26–28 Mosquito collection studies in Malawi show increasing insecticide-resistance over time to pyrethroid-treated nets,26 but retention of efficacy with added PBO, similar to our study findings. An estimated 50% of ITNs are lost from households in sub-Saharan Africa after 23 months, another likely contributor to reduced intervention effects over time.27 In Malawi, individuals repurpose ITNS for fishing and farming, and sell nets to support their families encountering poverty and food-insecurity,28 all of which contribute to reduced intervention effectiveness.
The frequency of LLIN distribution also influences effectiveness. The WHO recommends mass distribution campaigns every 3 years, allocating one LLIN for every 1.8 people.11 However, evidence from field research in Eastern and Southern Africa questions this recommendation, consistently finding that malaria incidence rebounds 1–3 years following ITN or LLIN distribution.12–15 17 Qualitative studies are necessary to discover local reasons for LLIN effectiveness variation. Sites in Madagascar followed similar disease trends as our study, experiencing rebounding malaria 2–3 years following a mass distribution campaign; however, malaria incrementally declined in areas receiving additional continuous LLIN distribution to households including young children, immigrants, pregnancy women and recently married couples.29 Malawi distributes nets continuously to pregnant women and newborns, but the protection provided by mass LLIN campaigns could be potentially sustained through introduction of additional distribution channels such as HIV clinics or expanded inclusion criteria to immigrants and outdoor workers.
Our study represents one of the largest published analyses of LLIN effectiveness over time, capturing records from 711 health facilities over a 30-month period and representing the most granular national estimates published to-date. Data were reported at a near capacity rate each month, with 98% completeness in 2018 and 96% in 2019. Approximately 98% of all suspected cases were confirmed nationally in 2018, indicating high testing coverage of individuals presenting for care.9 Use of routinely collected DHIS2 data represents an efficient use of resources to study the effectiveness of Malawi’s most comprehensive malaria prevention intervention.
The main limitations of our analysis stem from missing data; we excluded facilities lacking spatial coordinates and missing 2018 data, biasing risk estimates downward. However, many of the excluded health facilities were small, and our analysis still captured 97.1% of confirmed DHIS2 malaria cases and 99.7% of facilities reported data for at least 24 months during the study period. We are also missing malaria cases who do not report to a clinic; a potentially substantial population as only 54% of children <5 years with fever sought advice or treatment in 2017,30 leading to conservative risk estimates of the underlying burden of symptomatic disease. Our Thiessen polygons were built using Euclidean distance, assuming that individuals attend the nearest health facility and that everyone in the catchment area accesses the facility with equal probability. Facility size and quality of care also likely influences health seeking behaviour, and referral hospitals may double count cases already recorded at smaller clinics. We updated projected WorldPop rasters using 2018 census data; while this provides more accurate population estimates, modelled population values are imperfect. We were not able to examine synergistic effects of IRS and LLINs, but future analyses will compare various intervention combinations as Malawi expands annual IRS coverage. Additional influences on malaria counts include environmental factors, potential under-reporting in April to June 2020 due to the COVID-19 pandemic and introduction of limited RTS,S malaria vaccine roll-out to children in April 2019 which could have lowered risk among those <5 years in select areas. Although PBO-treated nets and IRS dramatically reduced malaria case counts among our population, novel interventions and case management strategies are necessary to move Malawi closer to malaria elimination.
Conclusion
Our study design can serve as a model for other countries collecting health metrics through DHIS2. Use of a routine surveillance system provides a natural opportunity to study disease trends over time and create quasi-experimental designs to measure interventions on a large scale without the cost and limited scope of primary data collection. Assessment of malaria risk provides valuable insight into current and historical case trends as the Ministry of Health plans future mass distribution campaigns. Decisions regarding type of insecticide, frequency of net distribution and order of priority for various geographical areas have the potential to substantially alter the malaria landscape in Malawi, averting morbidity, mortality and a strain on health system resources for diagnosis and treatment.
Data availability statement
All relevant data are within the manuscript and supplement. DHIS2 data that support study findings are available from the authors with written permission from the Malawi Ministry of Health.
Ethics statements
Ethics approval
Ethical approval was obtained from Institutional Review Boards through the National Health Sciences Research Committee at the Malawi Ministry of Health (#19/08/2381) and the University of North Carolina at Chapel Hill (#19-2882).
Acknowledgments
We thank Steve Meshnick for conceptualisation of the project, devotion to malaria research in Malawi, and years of steadfast mentorship. We thank the National Malaria Control Programme at the Malawi Ministry of Health for coordination and use of DHIS2 data and bed net mass distribution campaign information.
References
Supplementary materials
Supplementary Data
This web only file has been produced by the BMJ Publishing Group from an electronic file supplied by the author(s) and has not been edited for content.
Footnotes
Handling editor Senjuti Saha
Twitter @HTopazian
HMT and AG contributed equally.
JJJ and IH contributed equally.
Contributors HMT, AG, JJJ and IH contributed to study conception and design. AG, KB, MK and TM contributed to data acquisition and HMT and AG have verified the underlying data. HMT performed the data analysis and AG, JKE, KB, VG, ME, AEP, JSS, JJJ and IH were involved in methodology decisions and data interpretation. HMT drafted the manuscript. All authors provided revisions and approval for submission.
Funding This work was supported by the UNC Institute for Global Health and Infectious Disease’s Explorations in Global Health grant, The UNC Gillings School of Global Public Health, The UNC Graduate School, a Yang Biomedical Scholars Award from the UNC School of Medicine and NIAID (K24AI134990).
Map disclaimer The depiction of boundaries on the map(s) in this article does not imply the expression of any opinion whatsoever on the part of BMJ (or any member of its group) concerning the legal status of any country, territory, jurisdiction or area or of its authorities. The map(s) are provided without any warranty of any kind, either express or implied.
Competing interests None declared.
Provenance and peer review Not commissioned; externally peer reviewed.
Supplemental material This content has been supplied by the author(s). It has not been vetted by BMJ Publishing Group Limited (BMJ) and may not have been peer-reviewed. Any opinions or recommendations discussed are solely those of the author(s) and are not endorsed by BMJ. BMJ disclaims all liability and responsibility arising from any reliance placed on the content. Where the content includes any translated material, BMJ does not warrant the accuracy and reliability of the translations (including but not limited to local regulations, clinical guidelines, terminology, drug names and drug dosages), and is not responsible for any error and/or omissions arising from translation and adaptation or otherwise.