Article Text

Abstract
Introduction Children’s growth status is an important measure commonly used as a proxy indicator of advancements in a country’s health, human capital and economic development. We aimed to assess the feasibility of using Super-Imposition by Translation And Rotation (SITAR) models for summarising population-based cross-sectional height-by-age data of children under 5 years across 64 countries.
Methods Using 145 publicly available Demographic and Health Surveys of children under 5 years across 64 low-income and middle-income countries from 2000 to 2018, we created a multicountry pseudo-longitudinal dataset of children’s heights.
Results SITAR models including two parameters (size and intensity) explained 81% of the between-survey variation in mean boys’ height and 80% in mean girls’ height. Size parameters for boys and girls (relative to the WHO child growth standards) were distributed non-normally around a mean of −5.2 cm for boys (range: −7.9 cm to −1.6 cm) and −4.9 cm for girls (range: −7.7 cm to −1.2 cm). Boys exhibited 10% slower linear growth compared with the WHO (range: 19.7% slower to 1.6% faster) and girls 11% slower linear growth compared with the WHO (range: 21.4% slower to 1.0% faster). Variation in the SITAR size parameter was ≥90% explained by the combination of average length within the first 60 days of birth (as a proxy for fetal growth) and intensity, regardless of sex, with much greater contribution by postnatal intensity (r≥0.89 between size and intensity).
Conclusions SITAR models with two random effects can be used to model child linear growth using multicountry pseudo-longitudinal data, and thereby provide a feasible alternative approach to summarising early childhood height trajectories based on survey data. The SITAR intensity parameter may be a novel indicator for specifically tracking progress in the determinants of postnatal growth in low-income and middle-income countries.
- child health
- epidemiology
- public health
- stunting
- other study design
This is an open access article distributed in accordance with the Creative Commons Attribution Non Commercial (CC BY-NC 4.0) license, which permits others to distribute, remix, adapt, build upon this work non-commercially, and license their derivative works on different terms, provided the original work is properly cited, appropriate credit is given, any changes made indicated, and the use is non-commercial. See: http://creativecommons.org/licenses/by-nc/4.0/.
Statistics from Altmetric.com
Key questions
What is already known?
Child height is widely used as an indicator of health, human capital and economic development.
Country progress towards achieving the Sustainable Development Goals and WHO global targets is conventionally demonstrated by analysing secular trends in stunting and/or, less frequently, using mean height/length-for-age z-scores (HAZ/LAZ) over time.
What are the new findings?
Super-Imposition by Translation And Rotation (SITAR) can be applied to modelling child linear growth using cross-sectional data from multicountry Demographic and Health Surveys, providing a feasible alternative approach to summarising linear growth trajectories using cross-sectional data.
SITAR parameters are strongly correlated with stunting and mean height-for-age.
Postnatal size is explained by the combination of average starting length within the first 60 days of birth (proxy for fetal growth) and postnatal growth intensity.
What do the new findings imply?
The SITAR intensity parameter may be a novel and informative indicator for specifically tracking progress in the determinants of postnatal growth in low-income and middle-income countries.
Further research should be conducted on the usefulness of the SITAR intensity for describing variations in postnatal growth between countries as well as within countries over time.
Introduction
The remarkable increases in average height of adults across all countries in the last century1 2 have been mainly attributed to improvements in nutrition, health and living conditions.2 These increases have been also notable in fundamental secular changes in the pattern of child and adolescent growth.3–5 Children are growing taller than previous cohorts, experiencing earlier pubertal growth spurt (and earlier general maturation) as well as faster rates of growth, especially in high-income countries.6 Understanding how and why child growth patterns have changed is necessary for characterising global health inequalities as well as predicting future secular changes in population height.7
Child height is widely used as an indicator of health, human capital and economic development.1–3 The most commonly used population indicator based on child height is the under-5 stunting prevalence (stunting), defined as the proportion of all children between the ages of 0 and 5 years whose height-for-age is more than 2 SD below the median of the WHO child growth standards for age and sex.8 Reducing the prevalence of child stunting is a global public health priority that is embedded within the Sustainable Development Goals (SDGs)9 and the WHO global targets for 2025, which include a 40% reduction in the number of stunted children under 5 years.10
Country progress towards achieving SDGs and WHO global targets is conventionally demonstrated by analysing secular trends in stunting and/or, less frequently, using mean length/height-for-age z-scores (LAZ/HAZ) over time.1 6 11 12 Most low/middle-income countries (LMICs) have high stunting prevalences as well as low mean LAZ/HAZ,11 13 14 indicating nearly all children in these populations are, on average, attaining a suboptimal size for age and sex relative to healthy children growing in optimal conditions.13 Using 179 Demographic and Health Survey (DHS) datasets from 64 LMICs (1993–2015), we previously showed that linear growth faltering is a whole-population phenomenon characterised by downward shifts in the entire population HAZ distribution rather than deviations limited to a small, high-risk subgroup, as may be implied by the binary stunting indicator.13 Stunting is a population-level statistical indicator of children’s social and economic deprivation and does not equate to malnutrition as commonly used in nutritional and epidemiological studies of child health and public health programmes.15–18 In addition, binary indicators, such as stunting, are more likely to be affected by the quality of anthropometric measurements which can vary within and between surveys.19 20
We hypothesise that Super-Imposition by Translation And Rotation (SITAR) random parameters convey between-country variations in linear growth in more detail than what is captured by conventional cross-sectional indicators such as under-5 stunting prevalence. Height-derived indicators that capture the whole population distribution have potential advantages over indicators that identify a subgroup of affected or at-risk children, by characterising more nuanced variations in age-related linear growth trajectories.
Our goal was to apply the SITAR models to summarise and compare population-level child height data across a sample of LMICs. The SITAR modelling approach for growth data has been demonstrated to efficiently summarise growth trajectories relative to an underlying population-average height-by-age growth curve and three child-specific random effects that reflect between-child variations in absolute size (average vertical displacement of a child’s growth curve relative to the population mean), intensity (a scaling factor applied to the age scale, that reflects relative expansion or contraction of the time period of growth), and timing of growth (average lateral shift in the child’s growth curve on the age axis).21 An advantage of SITAR growth curve analysis is that these estimated random parameters are easily interpretable, in the original units of the modelled parameter (eg, size parameter is expressed in centimetres), and estimates are specific values along a continuous scale that can be used in further analyses of child linear growth such as exploring their associations with exposures or outcomes.22–24 Furthermore, the intensity parameter reflects a uniquely postnatal pattern, in contrast to the majority of child growth indicators that are expressions of attained size, which reflect both fetal and postnatal growth. SITAR models have been recently used to describe population-average trajectories using country cross-sectional data in Japan and South Korea,7 25 but the model has not been applied to multicountry survey data such as the DHS from LMICs.
The goal of this study was to demonstrate the application of SITAR to derive alternative metrics for summarising population-level child height data across a sample of cross-sectional surveys from LMICs.
Methods
Data source
We used publicly available DHS anthropometric data (length/height, age and sex) for children under 5 years across 145 surveys from 64 countries conducted between 2000 and 2018.26 All available DHS surveys for the study period were accessed through the DHS programme online repository.26 As described in detail elsewhere,27 28 children under 2 years were measured in supine position (recumbent length), whereas children between 2 and 5 years were measured standing up (height). We used DHS surveys conducted since 2000 because that is when the DHS programme employed a standardised questionnaire and a unified anthropometry data collection process across all surveys and all children in the sampled households were surveyed. The DHS data are the largest nationally representative data available for many LMICs as they cover all administrative divisions and districts within countries. The DHS are usually conducted every 3–5 years per country, with the exception of a few countries that implement continuous DHS, with annual data collection. The DHS surveys are cross-sectional studies that follow a two-stage stratified random sampling of enumeration areas (first stage) and households (second stage). All DHS samples are representative at least at national and regional levels in all included countries.
Statistical methodology
Many child growth models assume parametric non-linear functions (usually exponential) which often fit data poorly, especially during the first year of life.29–31 In 2007, Beath32 introduced a considerable simplification to the analysis of growth curves by applying previously proposed shape invariant models (SIMs)33 to describe infant weight trajectories from birth to 2 years of age. SIMs fit a single function to a trajectory, and transform it, by shifting and scaling, to improve its fit to each subject. This results in a single growth curve which can be applied to all subjects using three subject-specific translation and rotation paramaters of the population-average curve to fit individual growth curves. This model was later named by Cole et al 21 as the SITAR model.
A key assumption of SITAR is that height trajectories assume a common shape when developmental age is used as the time scale. In contrast to chronological age (time since birth), developmental age is based on markers of a child’s growth and development to convey the extent of biological maturation from conception to their current status. A single population mean curve is fitted as a cubic spline function with all individuals assumed to have the same underlying shape of the growth curve subject to three simple transformations estimated as subject-specific random effects that represent deviations from the population mean curve.21 In the present study, we considered the primary unit of analysis to be the survey, for which data (mean height) were available at multiple age intervals between ages 0 and 5 years, and we compared curves derived from individual surveys to the WHO child growth standards. Applying SITAR, an individual survey-specific growth curve has a relationship with the global mean curve that is estimated by its deviation up or down from the mean curve (differences in mean size represented by the random intercept on the height scale) and left or right (differences in growth timing represented by the random intercept on the chronological age scale), and by shrinking or stretching the curve on the age scale to indicate how fast average growth is in the survey setting (differences in growth rate represented by the random slope of growth rate using the chronological age scale). Size is expressed in units of the measurement (cm), timing in units of age (months) and intensity as a fraction or percentage of the mean growth rate. The SITAR growth model is defined by the following equation:
Length/heightit=αi+h[exp(γi)×(t−βi)]+ϵit Equation 1
where length/heightit is the measurement for subject i at age t; h(.) is a natural cubic B-spline function in transformed age defining the mean spline curve chosen to minimise the Bayesian Information Criterion (BIC); αi, βi and γi are survey-specific random effects for size, timing and intensity, respectively; and the ϵ it are normally distributed residuals. Fixed effects for αi, βi and γi are also included to ensure the mean random effects are set to zero. Note that γ is exponentiated to provide a multiplier centred on one. For all surveys, trajectories are estimated separately for each sex and for countries with multiple surveys, trajectories were modelled by year as well. The SITAR model fit is based on a non-linear mixed-effect (NLME) model and estimation is by maximum likelihood.34 A best linear unbiased prediction of each of the random effects for each survey (equivalent to subjects in the conventional application of SITAR) was used to obtain survey-specific predicted curves.35
Data analysis
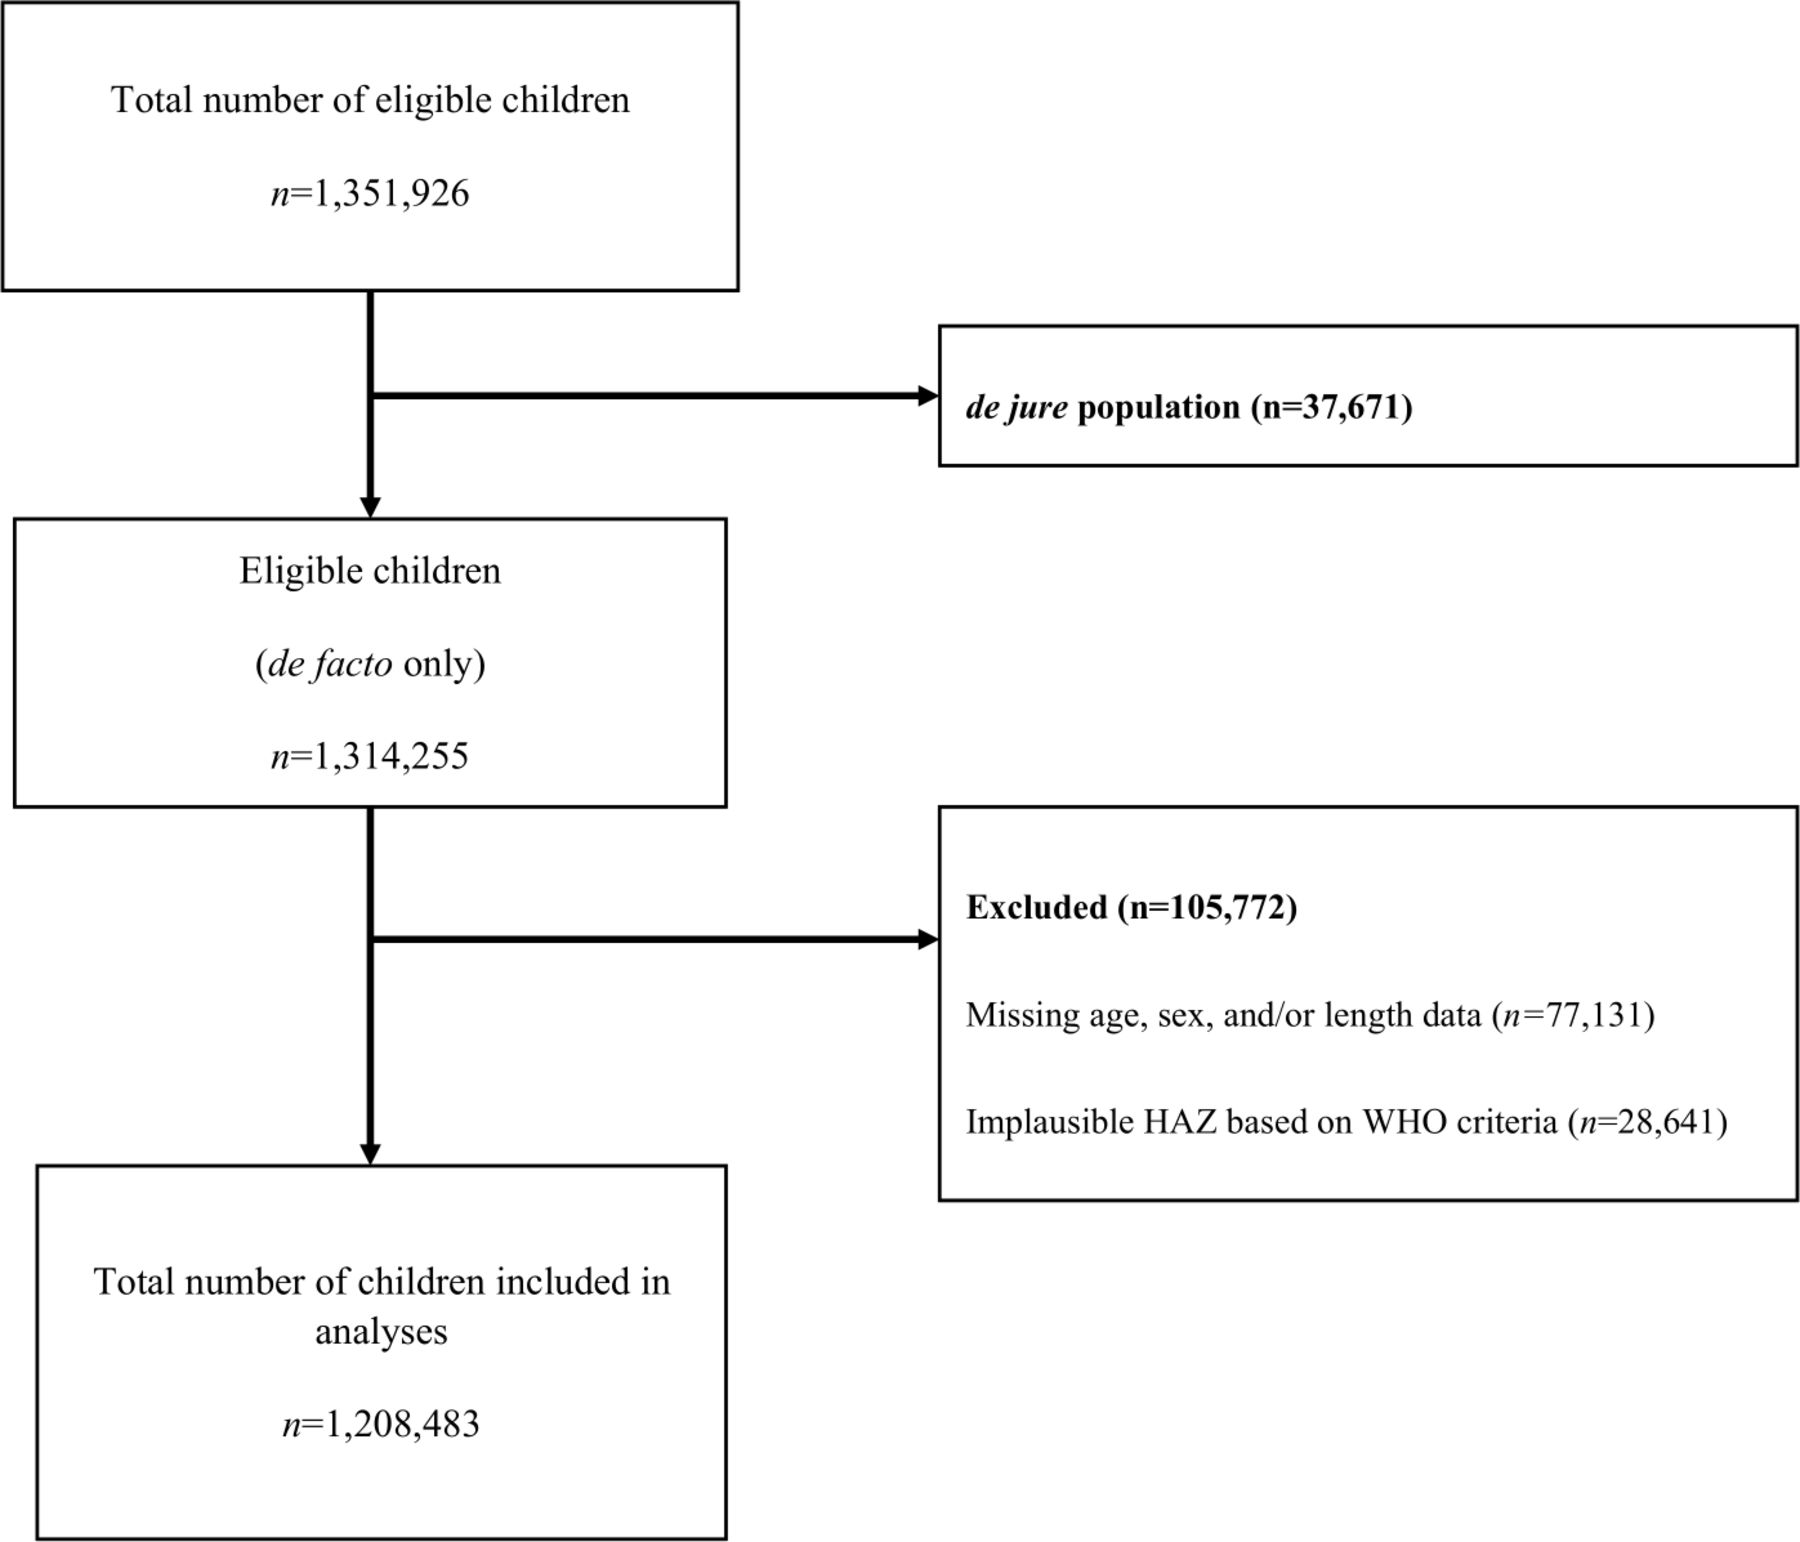
The dataset includes 1 351 926 individual children across the surveys. Of the total number of eligible children 0–59 months of age, 37 671 (2.8%) were excluded as they were not de facto members of the household (ie, had not slept in the household the previous night).36 Age was considered missing if month and/or year of birth was missing. If month and year of birth was only available, the day of birth was imputed as 15. Exclusions due to missing age, sex or height data totalled 77 131 (5.7%) children (figure 1). We then applied the 2006 WHO standard37 macro to the raw DHS height data to derive estimates for HAZ and prevalence of stunting among children 0–59 months of age. Data were excluded if a child’s HAZ was below −6 SD or above +6 SD (most likely a result of errors in measurement or data entry), as recommended by the WHO,38 for a total of 28 641 (2.1%) excluded children, resulting in a sample size of 1 208 483 (89%) children (figure 1). All estimates of mean HAZ and prevalence of stunting were calculated accounting for DHS sample survey weights to make sample data representative of the entire population.

Flow chart for 145 Demographic and Health surveys from 64 countries between 2000 and 2018. de facto children refer to members of the household 0 to 59 months of age who slept in the household the previous night whereas de jure refer to members of the household 0 to 59 months of age who did not sleep in the household the previous night. HAZ, height-for-age z-scores.
A pseudo-longitudinal dataset was created from cross-sectional data by summarising all observations of children’s heights within each survey into a single trajectory from birth to 5 years of age for each sex (and survey year in the case of countries with multiple surveys). To account for sampling variations by age and across surveys and also ensure height measurements increased monotonically with age, individual child-level height data in each DHS were binned in 2-month child age intervals and a mean height was obtained for each interval. Each country, survey year and sex was thus represented by 30 interval-specific mean heights. For 41 countries, more than one survey was available. For example, we included six surveys from Peru (in survey years 2005, 2007, 2008, 2009, 2010 and 2012), thereby generating six growth trajectories (ie, curves) for boys and six trajectories for girls.
To enable expression of survey-specific parameters relative to the WHO child growth standards rather than the empirical sample mean (of all 145 surveys), we included the mean height for boys and girls according to the WHO child growth standards for ages 0–5 years8 as one of the surveys (total n=146 surveys). The mean heights of WHO child growth standards included were estimated for the same 30 intervals used for the DHS. The SITAR growth models were then applied to the dataset comprised of 4380 height data points for boys and 4380 for girls (ie, 30 data points across 146 ‘surveys' for each sex) to estimate the SITAR parameters for the WHO reference data along with those from 145 DHS data. Separate models were fit for boys and girls.39 We re-parameterised the SITAR random effects in relation to the WHO reference by subtracting the WHO SITAR random effects from the random effects of each of the 145 DHS (online supplemental file 1).
Supplemental material
We experienced convergence issues for some models and in such instances we applied commonly recommended transformation approaches such as log transformation of either height, age or both, and also explored dropping one of the random effects.25 40 In addition, the SITAR models were optimised by choosing the df for the cubic B-spline curve to minimise the BIC.41 SITAR model convergence was not achieved for the full model with three random effects. The timing parameter was dropped because it showed the least variability across the surveys leading to a simplified SITAR model given by:
Length/heightit=αi + h[exp(γi)×t]+ϵit. Equation 2
where length/heightit is the measurement for subject i at age t; h(.) is a natural cubic B-spline function in transformed age defining the mean spline curve; and αi and γi are survey-specific random effects for size and intensity, respectively, and the ϵ it are normally distributed residuals. The difference between equation 2 of SITAR and the more conventional mixed-effects model, the random-intercept-random-slope (RIRS) model, is that SITAR applies the scale factor to the age axis whereas RIRS scales the height axis.
Models were evaluated by comparing the BIC of different models. We quantified the percentage variance in height that was explained by each SITAR model using:
% variance in height explained=100×(1−(σ2/σ1)2) where σ1 is the fixed-effects residual SD (RSD) and σ2 the SITAR random-effects RSD, that is, the SD of the spread of the data points around the fitted curve.42
The BIC penalises the deviance by loge(n) units for each additional df where n is the sample size. Better models have a lower BIC value. Height was modelled in the original scale (centimetres) whereas age in months was log transformed for all models. We used the dfset command available in the sitar package in R43 to determine the appropriate number of df (knots) for a natural spline curve that minimised the BIC for our fitted models. All models were fit with 4 df.
Having obtained the SITAR-fitted random effects for each survey-year and sex, we correlated the two SITAR parameters with each other, and also with stunting prevalence and mean HAZ. As age was aggregated in 2-month child age intervals, the earliest aggregated mean length was within the first 60 days of birth and therefore used as a proxy for ‘starting size’ (reflecting fetal growth). To partition postnatal size into its components of ‘starting size’ (reflecting fetal growth) and postnatal velocity, we performed correlation analyses of the SITAR size and intensity parameters with mean length within the first 60 days of birth. We then estimated a multiple linear regression model with SITAR size parameter as the outcome and both intensity and average length within the first 60 days of birth as covariates.
Since 41 countries contribute more than one trajectory, we performed sensitivity analyses by repeating the analysis using only the most recent survey from each country. Additional subgroup analyses were performed by fitting SITAR models to DHS data classified according to World Bank regions.44
The models were fit in statistical software R using the nlme package,34 Tim Cole’s sitar package43 (https://rdrr.io/cran/sitar/) and STATA V.15 (College Station, Texas, USA). The R-code used to perform all the analyses is provided in online supplemental file 2.
Supplemental material
Patient and public involvement
Our study does not involve the participation of patients or any members of the public. All data used in this study are aggregated and publicly available DHS anthropometric data and can be accessed through the DHS programme online repository.26
Results
The weighted median sample size, median age in months and percentage of boys for each of the six world regions are summarised in table 1. Most surveys were from the sub-Saharan Africa region followed by Latin America and the Carribean, Europe and Central Asia, South Asia, North Africa and the Middle East (table 1). The median number of children per survey was 5473 (~90 children in each month); 82% included between 1000 and 10 000 children, and the median age was 29.6 months (IQR: 14.6–44.4 months) (online supplemental file 3).
Summary of Demographic and Health Surveys disaggregated by world region (n=145 overall)
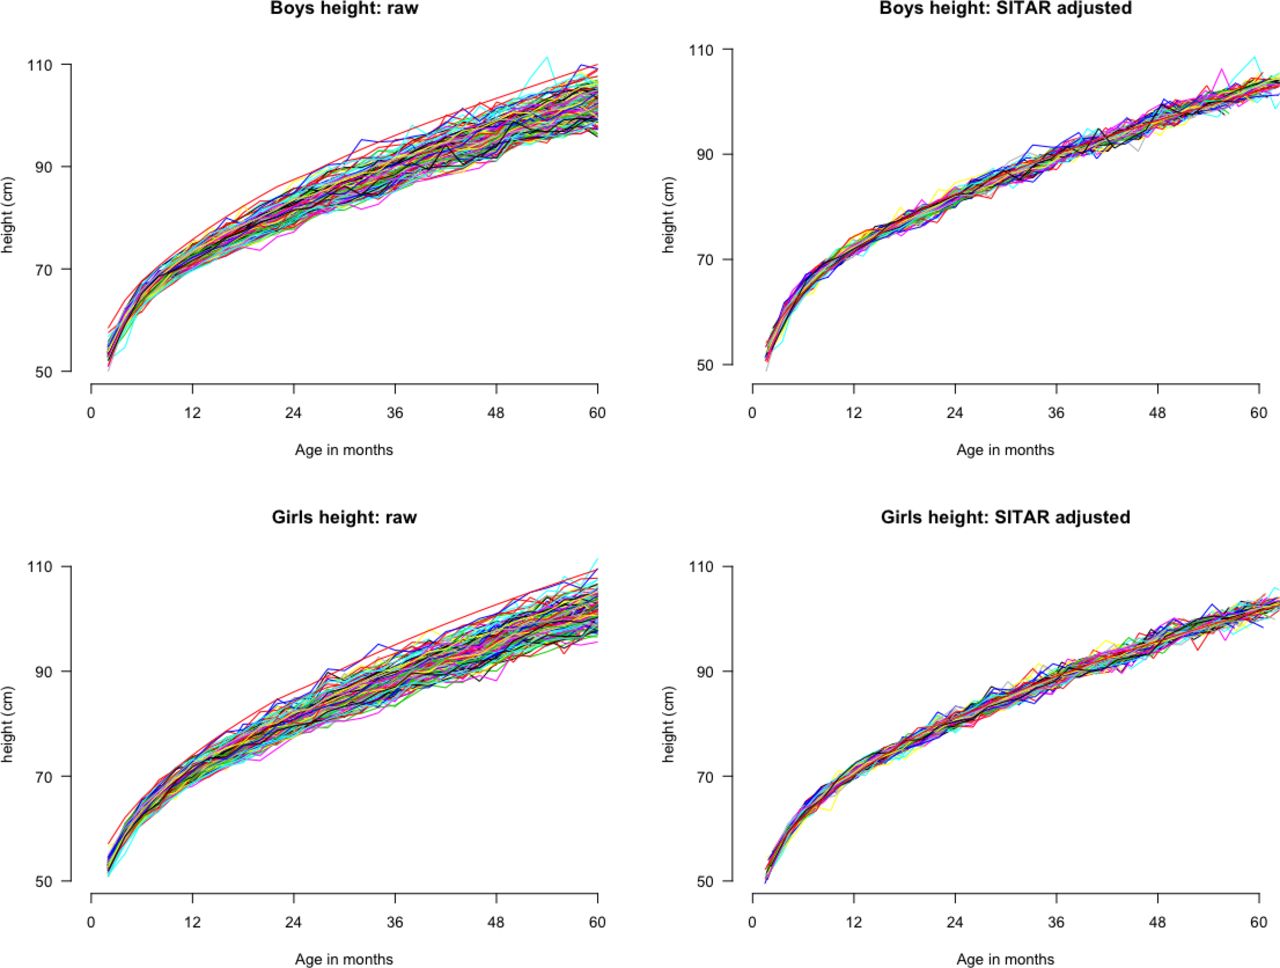
Of the models that achieved convergence, those containing two random effects (size and intensity) fit best based on the BIC (table 2). The final selected models (table 3) explained 81% and 80% of the between-survey variation in mean height for boys and girls, respectively (table 2; Figures 2 and 3). Two example surveys and the WHO child height standards were used to illustrate that the modelled trajectories closely fit the observed data (online supplemental file 4). As expected, there were negligible differences in size (maximum difference was <0.05 cm for girls and boys) and intensity (maximum difference was <0.2% for boys and girls) between the random effects generated with and without inclusion of the WHO data in the multicountry dataset (online supplemental files 5 and 6).
Comparison of SITAR models applied to Demographic and Health Survey data from 145 surveys (64 countries) from 2000 to 2018
Best-fitting SITAR models for boys and girls applied to Demographic and Health Survey mean height data from 145 surveys (64 countries) from 2000 to 2018

Mean height trajectories for boys (top panels) and girls (bottom panels) before (left panels) and after (right panels) adjustment using SITAR size and intensity parameters, for 145 Demographic and Health Surveys from 64 countries. SITAR, Super-Imposition by Translation And Rotation.

An illustration of the SITAR transformation of a crude height trajectory for a given survey to the population-level average modelled trajectory shown using height trajectory for boys in Malawi in the 2004 survey before SITAR adjustment (solid green line, left panel) and after SITAR adjustment (dotted green line, left panel); Egypt 2014 survey for boys, before SITAR adjustment (solid green line, right panel) and after SITAR adjustment (dotted green line, right panel). The fitted SITAR population-mean curve is shown by solid black line in both plots. SITAR, Super-Imposition by Translation And Rotation.
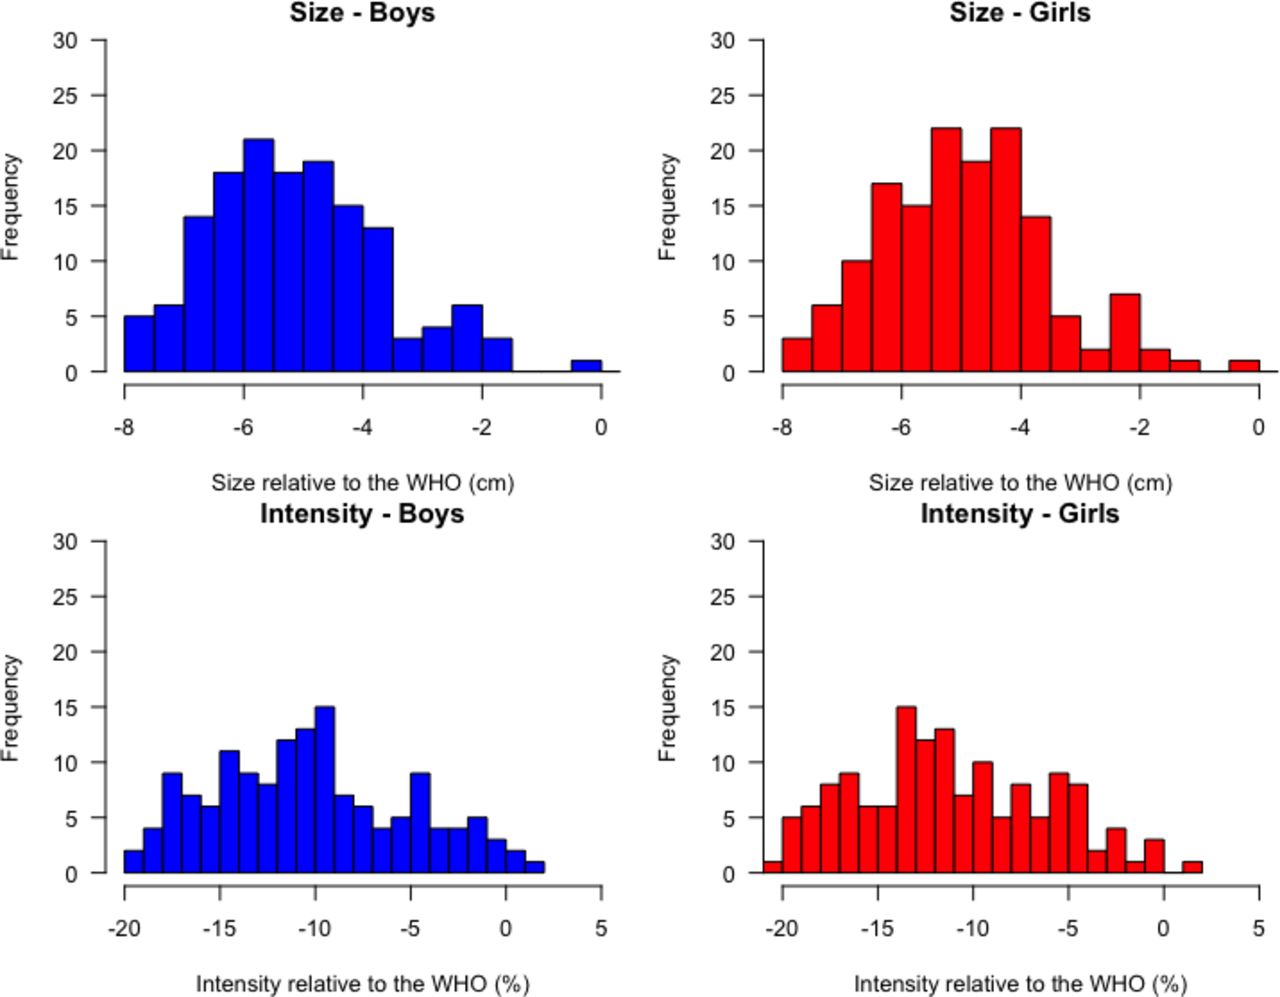
Fitted growth trajectories for boys and girls were below the WHO child growth standards for all surveys (figure 4). Sex-specific height-by-age and velocity-by-age curves were similarly shaped although boys were, as expected, taller at every age (figure 4). Size parameters for boys (relative to the WHO growth reference) were distributed non-normally with a mean of −5.2 cm (shorter) compared with the reference (figure 5), and ranging from −7.9 cm (Niger 2006) to −1.6 cm (Armenia 2016). Girls were, on average, −4.9 cm below the WHO reference median (figure 5), ranging from −7.7 cm (Nepal 2001) to −1.2 cm (Armenia 2016). Across all surveys, boys’ intensity parameter was 10% below the WHO intensity reference, ranging from 19.7% below (Niger 2006) to 1.6% above the reference (Armenia 2016). Similarly, girls exhibited 11% lower intensity, on average, compared with the WHO reference (figure 5), with cross-survey values ranging from 21.4% below (Ethiopia 2000) to 1.0% above the reference (Armenia 2016).

Smoothed-fitted height curves for each survey for boys (grey, top-left panel) and the median WHO boys height trajectory (solid blue line, top-left panel); girls (grey, top-right panel) and the median WHO girls height trajectory (solid red line, top-right panel). The bottom-left panel shows a comparison of the fitted mean population height-by-age curve for boys (blue) and girls (red), and the bottom-right panel shows the corresponding height velocity-by-age curve for boys (blue) and girls (red).
Distribution of SITAR size (top panel) and intensity (bottom panel) parameters for boys (blue) and girls (red) in 145 Demographic and Health Surveys from 64 countries. SITAR, Super-Imposition by Translation And Rotation.
Size and intensity parameters were highly correlated (r=0.91 for boys; r=0.89 for girls) (online supplemental file 7), such that intensity explained ~80% of the variability in size for boys and girls. The mean HAZ was perfectly correlated with the SITAR size parameter (r=1) for boys and girls. Prevalence of stunting was highly correlated with the SITAR size parameter (r=−0.96 for boys and r=−0.97 for girls). The correlation of stunting with SITAR intensity parameter was also strong (r=−0.91 for boys; r=−0.90 for girls) and the mean HAZ was highly correlated with the SITAR intensity (r=0.89 for girls and r=0.91 for boys) (online supplemental files 8 and 9).
Results of the sensitivity analyses to evaluate the impact of varying number of surveys between countries (145 surveys compared with 64 latest surveys) were remarkably similar to the main findings despite the more than 50% reduction in the number of surveys (online supplemental file 10). The subgroup analyses of fitted SITAR models to DHS data according to World Bank regions showed the percentage variability in mean height ranged between 70%–84% in boys and 69%–82% in girls. Model convergence was not achieved for two regions (East Asia and Pacific and Europe and Central Asia) which had the least number of countries, that is, ≤10 countries (online supplemental file 11).
The correlation of the size parameter with average length within the first 60 days of birth was moderate (r=0.41 for boys and r=0.43 for girls), but the correlation of intensity with average length within the first 60 days of birth was low (r=0.14 for boys and r=0.16 for girls). The combination of average starting length within the first 60 days of birth and postnatal intensity in both models for boys and girls explained more than 90% of the variability in postnatal size (online supplemental file 12).
Discussion
We have demonstrated that a commonly used statistical method for modelling adolescent growth at individual level (SITAR) can be feasibly applied to describe population-average patterns of early child linear growth across a set of anthropometric survey datasets. The SITAR random effects efficiently summarise country-specific height trajectories for children 0–5 years of age using cross-sectional survey data. The final model, including two random effects (size and intensity) explained over 80% of the between-survey variability in mean height for boys and girls, highlighting a between-country consistency of the shape of the mean postnatal linear growth trajectory despite the surveys being conducted in diverse geographical contexts and over a span of 18 years.13 45 Sensitivity analyses performed using only the most recent survey for each country with much improved data quality revealed minimal differences between the fitted population mean curves, providing confidence in the robustness of our final selected SITAR models.
A subgroup analyses performed separately on each of the six defined World Bank regions showed substantial differences in the amount of variability in mean height (in both boys and girls) that was explained by the fitted SITAR models that converged. The percentage variance in mean height (in both boys and girls) that was explained was lowest in sub-Saharan Africa and South Asia. We do not know the reason for the lowerpercentage variability explained in these two regions but note that (1) sub-Saharan Africa and South Asia have the highest prevalence of stunting and shorter height on average compared with the other regions; and (2) each country dataset includes cohorts of children across 5 different years, such that any acute health shock (eg, humanitarian disaster) affecting one cohort more than others would affect the age-related trajectories and could therefore affect how much variability is explained by the SITAR models; such health shocks are likely more common in sub-Saharan Africa and South Asia than other world regions.
SITAR was originally developed to model individual child or adolescent trajectories using longitudinal data. However, Cole and Mori25 and Schneider and Ogasawara7 have recently demonstrated the application of SITAR to cross-sectional height and weight data by sex between the ages of 1 and 20 years (Cole and Mori), and also for cross-sectional height data among children aged 6–18 years (Schneider and Ogasawara). In both examples, the data have been grouped in 1-year bins for modelling. Here, we extend this application of the SITAR model to population-based cross-sectional surveys of children under-5 years from 64 LMICs with high prevalence of linear growth deficits.11 13 46 Characterisation of the population-average child growth trajectories using the SITAR parameters in our study confirmed that in resource-limited settings, mean population heights and mean growth intensity are below those expected using the WHO child growth reference, and the deficits worsen with age.13 46 Our estimates based on raw length/height-for-age data reveal that the size and growth intensity deficits continue to accrue through to age 5 years, corroborating inferences from studies using height-for-age difference that suggest that linear growth faltering continues past the point at which HAZ trajectories appear to plateau.47 The intensity parameter is a proxy for speed of maturation and consequently, low intensity reflects linear growth faltering.
The main motivation for using SITAR in this context was to identify alternative or complementary metrics for summarising child linear growth and tracking country progress. In contrast to conventional cross-sectional indicators such as under-5 stunting prevalence and mean HAZ, the SITAR parameters are derived by explicitly assuming that there is a linear relationship between chronological age and developmental age and subsequently modelling each component on the proper scale (size on the height scale, and intensity and timing on the age scale), thereby estimating biologically relevant non-linear trajectories for each component. We had hypothesised that these parameters would convey between-country variations in linear growth in more detail than what is captured by traditional cross-sectional aggregated measures, such as under-5 stunting prevalence. However, empirically we found very high correlations between the prevalence of stunting (and mean HAZ) and the size and intensity parameters; in fact, the correlations were nearly perfect for the size parameter. The near perfect correlation between the size parameter and the prevalence of stunting (and mean HAZ) suggests that inequities in size between countries estimated using SITAR are identical to those observed when comparing mean HAZ or stunting prevalences. Since the SITAR size parameter is nearly exchangeable with those indicators, there may be no advantage to estimating SITAR solely to derive the size parameter, particularly given the relative complexity of SITAR modelling. In contrast, the intensity parameter had a somewhat weaker correlation with mean HAZ and stunting prevalence and therefore may provide complementary information. We found that in both boys and girls, more than 90% of the variability in postnatal size represented by the SITAR size parameter was explained by the combination of average length within the first 60 days of birth and postnatal intensity. Most of the variation was attributable to postnatal intensity, which was nearly independent of very early postnatal size (a proxy for fetal growth). Thus, unlike conventional height-derived indicators that are based on attained size alone, SITAR partitions size into two components—fetal growth (captured by size at or near birth) and postnatal growth (represented by the intensity parameter). We have demonstrated that the intensity parameter on its own may serve as a specific measure of the postnatal experience to a much greater extent independent of the prenatal period compared with the size parameter; the size parameter (similar to stunting prevalence and mean HAZ) is a composite of both the prenatal (fetal growth) and postnatal period (infant/child growth) periods.
In the assessment of our primary objective which was to assess the feasibility of using SITAR models for summarising multicountry comparisons of population-based cross-sectional data from 0 to 5 years, we experienced some challenges with SITAR regarding convergence issues for some of the models. The random effect that represents timing did not vary across surveys and convergence was only achieved after excluding this random effect from the model. Notably, this parameter has no clear meaning for the linear growth of children below 5 years of age where peak velocity is not present as a prominent feature within the observation period in contrast with growth during adolescence, where SITAR is more commonly applied. SITAR is a complex non-linear model that may require a combination of variable transformations and model fit optimisation in order to achieve convergence. Convergence was not achieved in all world regions, and the lower variability explained in sub-Saharan Africa and South Asia suggests that perhaps additional parameters are required (eg, a timing parameter). SITAR assumes no measurement error when in fact there is probably differential measurement error across surveys due to differences in data quality across surveys (both across years and across countries), whether children were measured lying down or standing up, difficulty to obtain accurate measurements of length/height of children in the field especially for younger children, and the impact of associated measurement errors in age and height.19 20 Our analyses combined children born at different years to form a cohort and this approach could potentially introduce bias especially if selected cohorts were exposed to health shocks to a greater extent than other children included in the same survey. Furthermore, the current formulation of SITAR does not account for survey design or clustering of observations as the number of surveys differed by country.
In conclusion, we applied SITAR for modelling child height-for-age based on cross-sectional data from multicountry surveys, and demonstrated that SITAR models with two random effects provide a feasible alternative approach to summarising child length/height trajectories for populations based on survey data. Although the estimated SITAR parameters (size and intensity) were strongly correlated with more conventional indicators such as prevalence of stunting and mean HAZ, the SITAR intensity parameter may be a novel indicator for specifically tracking progress in the determinants of postnatal growth in LMICs. Further research will therefore focus on whether the intensity parameter is practically useful for describing variations in postnatal growth between countries as well as within countries over time, that are not fully captured by traditional indicators such as stunting prevalence and mean HAZ.
Acknowledgments
We acknowledge Professor Tim Cole for his help with SITAR-related questions and for his valuable comments on an earlier submission of the manuscript, Dr Anna Heath for useful discussions on the project and R statistical software-related questions, and Dr Liina Mansukoski for reviewing the R script. We would also like to thank Sorrel Namaste at the DHS programme for her help in obtaining the data and provision of insights on DHS data-related questions.
References
Supplementary materials
Supplementary Data
This web only file has been produced by the BMJ Publishing Group from an electronic file supplied by the author(s) and has not been edited for content.
Footnotes
Handling editor Sanni Yaya
Twitter @ohumaeric
Contributors EOO, DER and DGB designed the research. HQ performed data manipulation, cleaning and data curation. EOO conducted the research and analysed the data with input from DER, DGB, HQ and SY. EOO wrote the paper with input from all authors. EOO had primary responsibility for final content. All authors have read and approved the final manuscript.
Funding EO was supported by the Sick Kids Centre for Global Child Health Growth and Development Fellowship.
Map disclaimer The depiction of boundaries on this map does not imply the expression of any opinion whatsoever on the part of BMJ (or any member of its group) concerning the legal status of any country, territory, jurisdiction or area or of its authorities. This map is provided without any warranty of any kind, either express or implied.
Competing interests None declared.
Patient consent for publication Not required.
Ethics approval This work is a secondary analysis of publicly available de-identified data which are exempt from ethical review at the Hospital for Sick Children Ethics Review Board.
Provenance and peer review Not commissioned; externally peer reviewed.
Data availability statement Data are available in a public, open access repository. The data used are DHS and are publicly available at https://dhsprogram.com/data/available-datasets.cfm.
Supplemental material This content has been supplied by the author(s). It has not been vetted by BMJ Publishing Group Limited (BMJ) and may not have been peer-reviewed. Any opinions or recommendations discussed are solely those of the author(s) and are not endorsed by BMJ. BMJ disclaims all liability and responsibility arising from any reliance placed on the content. Where the content includes any translated material, BMJ does not warrant the accuracy and reliability of the translations (including but not limited to local regulations, clinical guidelines, terminology, drug names and drug dosages), and is not responsible for any error and/or omissions arising from translation and adaptation or otherwise.