Article Text

Abstract
Introduction Although health labour migration is a global phenomenon, studies have neglected the flow of health workers into low-income and middle-income countries (LMICs). In compliance with the data-monitoring recommendation of the WHO Global Code of Practice on the International Recruitment of Health Personnel (Code), we estimated post-Code physician net migration (NM) in South Africa (SA), and SA’s net loss of physicians to Organisation for Economic Co-operation and Development (OECD) countries from 2010 to 2014.
Methods We sourced data from the National Reporting Instrument reports, the OECD and the General Medical Council. Using the numbers of foreign nationals and international medical graduates (IMGs) registered in SA, and SA medical graduates registered in OECD countries (South African-trained international medical graduates (SA-IMGs)) as respective proxies for immigration and emigration, we estimated ‘NM’ as the difference between immigrant physicians and emigrant physicians and ‘net loss’ as the difference between OECD-trained IMGs and OECD-based SA-IMGs.
Results In 2010, SA hosted 8443 immigrant physicians, while OECD countries hosted 14 933 SA-IMGs, yielding a NM of −6490 physicians and a NM rate of −18% in SA. By 2014, SA-based immigrant physicians had increased by 4%, while SA-IMGs had decreased by −15%, halving the NM rate to −9%. SA-to-OECD estimated net loss of physicians dropped from −12 739 physicians in 2010 to −10 563 in 2014. IMGs represented 46% of 2010–2014 new registrations in SA, with the UK, Nigeria and the Democratic Republic of the Congo serving as leading sources. Registrants from conflict-scarred Libya increased >100-fold. More than 3400 SA-IMGs exited OECD-based workforces.
Conclusion NM is a better measure of the brain drain than simply the emigration fraction. Strengthened health personnel data management and reporting through implementation of the Code-related system of National Health Workforce Accounts will further increase our understanding of health worker mobility in LMICs, with policymakers empowered to make more informed policies to address shortage.
- Brain drain
- global health
- health worker migration
- in-migration
- international medical graduates
- migrant data monitoring
- net migration
- NRI data
- out-migration
- South Africa
- WHO Code of Practice
This is an open access article distributed in accordance with the Creative Commons Attribution Non Commercial (CC BY-NC 4.0) license, which permits others to distribute, remix, adapt, build upon this work non-commercially, and license their derivative works on different terms, provided the original work is properly cited, appropriate credit is given, any changes made indicated, and the use is non-commercial. See: http://creativecommons.org/licenses/by-nc/4.0/.
Statistics from Altmetric.com
- Brain drain
- global health
- health worker migration
- in-migration
- international medical graduates
- migrant data monitoring
- net migration
- NRI data
- out-migration
- South Africa
- WHO Code of Practice
Key questions
What is already known?
South Africa (SA) is both a source of and a host country for international medical graduates (IMGs) seeking professional opportunities abroad, but the actual numbers involved are difficult to determine owing to data limitation.
What are the new findings?
Estimates of physician net migration in SA fell from −18% in 2010 to −9% in 2014 as a result of a decrease in emigration and an increase in IMG in-migration.
The estimated net loss (or brain drain) of SA’s medical doctors to OECD countries ranged from −14 040 to −10 563 physicians between 2010 and 2014.
The proportion of IMGs among new registrants in SA rose from less than 10% in 2004–2009 to more than 45% in 2010–2014, with Libyan-trained IMGs experiencing the fastest growth with a >100-fold increase in their number.
What do the new findings imply?
The war in Libya has scaled up the movement of Libyan health personnel to SA.
Attention to out-migration flows alone is unsuited for the current dynamism of health labour migration in low-income and middle-income countries.
Introduction
Achieving several of the health-related sustainable development goals (SDGs), especially universal health coverage (SDG target 3.8), will depend to a large extent on the quality and appropriate skill mix, equitable distribution and adequate numbers of health workers, the linchpin of health systems.1 The global shortage of health workers was estimated in 2013 to be 17 million, with four million of these needed in the WHO’s African region—ominous signs many nations are not on track to meet SDG health-related goals.2 In many such low-income and middle-income countries (LMICs), health workforce production and distribution are further undermined by significant out-migration of health workers to net-migrant receiving high-income countries (HICs) such as the UK and the USA.3 4
The drivers of health personnel migration from resource-limited countries have been examined extensively and range from macrostructural determinants to individual-level factors. By and large, these factors are interconnected and include low wages, substandard working conditions, safety concerns, bad government, stunted educational and professional opportunities, and demands of the global health labour market.5–8 The US-based Executive Board of the Consortium of Universities for Global Health recommends that the field of global health prioritise the training, distribution and migration of health workers.9 Paradoxically, the field of global health, it could be argued, may accelerate health workforce mobility and undermine local health capacity by enabling clinicians and scholars from HICs to deliver healthcare services and conduct research across steep gradients of inequality in resource-poor low-tech and remote settings, while luring elite health labour in LMICs to work for North American-funded or European-funded global health academic or development programmes.10 11 Sub-Saharan African countries with an English-speaking elite are becoming popular venues for US-based global health academic programmes in search of host institutions in Africa, a worrisome competition for local partnerships that has been likened to a new ‘scramble for Africa’.12
Echoing a somewhat similar worry, Dr Paul Farmer, a prominent global health advocate, asked, ‘It is fine that there are more American pediatricians than African ones in some of that continent’s poorer cities and towns, … but what are our long-term plans for helping to rebuild health care infrastructure and for training and retaining local professionals in these areas?’13 Having more expatriate doctors than local ones in some African polities may be problematic if the former, typically paid far more than the local public sector can afford, competes against the latter for local employment opportunities. A contrasting viewpoint is that such immigrant health labour may represent a positive transfer of human resources to Africa, as in the case of Cuban doctors posted to remote, rural and impoverished areas in several sub-Saharan African countries through Cuba’s Comprehensive Health Program.14 Health labour migration studies, however, tend to focus on the LMIC-to-HIC ‘brain drain’ as a zero-sum game and one-way flow of skills from resource-poor settings to wealthy ones.
In an era of global health opportunities characterised by frequent international commuting in the global north-to-south or the global south-to-south directions, monitoring both out-migration and in-migration data is necessary to appropriately assess health capacity gaps in LMICs and to develop policies that advance the achievement of health-related national priorities. Such data-monitoring efforts are consistent with the recommendations of the WHO Global Code of Practice on the International Recruitment of Health Personnel (the Code), a 10-article framework for the ethical management of health labour global migration adopted in 2010 by the 63rd World Health Assembly.15
The Code is grounded in the principle that supporting sustainable health systems in LMICs and protecting the human rights of health workers, including their freedom to move, are not mutually exclusive. Although non-binding, the Code discourages the active recruitment of skilled health workers from resource-limited countries and urges all WHO member states to develop health workforce planning, education, training and retention strategies that will reduce their reliance on international medical graduates (IMGs). To build the evidence base necessary for developing more effective policies, the Code encourages the strengthening and dissemination of research on migrant health workers.15 Against this backdrop, this study sought to estimate physician net migration (NM) in South Africa (SA), and SA’s net loss of physicians to the Organisation for Economic Cooperation and Development (OECD) countries. We chose SA among other middle-income countries within the WHO African Region because it was one of only three African countries that submitted quantifiable data on its immigrant health workforce during the second round of monitoring of the global implementation of the Code in 2015.16 Moreover, SA’s health challenges are well documented, compounded by its world’s highest HIV/AIDS seroprevalence, a heavy burden of non-communicable diseases, and a history of health inequity and medical migration spanning several decades.17–21
Methods
Defining migrant physicians
We defined South African-trained international medical graduates (SA-IMGs), or emigrant physicians (or ‘émigrés’) as medical graduates from South African medical schools who appear on medical registers in foreign countries. We restricted our analysis of emigration trends of SA-IMGs to those who are based in member states of the OECD, a 36-country organisation comprising several of the world’s leading economies that are also among the globe’s top doctor-receiving countries.22 We defined South African-based immigrant physicians or ‘immigrants’ as medical degree-holding foreign nationals registered to practise medicine in SA by the Medical and Dental Board of the Health Professions Council of South Africa (HPCSA).23 Of note, in our study, immigrants could comprise both those who earned a medical degree outside SA, also known as IMGs, and foreign nationals who earned a medical degree in SA but did not return to their country of origin after graduating.
Data sources
Except for émigrés located in the UK whom we identified through the General Medical Council (GMC) register,24 aggregate data on SA-IMGs were drawn from OECD.Stat, the comprehensive and publicly accessible online database of the OECD, based on the Joint OECD/Eurostat/WHO-Europe Questionnaire on non-monetary healthcare statistics.25 Health workforce migration data available on OECD.Stat are supplied annually by official sources. However, we found that OECD.Stat data on the number of SA-IMGs registered in the UK were significantly lower than those found on the GMC register. We used the numbers from the latter database to quantify UK-based SA-IMGs, since it represented a primary data source. Aggregate data on immigrants and domestic physicians practising in SA were obtained from the National Reporting Instrument (NRI) reports database, a publicly accessible online data repository managed by the WHO as a collective platform to share information on health worker migration and implementation of the Code.16 Since its début in 2012, NRI data are updated every 3 years. Since the third round of national reporting on the Code’s implementation via the 2018 NRI was still under way, we used data from the 2015 NRI as it was the only round that included complete data from SA. These data were sourced from the 2014 HPCSA register.23
Data analysis
Because our analysis of emigration trends was restricted to OECD countries, we excluded from our analysis 59 SA-IMGs identified in five non-OECD countries (Namibia (n=25), Cyprus (n=24), Argentina (n=4), Uganda (n=3), and Trinidad and Tobago (n=3)). We calculated physician NM rate as follows:  , where I2014 represents the South African-based immigrant-physician population in the year 2014, E2014 is the OECD-based stock of SA-IMGs in 2014, and W2014 is the physician workforce in SA in 2014. Applying this formula while excluding South African-based immigrant physicians originating from non-OECD countries enabled us to estimate the ‘net loss’ (ie, brain drain) of SA’s physicians to OECD countries.
We used the formula  to operationalise net immigration (NI) as the numerical change in the South African-based immigrant-physician stock (IS) from 2010 to 2014. Similarly, we operationalised net emigration (NE) as the numerical change in the OECD-based South African emigrant-physician stock (ES) from 2010 to 2014 using the formula
  . We estimated the exit (Ex) of émigrés from OECD countries’ physician workforces through the formula
  , where QO represents the quinquennial or 5-year SA-to-OECD outflow of physicians, that is, the cumulative number of SA-IMGs entering the medical registers of OECD countries within the years studied, 2010–2014, and NE is the net emigration during the same time period. Similarly, we estimated the exit of OECD-origin immigrants from the South African physician workforce as follows:
  , where QI represents the cumulative number of IMGs from OECD countries newly registered in SA within the years 2010–2014, and NI is the net immigration within the same time-period.
Missing data
Data on nationality were missing for more than half of foreigners on the HPCSA register. To adjust for missing nationality data, we multiplied the total number of foreign physicians with missing nationality by the proportion of identified immigrants from a given source country relative to the total number of immigrant physicians with known nationality. We then added this product to the number of identified immigrant physicians from that source country. For example, UK nationals represented 9.45% of 3436 (n=325) foreign physicians with known nationality on the HPCSA register in 2010. We added 9.5% of 5007 (n=474) physicians with missing nationality to 325 to obtain the adjusted total of 799 British physicians in SA in 2010. Data on the stock of SA-IMGs registered in Australia were missing for the year 2010. We imputed these missing data by substitution, using 2009 data from Arnold and Lewinsohn.19 Data on the number of SA-IMGs newly registered in Australia during the 2010–2014 5-year period were also missing. We estimated these missing data using complete data from New Zealand, a neighbouring country with a pattern of IMG recruitment comparable to Australia.26 To obtain 2010–2014 estimates of new South African registrants in Australia, we multiplied the 2010–2014 total number of new South African registrants in New Zealand by a factor of 2.5, the average ratio of the Australia-to-New Zealand’s émigré stocks during the 2009–2015 period.
Patient and public involvement
This study was based solely on secondary data and did not involve any patients or the public.
Results
In 2014, we identified collectively 48 370 graduates from South African medical schools in SA and in OECD countries (table 1). OECD-based émigrés represented 26% (n=12 691), while South African-trained foreign nationals practising in SA represented 8% (n=3801). Including the latter group, 8793 immigrant physicians appeared on the HPCSA register in 2014. Negative NM estimates (table 1) suggest that for every 100 of its medical graduates, SA’s loss to migration was 9 physicians in 2014—down from 18 physicians just 4 years earlier.
Estimates of physician workforce, migrant-physician stocks and physician NM rates in South Africa (2010–2014)
Figure 1 depicts recent immigration trends in SA based on 2000–2014 total new registrations (n=9318). One striking observation is the sharp increase in the size of the IMG pool during the 2010–2014 5-year period. The proportion of these newer IMGs in relation to the total number of new registrants was relatively modest between 2000 and 2009 (13% and 10% in the two 5-year periods) but jumped to 46% in the 2010–2014 5-year period. Africa was the leading regional source of IMGs immigrating to SA, providing 60% of all IMGs during the 2000–2014 15-year span, and 1147 of 2013 of IMGs between 2010 and 2014. The OECD was the second regional source of IMGs entering SA, providing 650 of 2013 IMGs in 2010–2014 and nearly 29% of IMGs to SA between 2000 and 2014.
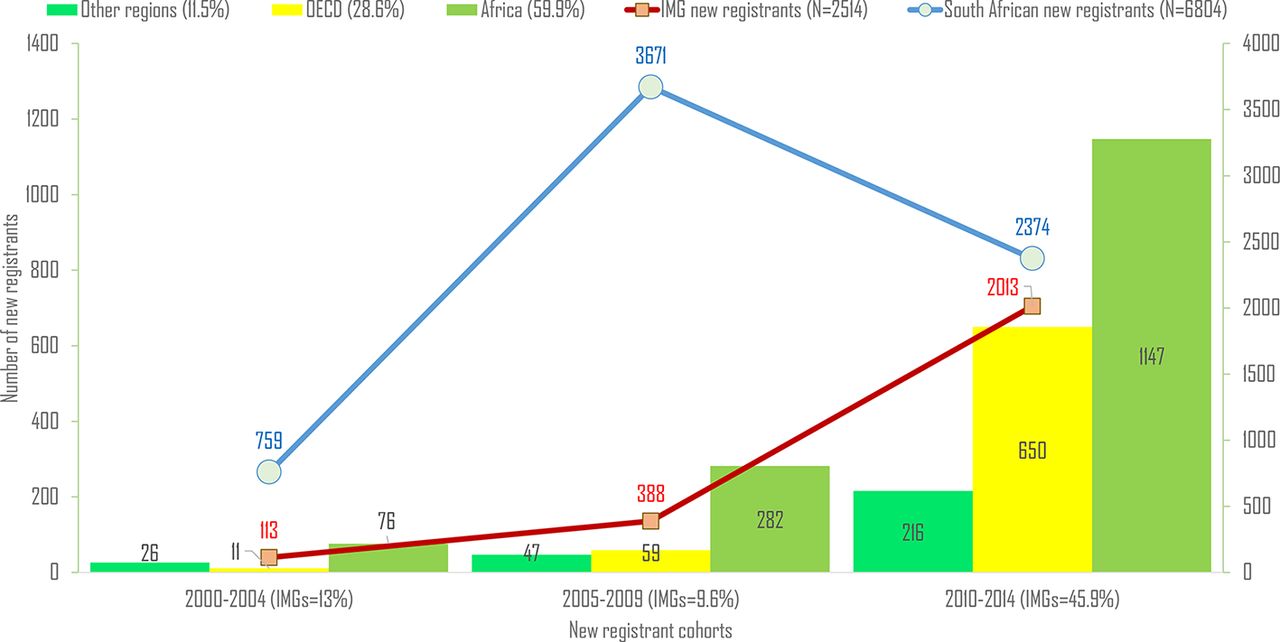
New registration trends of IMGs in South Africa between 2000 and 2014. IMG, international medical graduate; OECD, Organisation for Economic Co-operation and Development.
Figure 2 presents the top 10 non-OECD sources of medical qualification of IMGs practising in SA. Of these, five countries (namely, the Democratic Republic of the Congo, Zimbabwe, Namibia, Botswana, Mauritius and Malawi) are member states of the Southern African Development Community (SADC), a 16-country regional organisation, including SA and all its close and distant neighbours. While Nigeria was the African country with the largest number of new IMG registrants in SA in 2010–2014, Libyan medical graduates represented the fastest growing IMG cohort, increasing by >100-fold when compared with the 2000–2009 decade.

Top 10 non-OECD foreign countries appearing on the 2014 register of the Health Professions Council of South Africa. DR, Democratic Republic; OECD, Organisation for Economic Co-operation and Development.
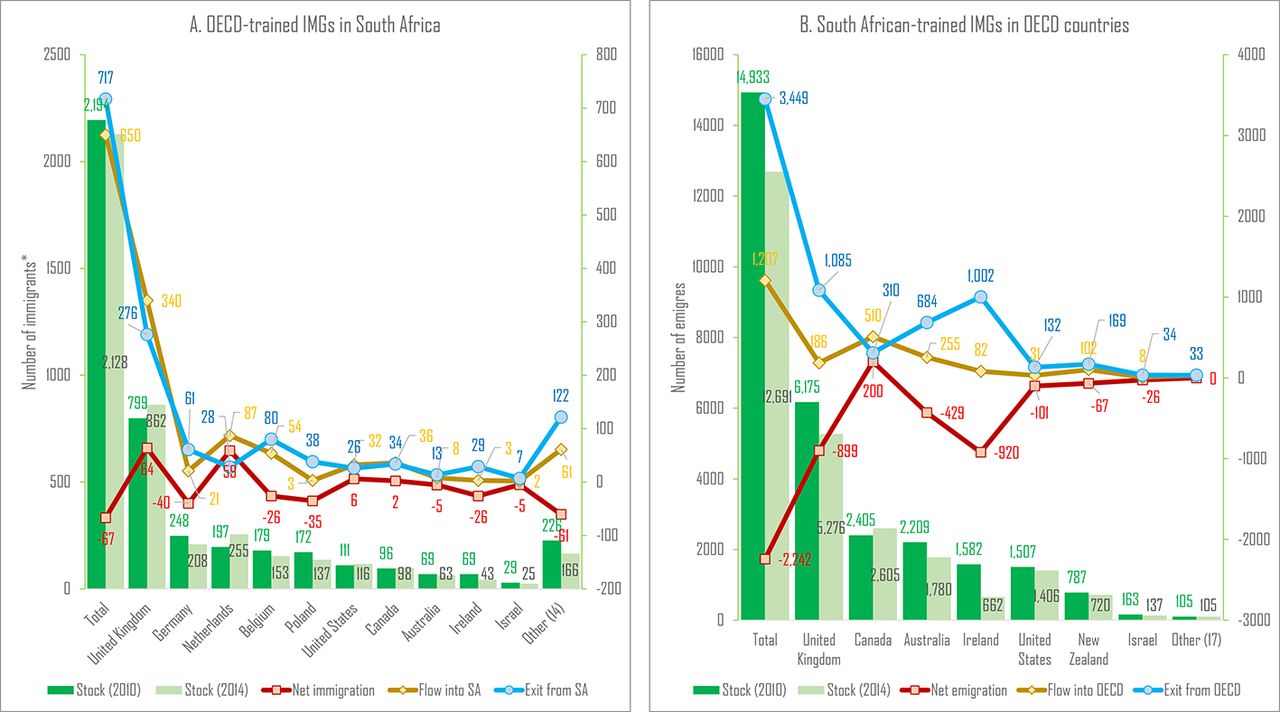
With 340 out of 650 OECD-origin IMGs entering the HPCSA register in 2010–2014, the UK was the leading OECD source of immigrant physicians in SA, with more doctors recruited between 2010 and 2014 than the other 23 OECD countries combined on the HPCSA register (figure 3A). Concurrently, several OECD countries hosted South African émigrés whose numbers substantially exceeded those of South African-bound immigrants from the OECD (figure 3B). The UK, Canada, Australia, Ireland, USA and New Zealand have been the main OECD beneficiaries of these asymmetric flows.
Physician migration flows between South Africa and OECD countries: 2010–2014 inflow, exit and stock estimates. *Note: the numbers of immigrant physicians from OECD countries registered in South Africa have been adjusted upward to account for missing nationality data. OECD, Organisation for Economic Co-operation and Development.
Despite new entries of about 1200 SA-IMGs into the medical registers of OECD countries in 2010–2014, the South African emigrant-physician population in the OECD dropped from roughly 14 900 SA-IMGs in 2010 to nearly 12 700 SA-IMGs in 2014 because of the exit of more than 3400 SA-IMGs from OECD countries’ medical registers (figure 3B). Except for Canada, which saw a net increase of 200 SA-IMGs on its register between 2010 and 2014, all main OECD host countries had fewer South African doctors on their medical registers in 2014 than in 2010. In the UK, 1085 SA-IMGs exited the GMC register between 2010 and 2014. The number of SA-IMGs on the Irish register plummeted by −58%, from 1582 emigrant physicians in 2010 to 662 emigrant physicians in 2014 (figure 3B).
After adjusting for missing nationality data, SA’s estimated net loss of physicians to OECD countries ranged from −14 040 to −12 739 physicians in 2010 and from −11 637 to −10 563 physicians in 2014 (table 2). Assuming all OECD-based SA-IMGs are South African natives, this suggests that for every 100 South African physicians graduated from South African medical schools, at least 42 had moved to OECD countries by 2010. By 2014, however, this net loss of South African physicians to OECD countries had decreased from 42 to 30 physicians for every 100 trained in SA (table 2).
SA’s estimated net loss of physicians to OECD countries (2010–2014)
Discussion
Our findings corroborate previous reports that physician emigration from SA is slowing.27 28 Nearly 3450 South African émigrés exited OECD countries’ medical registers between 2010 and 2014, and we observed no noticeable rotation of émigrés among OECD countries. While forward migration to non-OECD countries may be a possibility among these émigrés, return to SA is even more likely. A recent survey of South African health personnel found one-third of >1600 respondents indicated they were returnees. Reasons cited for their return to SA included ‘physical environment, family ties, lifestyle, culture, and social life’.28 On the other hand, of 12 750 South African medical graduates whom we identified overseas in 2014 through the three databases, only 59 (0.4%) were located in non-OECD nations. This nominal number suggests that non-OECD countries are unlikely destinations for most South African IMGs. While data from Arab Gulf states were missing from the 2015 NRI reports, there is neither evidence in the literature nor any colonial and extended cultural ties between SA and Arab Gulf states to suggest the latter currently host large numbers of South African IMGs.22
Although our analysis of migration focuses mainly on post-Code trends, SA’s physician emigration slowdown likely began earlier. GMC records indicate 8584 South African IMGs were registered in the UK in 2006.24 By 2010, however, their number had dropped by 28% to 6175, and by 2017, it further decreased by 18% to 5073.24 These diminishing numbers contrast sharply with those of Nigeria, Africa’s largest economy and second largest source, after SA, of sub-Saharan African-trained IMGs in OECD countries.16 24 25 In 2006, 2692 Nigerian-trained IMGs appeared on the GMC register. By 2010, their number had grown by 33% to 3570 and had nearly doubled to 5060 by 2017.24 Likewise, records from the AMA Physician Masterfile reveal a 42% increase among Nigerian-trained IMGs in licensed practice in the USA between 2005 and 2015.29
We believe that the consistent downward out-migration trends observed in SA are not generalisable to other African source countries, but we do not know of any policies that can fully explain them. The 2007 introduction of the Occupational Specific Dispensation (OSD), a financial incentive scheme to attract and retain SA’s health workers in the public health sector, is credited with narrowing the wage gap between South African-based health workers and their émigré counterparts. However, professional nurses (not doctors) have been the primary beneficiaries of the OSD policy.30 Labonté and colleagues explained these decreasing emigration trends from SA in part by a decreasing global demand of health labour.28 However, as we suggested above, Nigerian-trained IMGs are still recruited in relatively large numbers by OECD member states like the UK and the USA.24 29
It is unlikely the current implementation of the Code in SA has had any significant influence on SA’s downward physician emigration trends, which began before the Code’s inception in 2010.15 31 In fact, the Code remains largely an immaterial policy instrument in the WHO African Region. Most countries of the region have not domesticated the Code’s recommendations into their national human resources for health policies. Even a leading IMG source country like Nigeria, which may potentially benefit the most from the Code’s implementation, has not participated in either the first or the second round of NRI data collection on the monitoring of the global implementation of the Code.16 32 Without any implementation, it will be difficult to realise the Code’s desiderata and gauge its relevance. Yet its implementation is completely voluntary, and this may explain why its influence has been limited.
To its credit, the Code’s recommendation to improve knowledge of health workforce flows and systematic reporting mechanism has led to the development of National Health Workforce Accounts (NHWA), the system through which WHO member states are empowered to monitor and harmonise health workforce data for the purpose of achieving universal health coverage and the health-related targets of the SDGs.32 33 Quantitative NRI data are reported through the NHWA online portal, and our research represents early use of this database, and we believe, if reported consistently and strengthened over time, NRI data should provide better insight into health workforce capacity and mobility.
Despite its slowed physician out-migration and reverse flows, SA’s reliance on foreign doctors has remained steady and may even be increasing in the face of the significant proportion of IMGs recruited into its physician workforce between 2010 and 2014.31–34 Of note, although not reported in our findings, about 6% (156 of 2514) of all IMGs recruited to SA between 2000 and 2014 were South African nationals who graduated from foreign medical schools. In contrast, only 8 out of 6804 (0.1%) South African medical graduates recruited to SA during the same period were foreign nationals, likely from the SADC or other African countries. Acceptance of foreign students into medical school in SA is increasingly rare, probably because all eight medical schools currently operating in the country are public institutions with limited enrolment capacity and large numbers of domestic applicants. In 2013, less than 1% (15 of 2563) of offers made were to foreign nationals, with only 40% (n=6) ultimately accepting the offers.35
SA has drawn its cosmopolitan physician workforce from nearly 100 countries. The absolute majority of its IMGs come from the African continent, mainly from SADC countries and Nigeria, while many others come from the same OECD countries to which South African medical graduates have migrated. Many Western expatriates may have been attracted to SA to support the country’s massive HIV/AIDS treatment and research efforts, largely funded by the South African government, but also assisted by the US President’s Emergency Plan for AIDS Relief.12 36 The appearance of Libyan-trained IMGs on the HPCSA register represents a new phenomenon. Until 2010, Libya was not a source of African-trained IMGs recruited in SA. Their entry and rapid growth in recent years (>100-fold in 2010–2014 vs 2000–2009) is a likely consequence of the ongoing political instability, which began as part of the 2010 Arab Spring revolution and has since degenerated into a protracted civil war with tragic consequences for Libya’s health system.37 38
Although our analysis has improved the measurement of SA’s two-way flow of physicians, some observations are noteworthy vis-à-vis the registration status of South African medical graduates. A 2015 report by Econex, a South African consulting firm, noted significant discrepancies between the number of medical practitioners reported on the HPCSA register and the estimated number of physicians actively practising in SA.39 These discrepancies ranged from 43% in 2008 to 25% in 2013, with more physicians registered than practising. This suggests the official size of the South African physician workforce may be overestimated and that healthcare planning efforts based on such inflated figures will fall short.
Likewise, a 2015 survey of annual registration retention in Ireland revealed fewer than 19% of SA-IMGs on the Medical Council of Ireland register practised exclusively in Ireland; 63% of the respondents did not practise in Ireland at all.40 41 Observers speculated these inactive registrants may be retaining their Irish registration annually as insurance to enable them to reimmigrate to Ireland in the future.41 42 High proportions of inactive registrations among émigrés inflate the numbers of those who are actually based in OECD countries while underestimating the potential number of émigrés who have exited the OECD health labour market and might have returned to the home country. The re-entry of these returnees into the South African physician workforce may not be evident if they never deregistered from the HPCSA register while living, practising or specialising overseas.
As this study demonstrates, when data on migrant health workers are accessible and carefully examined in both source and destination countries, we can observe better migration estimates, highlight important temporal and demographic patterns, and discover nuanced elements of health workforce mobility. Limitations are noted since missing nationality data and uncertainty about licensed doctors’ effective practice and actual location are extant. Notwithstanding these limitations, we believe our methods and findings provide better estimates of the South African physician brain drain than previous studies by examining both outflows and inflows of physician labour in SA. In an era of global opportunities with increasing transnational commuting and multilocal living arrangements among mobile health workers,43 44 our understanding of the complexities of health personnel mobility will improve if we begin to view LMICs not merely as sources of IMGs but also as potential destinations.
Acknowledgments
The authors thank Ibadat Dhillon and Percy Mahlati for their comments on earlier versions of this paper.
References
Footnotes
Handling editor Seye Abimbola
Contributors AST conceived and designed the study, analysed the data and wrote the first draft of the manuscript. AH and SHV revised the manuscript critically for important intellectual content. All the authors read and approved the final draft of the manuscript.
Funding SHV was supported, in part, by a grant from the National Institutes of Health (P30MH062294). This funder had no role in the study design, collection, analysis and interpretation of the data, writing of the report or decision to submit the paper for publication.
Competing interests None declared.
Patient consent for publication Not required.
Provenance and peer review Not commissioned; externally peer reviewed.
Data availability statement Data are available in a public, open access repository.