Article Text

Abstract
Introduction The role of the private sector in family planning (FP) is well studied; however, few efforts have been made to quantify the role of private out-of-pocket (OOP) expenditures on FP commodities across low-and-middle-income countries (LMICs). Calculating OOP expenditures is important to illuminate the magnitude of these contributions and to inform discussions on how financial burdens can be reduced.
Methods Estimates of FP users and commodities consumed by women getting their FP methods from the private sector were made for 132 LMICs. Next, unit price data were compiled from to estimate the average price of commodities in the private sector at both a commercial and subsidised price point. These unit prices were applied to commodity consumption estimates to calculate total private OOP expenditures. Sensitivity testing was conducted.
Results Total estimated private OOP expenditures for FP commodities in 2019 was $2.73 billion across 132 LMICs. Spending on contraceptive pills accounted for 80% of this total, and just over three-quarters of expenditure came from upper-middle-income countries. OOP expenditures on subsidised commodities were small but accounted for 20% of expenditures in low-income countries. Non-subsidised unit prices were found to be between 5 and 20 times higher in upper-middle-income countries compared with low-income countries, although wide variation exists. For low-income and lower-middle-income countries, subsidies appear to be greatest for intrauterine devices (IUDs) and pills.
Conclusion Large OOP expenditures across all income levels highlight a need for financing approaches that ensure that a wide range of contraceptives are both accessible and affordable.
- health economics
- public health
- maternal health
- health insurance
Data availability statement
The majority of data used in the analysis come from publicly available sources; however, a small amount of confidential price data was obtained. Online supplemental appendix 4 shows the median price for available estimates at country level and specific non-public data sources are not identified to protect the confidentiality of data obtained. Some additional details may be available on request if they do not include these confidential sources.
This is an open access article distributed in accordance with the Creative Commons Attribution Non Commercial (CC BY-NC 4.0) license, which permits others to distribute, remix, adapt, build upon this work non-commercially, and license their derivative works on different terms, provided the original work is properly cited, appropriate credit is given, any changes made indicated, and the use is non-commercial. See: http://creativecommons.org/licenses/by-nc/4.0/.
Statistics from Altmetric.com
Key questions
What is already known?
The private sector is an important source of contraception for many women, especially for short-term methods (eg, injectables, pills and condoms).
What are the new findings?
Private out-of-pocket (OOP) expenditures on family planning (FP) are significant, totalling $2.73 billion across 132 low-and-middle-income countries in 2019. The share of spending from OOP increases across Gross National Income (GNI) group, reaching more than 90% among upper-middle-income countries.
Unit prices paid by private sector consumers vary with consumers in upper-middle-income countries paying between 5 and 20 times the prices paid in low-income countries.
What do the new findings imply?
Careful attention is needed to limit undue financial burdens on women as countries transition away from donor-funded FP commodities.
Background
Understanding current financing of family planning (FP) commodities is critical to plan for future commodity security, ensure public sector funds are well targeted and identify where there are undue financial burdens on women and couples purchasing FP commodities out-of-pocket (OOP). While much attention and effort has gone into tracking public sector procurement of FP commodities,1–3 comprehensive estimates of private sector OOP expenditures across low-and-middle-income countries (LMICs) are lacking. Where such estimates do exist, they have generally applied a public-sector unit price to all contraceptive users4–6 and have not accounted for price variation within the private sector. As a result, estimates may hide the true financial burden faced by individuals purchasing their contraception commodities from private providers.
Previous research has shown the extensive role of the private sector in the provision of FP services, as measured by the share of FP users accessing private sector sources.7 8 While these provide a useful understanding of the role of the private sector, they do not monetise the associated OOP expenditures associated with private sector provision. Estimating OOP expenditures allows for analysis of the relative contribution of OOP expenditures compared with public spending from both donors and governments. This type of analysis provides contextualisation of current financing and is also critical to informing future financing strategies that can help lower the financial burden placed on individuals.
A recent study looking more broadly at global health procurement9 illuminated the large burden of OOP expenditures on health commodities. This work suggests a dominance of donor funding for procurement within low-income countries transitioning to private OOP in lower-middle-income countries and shifting back towards governments in upper-middle-income countries. While the pattern of donor dominance may look similar for low-income countries, the patterns in middle-income countries are likely to vary for FP commodities. FP commodities are different from other health commodities in that they are preventative, often needed on an ongoing basis and require different levels of interaction with a healthcare provider depending on the selected FP method.
As part of the Reproductive Health Supplies Coalition (RHSC) Commodity Gap Analysis 2019 (CGA 2019),10 estimates of expenditures on FP commodities by donors, governments and private OOP were made for 132 LMICs (The CGA 2019 reports on estimates for 135 countries; however, there were no data available for 3 countries, so they have been excluded from the count in this paper (American Samoa, Kosovo and Micronesia Fed States). In addition, both the CGA and this work exclude Venezuela and China). This paper provides details into the methodology, resulting estimates by country, and further details of 2019 OOP spending on FP commodities in LMICs (The CGA 2019 published estimates for 2018 as the ‘current’ estimate of expenditure; for the purposes of this paper, more recent 2019 estimates are used). This work quantifies OOP expenditure related to FP commodities only and therefore may exclude additional costs that are not already captured in the prices paid by clients. Further, all private spending is considered as OOP while in some limited contexts this may be partially or fully financed through health insurance schemes.
Methods
Estimates of OOP expenditures on FP commodities were derived by multiplying together (1) estimates of the volumes of commodities consumed by users and (2) the estimated prices paid for those commodities. For the purposes of this work, estimates of OOP expenditures are limited to those accessing FP through private sector sources, thereby excluding official or unofficial user fees for public sector clients. Within the private sector, OOP expenditures are classified into subsidised and non-subsidised components. Details of the methodological approach are provided later. A summary diagram of the approach is provided in online supplemental appendix 1.
Supplemental material
Estimating private sector commodity consumption
Estimates of total users in 2019 were taken from the FP2020 Progress Report11 for the 69 FP2020 countries and United Nation Population Division (UNPD)’s model-based estimates12 for non-FP2020 countries. Both sources use a Bayesian hierarchical model to estimate contraceptive use by country informed by household surveys and in select cases routine FP data. Users were divided into married/in-union users and unmarried users using the same FP2020 and UNPD estimates. Next, FP method mix was estimated for both married and unmarried users in each country. These estimates were based on a projection methodology developed for the CGA 2019 which starts with the most recently available estimate of method mix from a household survey (or a regional average when no survey is available) and applies regional patterns of average annual method mix change to account for projected shifts in FP method mix since the survey was conducted. Married/in-union and unmarried users were then summed together to get total users by FP method. Additional detail on this methodology can be found elsewhere.13
Next, data from Demographic Health Surveys (DHS) on source by FP method was used to split users of each method between those accessing their method from the public sector and those using the private sector. All non-public sources were classified as private, including a small proportion of individuals citing sources that would not generally be classified as private sector (eg, friend). Data were taken from the most recent DHS survey in each country; for countries with no DHS survey, regional averages were used.
Further analysis was conducted to segment the FP methods used by private sector users into subsidised and non-subsidised by comparing CGA 2019 market volume estimates with data compiled on volumes of subsidised products provided (by FP method and country). Subsidised product volumes include those that are distributed for free or below market rate (due to a donor or government subsidy) through private channels, including products that are socially marketed, sold via social franchises and sold via NGO clinics. Volume estimates captured a subset of services provided by Population Service International, Marie Stopes International, DKT International and other such organisations, as some of the services and products these organisations provide do not meet the established criteria (eg, provides via public sector channels or sold at commercial prices with no donor subsidy). Additional detail on this methodology can be found elsewhere.13
Next, the volume of subsidised and non-subsidised commodities consumed by private sector users was calculated. For short-term methods, this was done by multiplying the number of users by the number of units needed to be protected for a year. Short-term methods include injectables, pills, condoms and other methods that do not offer extended duration of protection. For long-acting and permanent methods (LAPMs), namely sterilisation, implants and intrauterine devices (IUDs), there is a need to account for those already protected by a FP method received in a previous year. To do this, it was assumed that if the number of LAPM users had increased from the previous year, then one commodity would be needed to serve each of these additional users. In addition, a fraction of the users from the previous year would need replacement product depending on the lifetime of their FP method.
Assembling unit price estimates from data sources
A wide range of data sources were compiled for the following FP methods: injectables, pills, implants and IUDs. Analysis of private sector unit prices for condoms and sterilisation were excluded due to limited and highly variable data; for these methods, public sector prices are used. The primary data sources are described later.
Demographic Health Surveys
DHS are nationally representative household surveys.14 A subset of surveys includes questions that ask women how much they paid for their current FP method the last time they obtained the method. Data on the amount paid were analysed, by FP method, for women who received their method from a private sector source from 30 DHS surveys (online supplemental appendix 2). For surveys where women were separately asked if they received their contraception for free, these respondents were assigned a price of 0. Two average prices were calculated for each FP method: average cost including free provision and average cost excluding free provision. All results were converted from local currency to USD based on a 2017 exchange rate regardless of the year of the survey. The survey question does not specify the number of units purchased, but rather asks about the last time the method was obtained. It was assumed that reported payments represent payments for a single commodity. Estimates were made using standard survey weights and unit prices results were excluded when there were fewer than 25 respondents.
Supplemental material
PMA2020
PMA2020 conducts household surveys in select countries (PMA2020 also conducts facility surveys where facilities are asked what they charge for family planning services; however, it was decided the household-based survey should be used). The surveys ask women if they paid any fees for FP services in the last 12 months, and if so, how much they paid.15 Data on the amount paid were analysed among women who received their FP method from a private sector source from seven PMA2020 surveys (online supplemental appendix 2). All prices paid were reported in local currency and converted to USD using 2017 exchange rates. Next, the cost in USD per commodity was calculated. For implants, the reported amount paid was used since only one commodity is used. For injectables and pills, the 12-month cost reported was divided by an estimate of the average number of units consumed per year of each FP method. Estimates were made using standard survey weights, and unit price results were excluded when there were fewer than 25 respondents.
IQVIA
IQVIA, which was created when Quintiles and IMS Health merged, is a private company that tracks the price of health commodities across a range of countries.16 IQVIA-sourced data on implants, injections and pills were obtained from 59 LMICs. However, analysis was limited to a subset of 40 countries for which both price and volume data were available (online supplemental appendix 2). Where available, the retail price was used (inclusive of all mark-ups). When a retail price was not available, an estimated mark-up was applied to the available wholesale price. Next, a weighted average price was estimated for each country applying the IQVIA provided price to the volume of commodities sold at that price and the donor price to the remaining private sector commodities estimated to be consumed in the country. This was done to ensure that IQVIA prices were only applied to volumes that count be accounted for at those price points.
FPWatch
FPWatch surveys are nationally representative outlet surveys, which were conducted in five countries. These surveys tracked a range of indicators about product availability and price.17 The median unit price from ‘all private’ sources for each FP method was extracted from these surveys for the five countries (online supplemental appendix 2). Where surveys were conducted at a sub-national level, an unweighted average of the median prices across geographic regions was calculated.
Other Pprivate
Some additional data were added for countries drawing on a mix of published and unpublished data sources. These sources all provided data on the price sold at point of delivery. These data were taken as reported from available SHOPS Plus Private Sector Assessments,18 19 unpublished price data obtained from non-profit organisations and unpublished Track20 data taken from private facility audits in select countries. Other private sector price estimates were obtained for 17 countries (online supplemental appendix 2).
Public sector prices
Two sources were used for estimating public sector unit prices, which were used for FP methods with no private sector price data and for sensitivity testing. First, data used for developing the cost estimates for Adding It Up4 provided details on country-specific costs of contraceptives and associated supplies (Unpublished country-level data were shared for use in this analysis). Second, results from a survey conducted by RHSC on procurement prices paid by Latin American and Caribbean Governments survey were used (Responses were obtained from Honduras, El Salvador, Guatemala, Nicaragua, Mexico, Paraguay, Bolivia and Peru). Public sector prices included both the commodity and associated supply cost when relevant.
Calculating unit prices by method and country
Once these data sources were compiled, two price points were estimated for each FP method by country as follows:
Private non-subsidised: the median of DHS (excluding free), IQVIA, FPWatch, PMA2020, Track20 and Other Private, and
Private subsidised: the median of DHS (including free), IQVIA, FPWatch, PMA2020, Track20 and Other Private if the estimated unit price was less than the average public price.
Because data sources do indicate whether prices were for subsidised or non-subsidised products, average public prices were used as a proxy, with the assumption that products sold below this price point are benefiting from a subsidy. This is an approximation and may result in some cheaper generic method price points being misclassified as subsidised.
For each FP method, unweighted regional averages were calculated from the available country data, as well as medians and IQRs. The same summary calculations were also done for groupings by Gross National Income (GNI) group (low-income, lower-middle income, upper-middle income).
For each country, estimates were based on the country unit price for each FP method. If no country-specific unit price was available, aggregate regional averages were used (Africa, Americas, Asia and Europe). For sterilisation and condoms, public sector prices were used.
Sensitivity analysis was conducted using four alternative strategies for dealing with missing price data, ranging from most to least conservative: (1) only applying unit prices when country data were available and zero otherwise; (2) use public sector unit prices for missing prices; (3) use the first quartile of private sector prices (by region) for missing prices; (4) use the third quartile of private sector prices (by region) for missing prices.
Estimating private sector OOP expenditures
For each country, the volume of commodities consumed of each FP method (segmented by subsidised and non-subsidised) was then multiplied by the corresponding unit price to estimate total private OOP expenditures. Results are summed across countries to look at total expenditures for the 132 LMICs as well as by GNI group.
OOP expenditure estimates were compared with estimates of current donor and government expenditures on FP commodities published in the CGA 201910 to provide a complete picture of expenditures on FP commodities.
Patient and public involvement
No FP users were directly involved in this research as work drew only on secondary data sources and did not relate to the experiences of individuals. Relevant organisations working on provision of contraceptives through private sector channels were consulted and given an opportunity to provide feedback on the proposed methodology.
Results
Total OOP expenditures
The total estimated private OOP on contraceptives in 2019 is $2.73 billion across the 132 LMICs. Across the 132 LMICs, the most commonly used FP method by private sector users is pills, accounting for 29% of the FP method mix. When looking at OOP private expenditures, however, pills play an even more important role, making up 80% of private OOP expenditures, as can be seen in figure 1. This is due to the fact that pill users require monthly cycles of pills to be covered for a full year and each cycle has a relatively high unit price, especially in upper-middle-income countries where 40% of private sector pill users reside. More details on variation in unit prices can be found in the following section.

Private out-of-pocket expenditures by family planning (FP) method and Gross National Income group and FP method mix of private sector users, 2019 estimate for 132 low-and-middle-income countries.
Across all FP methods, spending on subsidised supplies is negligible because most OOP expenditures take place in upper-middle income countries, where few subsidies exist. While overall OOP expenditures in low-income countries only make up a small share of the total, within these countries, 17% of expenditures are for subsidised products. Lower-middle income countries account for nearly one-quarter (22%) of private OOP expenditures and 6% of OOP expenditures in these countries are for subsidised commodities (online supplemental appendix 3).
Supplemental material
In upper-middle-income countries, OOP expenditures are dominated by spending on contraceptive pills ($1.8 billion, 88% of total). In lower-middle-income countries, expenditures on pills (55%) and injectables (22%) account for the majority of spending. A similar pattern is seen in low-income countries with pills (50%) and injectables (25%) driving spending (table 1).
Private out-of-pocket expenditures in 2019 by FP method by Gross National Income group (% of total spend in group)
Total private OOP expenditures on subsidised commodities amount to $49.1 million. Subsidised expenditures are concentrated on three FP methods: pills (35% of total), condoms (26%) and injectables (23%). While subsidised expenditures play the greatest proportional role in low-income countries, in absolute terms, the greatest subsidised OOP expenditures are from lower-middle-income countries ($37.7 million) (online supplemental appendix 3).
When looking by country, results show that private OOP expenditures on FP are concentrated in a few large countries. Just four countries account for 66% of the total: Brazil ($1 billion), the Russian Federation ($312.4 million), Indonesia ($158.5 million) and India ($142.7 million). The FP methods driving the OOP in these countries differ, given differences in the private sector FP method mixes as well as unit prices. In Brazil and the Russian Federation, more than 90% of expenditure is on contraceptive pills. In Indonesia, OOP expenditure on injectables makes up the largest share (58%) followed by pills (32%). For India, it is pills (58%) followed by condoms (29%). Detailed results by country are provided in online supplemental appendix 3.
Private OOP expenditures in context
Private OOP expenditures on FP commodities make up only part of the total spending. To get a more complete picture, OOP estimates are shown together with estimates of donor and government expenditures on FP commodities (table 2).
Total expenditures on FP commodities in 2019 in LMICs
Within low-income countries, OOP expenditures account for the smallest share (35%), with nearly half (49%) of spending on FP commodities in these countries coming from donors. By contrast, in upper-middle-income countries, nearly all expenditure on FP commodities (92%) comes from private OOP. Lower-middle-income countries fall in the middle, with a sizeable share of expenditure from governments (29%) and the majority (65%) from private OOP. These patterns are driven by multiple factors including the relative role of the public and private sectors as a source for FP methods, differences in the method mix among users within each sector and the resulting volumes of supplies needed in the course of a year, and the unit prices paid among private sector users.
Unit prices in the private sector
Non-subsidised implants in upper-middle income countries have the highest median unit price ($58), while subsidised pills in lower-middle income countries have the lowest median unit price ($0.04) (table 3). There are often inconsistent patterns across FP methods. For example, in low-income countries, the median non-subsidised IUD price is higher than implants, while the opposite is true for lower-middle and upper-middle income countries. With a few exceptions, median unit prices tend to be similar in low-income and lower-middle income countries, while upper-middle income unit prices are almost always higher. For non-subsidised prices, upper-middle income prices range from 5 to 20 times the non-subsidised prices for the same FP methods in low-income countries.
Median unit prices and IQR (Q1–Q3) by FP method and GNI group
There is also variation in the difference between non-subsidised and subsidised unit prices. In low-income countries, IUDs have the largest price difference, with subsidised prices being 93% lower than non-subsidised prices, followed next by pills at 69%. In lower-middle income countries, both IUDs and pills have a similarly high per cent difference, 95% and 94% respectively.
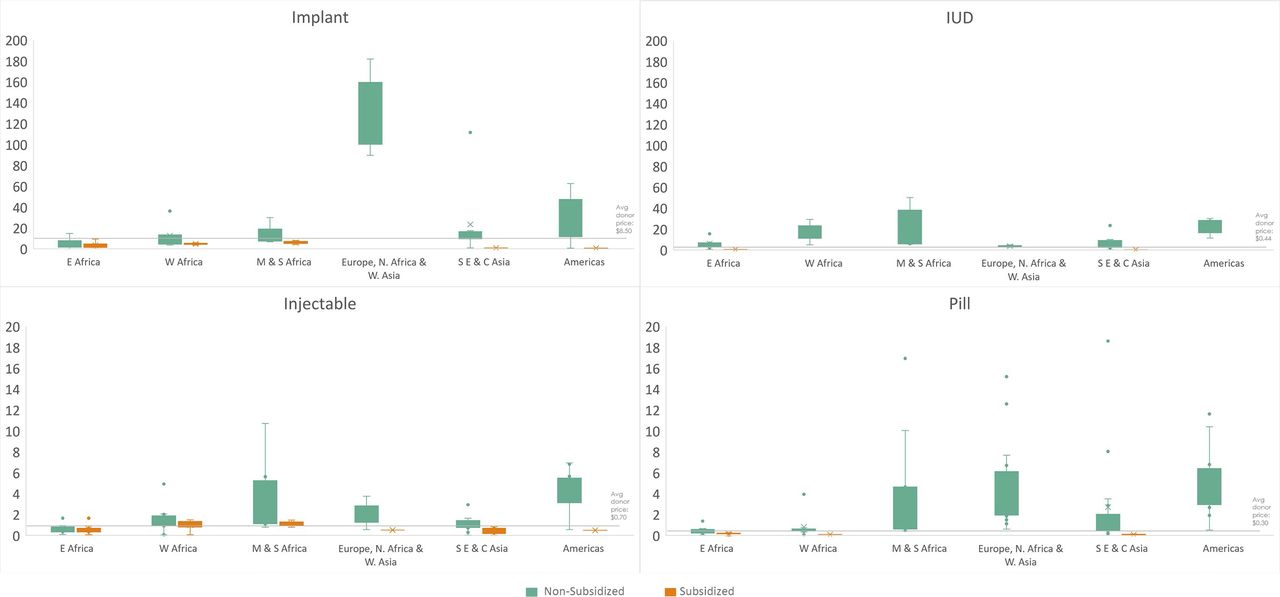
Country-level data reveal additional variation (figure 2). Here, data are presented by grouped geographical region; country details and summary statistics can be found in online supplemental appendix 4. Data availability is greatest for non-subsidised pills (69 countries) and injectables (51 countries), with implant (33 countries) and IUDs (25 countries) having fewer data points. The latter are also less common among private sources than short-term methods. Data on subsidised prices are sparser across all FP methods; however, it is known that many countries included in this analysis do not have subsidised products in their markets.
Supplemental material

Range of median unit prices by family planning method and Gross National Income group.
Among non-subsidised prices, both the highest prices and the largest ranges are found for implants. Median unit prices across the regions ranged from a low of $2.57 (Eastern Africa) to a high of $127.64 in the grouped regions of North Africa, Western Asia and Europe. Within this grouped region, the unit price of implants ranged from $89.81 to $181.72. The price ranges among IUDs were found to be much smaller, with median prices ranging from $3.76 in to $22.98. Among the two short-term methods, wider variation was found among pills than injectables. Outside of Eastern and Western Africa, considerable variation was found in pill prices, ranging from less than $1 per cycle to more than $12 per cycle across each grouped region.
Among subsidised prices, smaller ranges were found in the median unit price across countries; this was partly driven by fewer unit price estimates and by the fact that subsidised prices were constrained as they had to be below the donor price in each country to be classified as subsidised. The largest range was seen among implants in Eastern Africa which range from $0.13 to $9.42. Prices have been shown compared with an average donor price for each method, although it should be noted that unlike OOP prices, the donor price is for procurement only and not loaded with additional costs incurred throughout the supply chain.
Sensitivity testing
Of the estimated $2.73 billion in private OOP expenditure on contraceptives, $2.26 billion is derived from having applied country-specific unit prices to estimated consumption quantities (83% of total estimated). The vast majority of OOP expenditures presented in this paper, therefore, is drawn from actual country data. Proxy data play a much more limited role. Additional sensitivity testing using different proxy values (public, Q1 and Q3 unit prices) for countries without data yielded small differences, ranging from $2.51 billion (92% of total) to $2.79 billion (102% of total). By comparison, had public sector prices been used exclusively, total OOP on contraceptives would have been estimated at only $730 million, representing only 27% of the total.
Discussion
Three key findings emerge from this analysis. First, this work documents the first attempt to create a comprehensive estimate of OOP expenditures on FP across LMICs. Building on the foundation created in the 2018 Commodity Gap Analysis,20 this analysis offers additional data sources on private sector prices as well as the additional nuance of splitting the subsidised and non-subsidised private sector. This analysis reveals that the magnitude of OOP expenditures on contraceptives is hidden when public sector prices are used to value all commodity consumption. Even the $2.73 billion figure is conservative given the valuation of private sector sterilisations and condoms at public sector prices due to limited data (Separate work estimated private OOP on sterilisation services for FP2020 countries to be $120.92 million; using public sector supply prices, the estimate is $15.5 million). Further, it does not capture OOP expenditure within the public sector, which is very much a reality in countries where user fees for services are charged.
The findings of this analysis offer visibility into the financial contributions of women and couples. They reveal that for many FP methods, the price that institutional procurers such as USAID and UNFPA pay are well below the prices paid by consumers. This can be attributed in part to variations in the cost of the commodities driven by volume discounts and brand differences, as well as the fact that consumer prices build in additional costs not captured by donor procurement costs (supply chain distribution costs, marketing, etc).
Second, in contrast to the findings of Silverman et al9 where government financing for health commodities surged in upper-middle-income countries, this work finds an increasing dominance of OOP expenditures on FP in each subsequent GNI group, with more than 90% of commodity expenditure coming from OOP among upper-middle-income countries. The broader FP commodity gap analysis report notes that this distinct pattern for FP is driven by the preponderance of short-term methods, especially contraceptive pills, being purchased from private sector providers.10
Third, variable OOP expenditures and unit prices across geographical regions and country income levels have important implications. Results can be used to inform global and country-level discussions about reducing financial barriers to FP methods, particularly in the four countries that account for nearly two-thirds of OOP expenditures. For example, the dominance of OOP expenditures in upper-middle-income countries is largely influenced by Brazil, where use of short-term methods dominates. Recent studies have suggested that limited availability of IUDs and implants in the public sector, and even the private sector, have contributed to this method skew.21 22 This highlights the need to ensure that a full range of FP methods are included within universal health coverage schemes and other publicly funded approaches. For the most part, prices are higher in upper-middle-income countries and for non-subsidised commodities. Although this analysis did not look into the role of brands and generics, other work suggests highly concentrated markets can contribute to higher prices.9 Lessons from other health areas can be applied to help ensure that for those who do pay OOP for their FP commodities, their FP methods are affordable.
As with any analysis of this scale, there are several data limitations. Price and volume data are missing for several countries and proxy estimates are used in their place. Still, as shown by the sensitivity testing, the OOP expenditure estimates are robust as changes to the assumptions for missing country data do not have substantial impact on the overall OOP estimates.
For countries with data, a mix of data sources that capture prices in different ways were used. Household surveys rely on recall and amounts spent are not always clearly linked to the number of units purchased. Facility surveys and retail audits may not be representative of variation in prices paid at a population level. In some cases, this may introduce issues with comparability and also brings up questions about the most accurate way to capture price data. Further, this analysis sought to isolate the cost of the FP commodities themselves; however, the OOP price paid at the point of retail will inherently include mark-ups to account for costs incurred along the supply chain. Harmonisation across data sources could be improved with more standardisation of questions.
Another limitation is the imperfect differentiation between subsidised and non-subsidised prices. Current data sources do not allow enough visibility into the type of product purchased to make this differentiation. In this analysis, prices falling below the average donor price were assumed to be subsidised. It is conceivable that in some cases, lower prices reflected commercial generic products sold at lower price points. Furthermore, for some countries, the average price used for the non-subsidised price point is likely too low, even excluding free provision. In Eastern Africa, for example, the median non-subsidised price for implants was only $2.57, which falls below the lowest priced implants on the market.23 However, non-subsidised private sector market for implants is very small and so this price was only applied to a very small volume of product.
Finally, for the purposes of this analysis, it is assumed that all commodities obtained through the private sector are from OOP payments rather than covered through health insurance schemes. However, given the scale and coverage of existing schemes, they are unlikely to play a significant role in current OOP for private sector FP commodities. In four of seven countries included in an analysis of health insurance coverage, less than half of the population was covered by the scheme.24 For those who are covered, the coverage of FP services varied widely, often not covering the full mix of FP methods. Even when a full range of FP methods are included, OOP is still common. For example, an analysis of Universal Health Coverage in Latin America found that “despite the inclusion of family planning services in most countries' benefits packages… OOP payments were a substantial portion of national family planning expenditures”.25
Conclusion
Despite these data limitations, this analysis provides the most robust estimate of private OOP expenditures on FP to date. Private OOP expenditures for contraceptive commodities represent a heavy burden for women across LMICs. The disproportionate role of OOP expenditures in upper-middle-income countries coupled with the dominance of expenditure on contraceptive pills should be seen as a cautionary tale. As countries transition away from donor financing, it is critical that mechanisms are in place to ensure access to a wide range of affordable contraceptives. The growing movement towards Universal Health Coverage presents an opportunity today’s low and lower-middle-income countries to take a new path as their economies continue to develop. Going forward, future analyses of contraceptive costs should focus on OOP expenditures to better inform policy decisions for promoting affordable contraceptives.
Data availability statement
The majority of data used in the analysis come from publicly available sources; however, a small amount of confidential price data was obtained. Online supplemental appendix 4 shows the median price for available estimates at country level and specific non-public data sources are not identified to protect the confidentiality of data obtained. Some additional details may be available on request if they do not include these confidential sources.
Acknowledgments
The authors would like to thank John Skibiak, the director of RHSC, for his guidance and thoughtful contributions in shaping this work.
Supplementary materials
Supplementary Data
This web only file has been produced by the BMJ Publishing Group from an electronic file supplied by the author(s) and has not been edited for content.
Footnotes
Handling editor Edwine Barasa
Contributors MW and JS conceptualised the work. MW led the analysis and drafted the first version of the manuscript. NB revised and restructured the manuscript. JS provided detail review and edits to the manuscript.
Funding This work was supported by the Reproductive Health Supplies Coalition (RHSC).
Competing interests None declared.
Provenance and peer review Not commissioned; externally peer reviewed.
Supplemental material This content has been supplied by the author(s). It has not been vetted by BMJ Publishing Group Limited (BMJ) and may not have been peer-reviewed. Any opinions or recommendations discussed are solely those of the author(s) and are not endorsed by BMJ. BMJ disclaims all liability and responsibility arising from any reliance placed on the content. Where the content includes any translated material, BMJ does not warrant the accuracy and reliability of the translations (including but not limited to local regulations, clinical guidelines, terminology, drug names and drug dosages), and is not responsible for any error and/or omissions arising from translation and adaptation or otherwise.