Article Text

Abstract
Introduction Globally, an estimated 151 million children under 5 years of age still suffer from the adverse effects of stunting. We sought to develop and externally validate an early life predictive model that could be applied in infancy to accurately predict risk of stunting in preschool children.
Methods We conducted two separate prospective cohort studies in Vietnam that intensively monitored children from early pregnancy until 3 years of age. They included 1168 and 475 live-born infants for model development and validation, respectively. Logistic regression on child stunting at 3 years of age was performed for model development, and the predicted probabilities for stunting were used to evaluate the performance of this model in the validation data set.
Results Stunting prevalence was 16.9% (172 of 1015) in the development data set and 16.4% (70 of 426) in the validation data set. Key predictors included in the final model were paternal and maternal height, maternal weekly weight gain during pregnancy, infant sex, gestational age at birth, and infant weight and length at 6 months of age. The area under the receiver operating characteristic curve in the validation data set was 0.85 (95% Confidence Interval, 0.80–0.90).
Conclusion This tool applied to infants at 6 months of age provided valid prediction of risk of stunting at 3 years of age using a readily available set of parental and infant measures. Further research is required to examine the impact of preventive measures introduced at 6 months of age on those identified as being at risk of growth faltering at 3 years of age.
- Stunting
- child health
- prevention strategies
This is an open access article distributed in accordance with the Creative Commons Attribution Non Commercial (CC BY-NC 4.0) license, which permits others to distribute, remix, adapt, build upon this work non-commercially, and license their derivative works on different terms, provided the original work is properly cited, appropriate credit is given, any changes made indicated, and the use is non-commercial. See: http://creativecommons.org/licenses/by-nc/4.0/.
Statistics from Altmetric.com
Key questions
What is already known?
Stunting remains a major global health challenge, with irreversible impairment in a child’s physical, education and cognitive development occurring in millions of children due to lack of effective interventions.
Currently, there is no available evidence that allows factors present in utero or early infancy to predict later growth outcomes in young children.
What are the new findings?
This is the first predictive algorithm to detect risk of stunting in early childhood.
We identified seven easily measured factors that are key predictors of child stunting risk at 3 years of age: maternal factors (height and weekly weight gain during pregnancy), infant factors (sex, gestational age, weight and length at 6 months) and paternal height.
What do the new findings imply?
Primary healthcare workers at the community level are able to make a rapid assessment of the estimated future risk of stunting in a child.
Early preventive strategies can be put into place during a period when the greatest impact is likely to be achieved and before it is too late to change the growth trajectory.
Introduction
Stunting remains a major global health challenge, with many countries struggling to achieve target 2.2 of Sustainable Development Goal 2 (a 40% reduction in the number of stunted children under 5 years of age by 2025).1 2 Marked global disparity in the burden of stunting exists, with one in every three children affected in three regions (South Asia, Eastern and Southern Africa, and West and Central Africa).3 As a result, irreversible damage occurs in millions of children due to lack of effective interventions. Impaired linear growth is also linked with cognitive impairment, resulting in lower attained schooling and educational performance, leading to reduced productivity and decreased income-earning capacity,4 and significantly greater risk of developing chronic non-communicable diseases such as cardiovascular disease and diabetes in adult life.5
The process of growth retardation begins prenatally during the early stages of fetal development and is accelerated after weaning to complementary foods around 6 months of age. Following this, a dramatic decline in growth usually occurs between 6 and 24 months of age, when the high demand for nutrients is coupled with limited quality and quantity of complementary foods. A number of studies have highlighted that stunting and its biological processes are largely irreversible after about 3 years of age.6 Thus early identification of high-risk infants would enable effective preventive strategies to be introduced during this critical window of opportunity in early childhood.
Stunting is associated with a multitude of determinants, but the underlying biological pathways remain unclear.7 Potential risk factors include maternal ill health, intrauterine growth retardation and low birth weight, infant undernutrition, recurrent exposure to infectious diseases and enteric pathogens, micronutrient deficiencies, as well as socioeconomic influences (such as maternal education, paternal employment and exposure to environmental pollutants).4 8 The relative importance of these risks varies between settings depending on socioeconomic status, diet and infectious disease profile,9 and attempts to identify common predictive factors have thus far had limited success.7 10 Using modelling, the Lives Saved Tool has been used to explore the impact of scaling up different interventions on child health outcomes including stunting, and has demonstrated multiple factors that have a direct and indirect impact on stunting. However, modelling suggests that current strategies would only reduce global stunting rates by a modest 20%.11
The aims of this study were (1) to develop an early life prediction tool (the Stunting Tool for Early Prevention at 36 months of age, STEP-36) to identify infants within the first 6 months of life who are at high risk of becoming stunted at 36 months of age, and (2) to externally validate the tool using a separate cohort of children residing in the same area.
Methods
Data sources
Development cohort
The development cohort was a prospective observational cohort study of children live-born to women who had previously participated in a cluster randomised controlled trial (RCT) of antenatal micronutrient supplementation. The study was conducted in Ha Nam province in Northern Vietnam. Ha Nam has a population of approximately 820 100 people, with most residents working in subsistence agriculture, principally rice farming. Details of the original RCT, including a table describing the composition of the supplements, are published elsewhere.12 Briefly, women were enrolled in the RCT between September 2010 and November 2010 and were followed up at 32 weeks’ gestation, birth and with their infants at 6 months post partum at the commune health station (a primary care health facility). The trial had three intervention arms (daily iron folic acid (IFA), twice weekly IFA, twice weekly multiple micronutrients). Allocation was based on communes (cluster), and all communes in the province, other than those in the principal town district, were randomly assigned to one of the three treatment groups.13 Participants were visited every 6 weeks at home by trained supervisors who distributed the intervention with written instruction for the next 6 weeks, and collected information on side effects, adherence and pregnancy complications. Intake of supplements was not supervised. Participants took supplements from enrolment until 3 months post partum. In total, 1168 children from 104 communes were live-born. The prospective follow-up study was conducted between May 2012 and May 2014, and all eligible children born to mothers enrolled in the RCT were eligible to take part in the follow-up study. Assessments were carried out at the commune health station at 12, 18, 24, 30 and 36 months of age.14
Validation cohort
The validation cohort was based on a prospective observational cohort study of pregnant women, who were enrolled from December 2009 to January 201015 in 50 (randomly selected) of the same 104 communes in which the above RCT was undertaken. Pregnant women were eligible to participate if they were 12–20 weeks’ gestation and excluded if they had a multifetal pregnancy or if they were unable to provide informed consent to participate. No women participated in both the development and validation studies. Biological and psychosocial data were collected from women at enrolment and 32 weeks’ gestation, and infants were seen at birth and at 6, 24, 30 and 36 months of age. The same research team was used to implement the study and collect the data in both the development and validation cohorts.
Outcome
The outcome of interest was stunting derived from the height-for-age z-scores.16 Child length/height (cm) was measured using a portable ShorrBoard (Shorr Productions, Maryland, USA). Research staff recorded triplicate measurements, checked by a second observer, and the median measurement was used for analysis. Length-for-age/height-for-age z-scores were calculated using WHO Anthro (V.3.2.2, January 2011).17 Stunting was defined as length-for-age/height-for-age z-scores less than 2 SD below the WHO growth standards.
Predictors
A total of 79 potential candidate predictors were considered covering maternal, paternal, child, socioeconomic, environmental, laboratory and nutritional status factors collected during pregnancy and up to and including month 6 post partum. Variables were dropped from further consideration due to too many missing values (>50%), or if they were clinically difficult to collect during routine prenatal and postnatal visits (eg, certain blood parameters and non-routine information collected for research purposes). Clinical expert content knowledge and relevant literature about the plausibility of an association between the potential candidate predictor and stunting were also considered. While considered clinically relevant, length at birth was missing for about 53% of all live-born children in the development cohort and was not collected in the validation cohort and thus was not used. Of the remaining variables, further elimination occurred because not all were collected in both the development and validation cohorts (delivery type, weight at 6 weeks of age, and head circumference and mid-upper arm circumference (MUAC) at 6 months of age). While the mothers in the development cohort were exposed to a controlled iron intervention during pregnancy and those in the validation cohort received routine antenatal care alone, the type of supplement taken during pregnancy was considered a candidate predictor as it was part of the underlying study design of the development cohort. The 33 remaining candidates selected to explore in the development of the model, including method of collection, are shown in online supplementary table S1.
Supplemental material
Sample size
Sample sizes were calculated for the original studies,12 15 but no formal prospective sample size calculation was performed for developing or validating this prediction model for infant stunting at 3 years of age. The available stunting data at 3 years of age consisted of 172 events (stunted children) in the development data set of 1015 infants and 70 events in the validation data set of 426 infants.
Missing data
Three approaches were taken to account for missing data in the development cohort (see online supplementary appendix S1 for more detail). Briefly, the first method focused on complete cases only, meaning that infants were excluded from model development if stunting at 3 years of age or any of the predictors in the model were not available in the cohort of live-born infants. The second and third methods used multiple imputation, where method 2 imputed height-for-age z-score at 3 years and all candidate predictors, and method 3 imputed only candidate predictors for those infants with non-missing height-for-age z-score at 3 years. Imputation was done (50 times) using Stata (Stata version 14.0, StataCorp) command mi impute chained using predictive mean matching. The following set of variables were included in all the univariate imputation models: height-for-age z-score at 3 years (method 2 only); child characteristics (birth: sex, weight, final gestational age; 6/8 weeks postbirth: length, length-for-age z-score; 6 months postbirth: weight, length, length-for-age z-scores, fever last 2 weeks, haemoglobin); maternal factors (12 weeks’ gestation: age, weight, height, body mass index (BMI), MUAC, education, employment, household wealth index quintiles, number of past pregnancies (primigravida vs multigravida); 32 weeks’ gestation: weight, weekly weight gain between enrolment and third trimester weight, haemoglobin, ferritin (log base e); 6 months postbirth: weight, BMI); and paternal factors (weight, height, BMI, education, employment). Imputation also included the type of supplement taken during pregnancy by the mother. Stunting at 3 years was derived postimputation from the height-for-age z-scores (method 2 only). Pooled regression coefficients and SEs for the prediction model were calculated using the Rubin’s rule. Detail on how the set of predictors was determined from the imputed data sets is described in the next section. In addition, the Rubin’s rule was applied to obtain pooled predictions.18
Supplemental material
Statistical analysis methods
Consistent with the original studies,12 19 a loge transformation was applied to the positively highly skewed maternal ferritin levels at 32 weeks’ gestation. Details of the construction of quintile groupings of the wealth index for the infant’s household are provided in Online supplementary appendix 1 S1. The number of levels of the categorical candidate predicators maternal and paternal education (seven in the development cohort and eight in the validation cohort) and occupation (seven in the development and validation cohorts) was reduced to three levels each by grouping into primary school, secondary school and university/college, and farmer/housewife, factory worker/trader and government official/clerk, respectively. In the development data set, the intervention of daily IFA, twice weekly IFA and twice weekly multiple micronutrient supplementation was combined into daily versus twice weekly supplementation.
Selection of candidate predictors
All candidate predictors were fitted in a univariable logistic regression model that included children who had both the outcome and the predictor variable available (complete cases). Details of the investigations for non-linear relationships with continuous candidate predictors and collinearity between predictors are provided in online supplementary appendix S1.
We sought to predict stunting at 3 years of age as soon as possible after birth to allow for potential future nutritional, behavioural or pharmaceutical interventions, while still retaining the best possible predictive performance of the model. Therefore, two multivariable models were developed: (1) model based on maternal characteristics collected during pregnancy up to and including birth, paternal characteristics, and infant characteristics at birth (referred to as birth model); and (2) model based on maternal characteristics collected during pregnancy up to and including 6 months postbirth, paternal characteristics, and infant characteristics from birth to 6 months postbirth (referred to as 6-month model). Both models were developed on the complete case data set and the two multiple imputed data sets. Multivariable logistic regression using backward stepwise selection with probability of removal set to 0.05 and inclusion at 0.049 was conducted on all remaining candidate predictors after exploration of collinearity. Clinically meaningful interactions consisting of the infant’s sex with infant characteristics weight and length were explored if the main covariates were maintained in the multivariable model. Selection of predictors for the multiple imputed data was conducted in two ways: (1) applying backward stepwise selection on each imputed data set separately to obtain 50 sets of selected predictors and the final set of predictors defined as those present in ≥50% of the imputed data sets, and (2) applying the stacked method consisting of applying weights during the backward stepwise selection to account for the average fraction of missing data across all variables.20 21 One final birth model and one final 6-month model were selected based on the collective findings from the complete case and multiple imputation approaches while taking clinical relevance into account. To compare both models in terms of discrimination (differentiating between infants who will be stunted at 3 years of age vs not), the area under the receiver operating characteristic curves (AU-ROCs) with 95% confidence interval (CI) were obtained, after which equality of the AU-ROCs was tested using DeLong.22 We used the Hosmer-Lemeshow test P value and calibration plots to assess calibration (agreement between observed and predicted stunting at 3 years of age) and the Brier score to compare overall performance. The model with superior discrimination, calibration and overall performance measures based on complete case data was selected for external validation.
External validation
The performance of the model put forward for validation was evaluated by calculating the predicted probabilities for stunting at 3 years of age for the validation data set (complete cases) using the estimates of the model based on the development data set (complete cases). Performance of the model on the validation data set was assessed using Hosmer-Lemeshow test and a calibration plot for calibration and the AU-ROC statistic for discrimination. We reported the model’s overall performance using the Brier score. If the calibration suggested overfitting, we considered recalibration of the coefficients of the model by updating the intercept and/or multiplying the coefficients with the calibration slope, hereby shrinking the estimates. Infants in the development and validation data sets (complete cases) were stratified into risk groups once the final (recalibrated) model was obtained.
Both the development and validation cohorts originated from clusters defined by commune. The intracluster correlation was zero for the development and validation data sets, respectively, as derived for stunting at 3 years of age using a random-effects logistic regression model based only on those with a non-missing outcome. Therefore, commune was not incorporated in the model building strategy. The STEP-36 tool was developed and validated following a published prediction model framework.23
Patient and public involvement
Patients were not involved in the conceptualisation, design or conduct of this study. The results of the study will not be disseminated directly to participants.
Results
Participants
The trial flow diagram of the development and validation cohort is presented in figure 1. A total of 1168 and 475 infants were live-born in the development and validation cohorts, respectively. In the development and validation cohorts, there were 1015 (86.9%) and 426 (89.7%) live-born infants, respectively, who had available stunting data at 3 years. Of these 172 (16.9%) and 70 (16.4%) were stunted at 3 years. Summary statistics of infant, maternal and paternal demographics, and biochemical and anthropometric characteristics are presented in online supplementary tables S2 and S3 by those with and without available stunting data at 3 years for the development and validation cohorts, respectively. A comparison of the distributions of the candidate predictors between the development and validation cohorts for live-born infants with non-missing stunting information, including the percentage of missing data and data range for each candidate predictor, can be found in online supplementary table S4. In general, characteristics between the development and validation data sets were similar.
Supplemental material
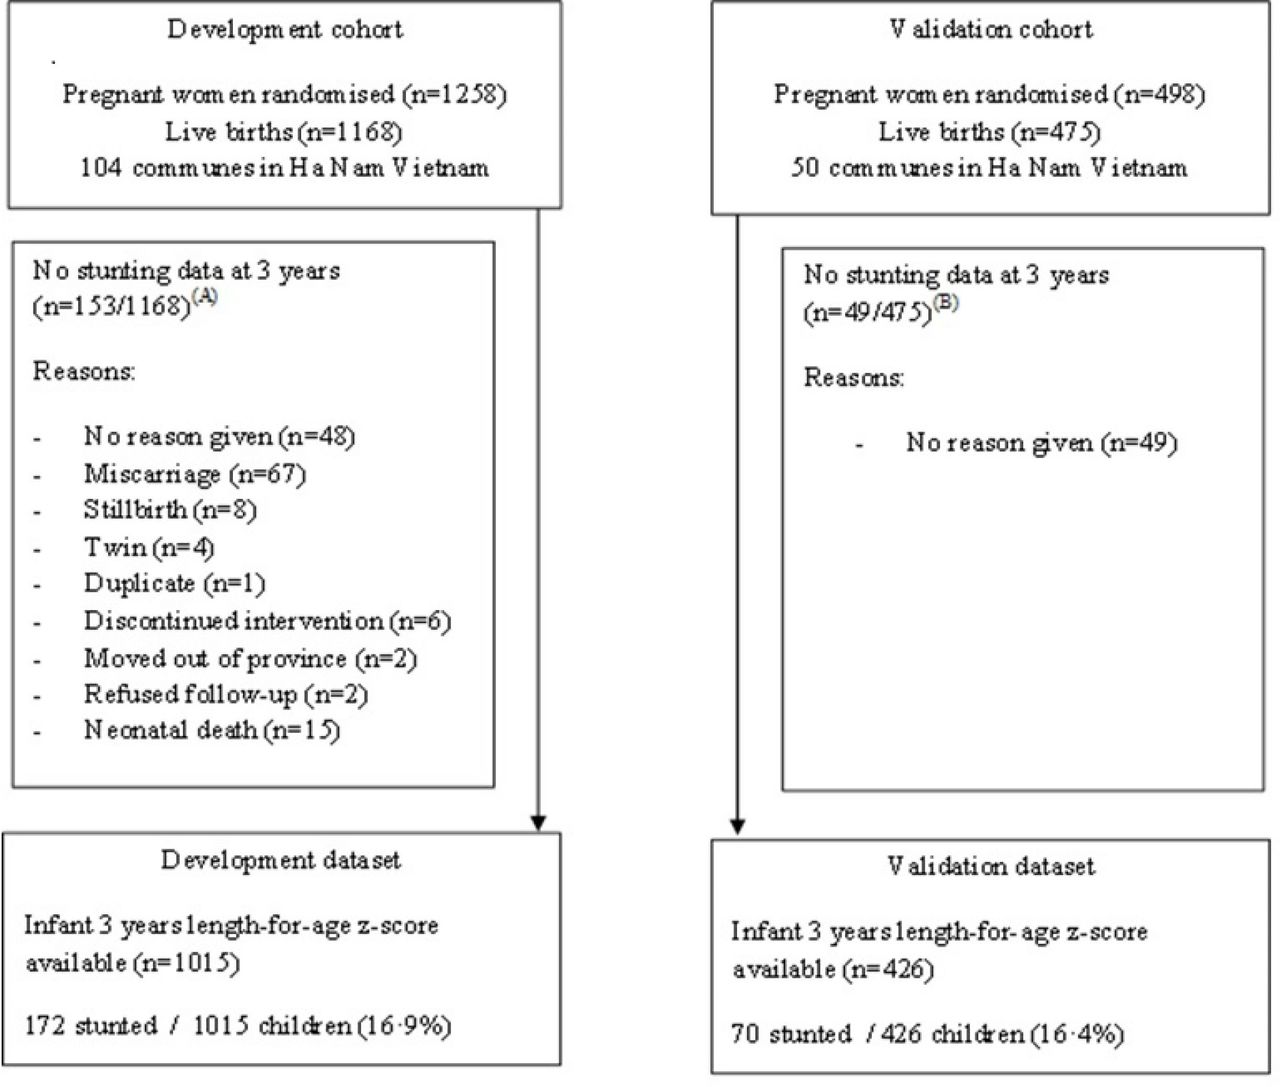
Flow chart of participants in the development and validation cohorts. (A) Of the 153 infants with no data on stunting at 3 years, 67 (43.8%) did not have information on stunting at 6 months, 75 (49.0%) were not stunted and 11 (7.2%) were stunted at 6 months. (B) Of the 49 infants with no data on stunting at 3 years, 8 (16.3%) did not have information on stunting at 6 months, 39 (79.6%) were not stunted and 2 (4.1%) were stunted at 6 months.
Univariable associations between the 33 candidate predictors and stunting at 3 years are presented in table 1 for the development data set (complete cases). A statistically significant association (P<0.05) was found for birth weight, gestational age, infant length at 6 weeks and 6 months, length-for-age z-score and stunting at 6 weeks and 6 months, stunting at 6 weeks and 6 months, weight at 6 months, and fever in the last 2 weeks at 6 months; maternal weight at 12 and 32 weeks of pregnancy and 6 months, height, MUAC at 12 weeks of pregnancy, BMI at 6 months, education, employment, and weekly weight gain enrolment to third trimester weight; and paternal weight, height, BMI, employment and household socioeconomic status. After assessing collinearity, of the 33 potentials predictors, a total of 19 final candidate predictors were put forward for the development of the multivariable birth model and 25 for the 6-month model.
Unadjusted associations between candidate predictors and stunting at 3 years of age in the development data set (n=1015)
Birth model
In the development data set, 834 (82.2%) infants with stunting information at 3 years had complete data on all 19 final candidate predictors. A comparison of the characteristics of infants with completely observed covariate data with those with any missing covariate information can be found in online supplementary table S5. After backward stepwise selection, the multivariable birth model included infant weight at birth, maternal height, maternal weekly weight gain between enrolment and third trimester weight, and paternal height based on the complete cases. In addition, the models based on multiple imputation included multigravida. No interactions were explored because the infant’s sex was not kept in any of the models (see online supplementary table S6 for more details). The final birth model that was put forward to evaluate model performance compared with the 6-month model consisted of infant weight at birth, maternal and paternal height, maternal weekly weight gain between enrolment and third trimester weight, and multigravida (table 2).
Supplemental material
Supplemental material
Multivariable logistic regression models for stunting at 3 years of age applied to the development data set (n=1015)
6-Month model
In the development data set, 778 (76.7%) of infants with stunting information at 3 years had complete data on all 25 final candidate predictors (see online supplementary table S6 for infant characteristics for those with and without missing covariate data). After backward stepwise selection, the multivariable 6-month model included maternal age at 12 weeks of pregnancy, maternal weekly weight gain between enrolment and third trimester weight, maternal haemoglobin at 32 weeks of pregnancy, gestational age at birth, infant sex, and infant length and weight at 6 months based on complete cases. The models based on multiple imputation did not include maternal age at 12 weeks of pregnancy and maternal haemoglobin at 32 weeks of pregnancy and included maternal and paternal height. In addition, the multiple imputation model which imputed both the outcome and predictors also excluded gestational age at birth (see online supplementary table S7). Interactions between the infant’s sex, weight and length at 6 months were explored but were not statistically significant. Following clinical review, the final 6-month model put forward included infant sex, gestational age, infant length and weight at 6 months, maternal and paternal height, and maternal weekly weight gain between enrolment and third trimester weight (table 2).
Supplemental material
Model performance
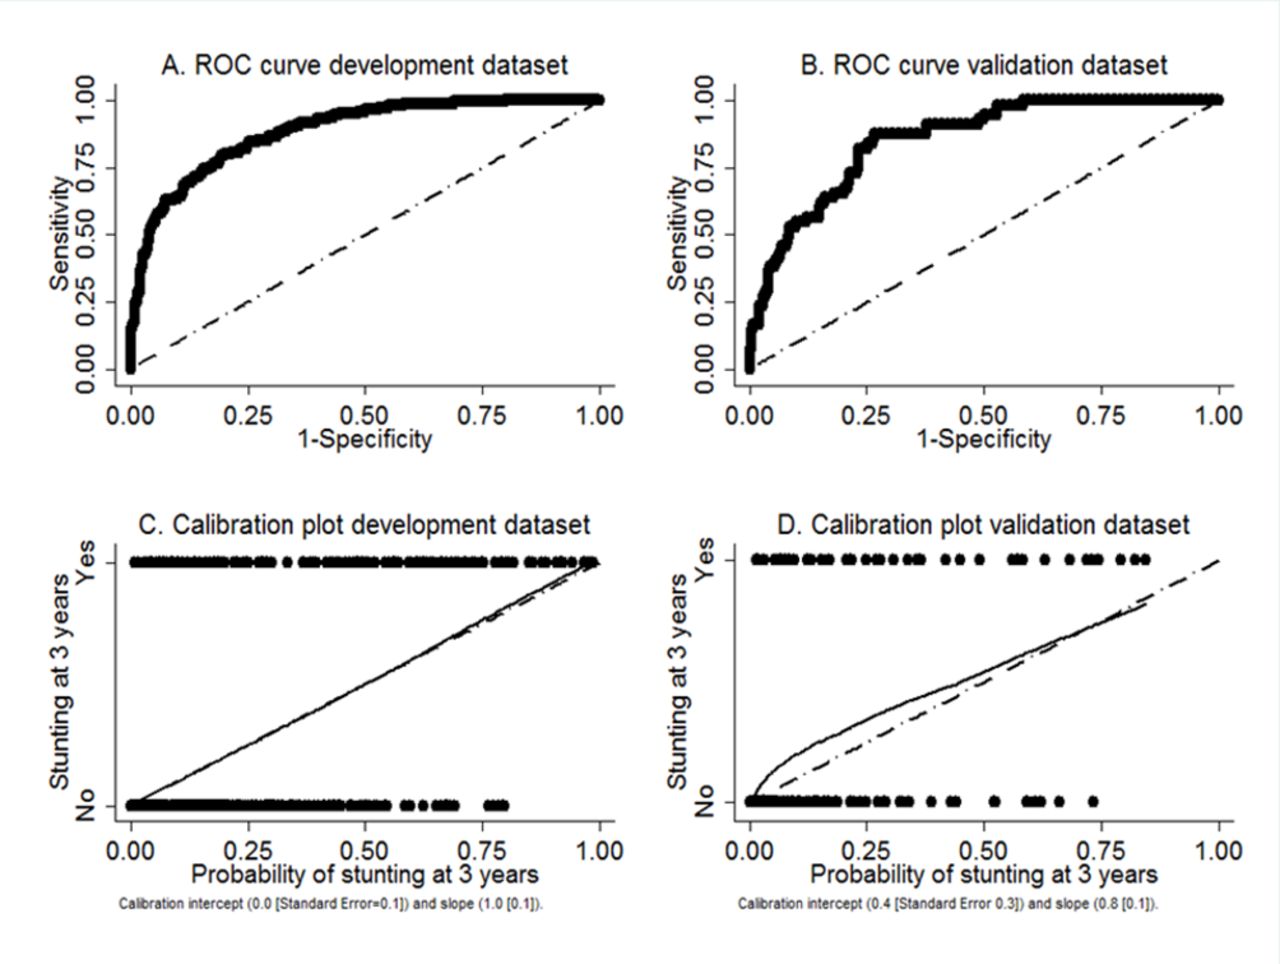
Model performance of the birth and 6-month models was initially evaluated based on the complete cases of the development data set. For both models, there was good agreement between the observed and predicted probabilities of stunting according to the Hosmer-Lemeshow test (birth model: P=0.85; 6-month model: P=0.88). The 6-month model had a higher discriminatory performance than the birth model (AU-ROC 0.88, 95% CI 0.86 to 0.91 vs 0.73, 95% CI 0.69 to 0.77, respectively, DeLong P<0.0001; see figure 2A and online supplementary figure S1 for ROC curves). Overall performance was better in the 6-month model compared with the birth model (Brier score: 0.088 vs 0.127, lower is better; see calibration plots in figure 2C and online supplementary figure S1. Based on the model performance, the 6-month model was advanced for external validation.
Supplemental material

Performance of 6-month model for the development (n=839) and validation (n=338) data sets (complete cases). ROC, receiver operating characteristics. A=ROC curve development dataset; B=ROC curve validation dataset; C= Calibration plot development dataset; D= Calibration plot validation dataset
External validation and recalibration
The observed baseline risk of stunting in the validation data set was considered clinically similar to that in the development data set (16.4% vs 16.9%, respectively). The data range of the covariates in the 6-month model, their summary statistics and missing data proportions were similar between the development and validation data sets (see online supplementary table S3). It is anticipated that all variables in the 6-month model will be possible to collect with similar precision via routine visits of the (pregnant) mother and infant to the clinic, with the added measure of paternal height. Model validation was evaluated based on the complete cases in the validation cohort (n=338/475) using the model coefficients of the complete cases in the development cohort. The overall performance improved (Brier score: 0.108 and Hosmer-Lemeshow test P=0.95). Receiver operating characteristic curves and calibration plot are presented in figure 2B and D, respectively. The discrimination performance (AU-ROC 0.85, 95% CI 0.80 to 0.90) was high. Based on the calibration curves, we recalibrated the coefficients (including the intercept) in the multivariable model by multiplying with the calibration slope.
Supplemental material
Model specification and risk groups
The final logistic model after recalibration and rounding to two decimal places is shown below:

where Pstunting is the probability for an infant aged 6 months to be stunted (ie, length-for-age z-score <−2) at 3 years of age. Sex male has value of 1 if the infant is male and 0 if the infant is female. Average maternal weekly weight gain was calculated as the difference between maternal weight at enrolment and third trimester weight, divided by the number of weeks between the two measurement time points. The coefficients were obtained by multiplying the 6-month model coefficients of the development data set (complete cases) with shrinkage factor (0.77486661).
The 6-month-old infants were stratified into high risk of stunting at 3 years of age using varied cut-offs (≥20%, ≥15% and ≥10% according to the predicted probability of being stunted at 3 years of age). Sensitivity and specificity of the tool with each cut-off are presented in table 3. When the tool was applied with a cut-off of ≥20%, the algorithm detected 82.0% (114 of 139) and 56.4% (31 of 55) of stunted infants in the development and validation data sets, respectively. Of those predicted to be at high risk of stunting, 40% and 44% were observed to be stunted at 3 years of age.
Sensitivity and specificity of tool for high-risk stunting groups in the development (n=839) and validation (n=338) data sets (complete cases), when the tool is applied at 6 months of age
An interactive Shiny app is hosted on https://step36.shinyapps.io/shinyapp to calculate the probability of stunting at 3 years of age alongside a risk classification, implementing the formula above.
Discussion
To our knowledge, this is the first report of a predictive algorithm to detect risk of stunting in early childhood. We identified seven easily measured factors that are key predictors of child stunting risk at 3 years of age in a cohort of carefully monitored Vietnamese children. These included maternal factors (height and weekly weight gain during pregnancy), infant factors (sex, gestational age, weight and length at 6 months) and paternal height. When tested in a validation model in the same rural setting, we found a concordance statistic of 0.85. Our results suggest that many Vietnamese children who are destined to be stunted at 3 years of age can be identified at the age of 6 months, raising the possibility of early targeted preventive interventions.
Although many studies have examined the risk factors for impaired child growth, no studies have specifically developed and validated a risk prediction model to identify infants at later risk of stunting. Hasegawa et al24 developed a screening tool to predict malnutrition among young children in Zambia and identified maternal age, weight-for-age z-score status, birth weight, feeding status, history of sibling death, multiple birth and maternal education level as important factors associated with child stunting in this setting. However, this study differs from ours in that data were obtained from a cross-sectional study and the tool was re-evaluated in the same data set as it was developed, as opposed to being externally validated. In addition, information on variables was collected only via semistructured interview rather than direct measurement, and the study did not take into consideration important antenatal and paternal factors.24
The Lives Saved Tool is another predictive model which has been used to estimate the impact of specified changes in key interventions on stunting among children under 5 years of age. This tool has identified a large number of interventions with either a direct or indirect impact on stunting, including zinc supplementation, education about appropriate complementary feeding and provision of food for supplementary feeding, and direct (birth outcomes) and indirect (diarrhoea incidence) pathways to stunting.25 However, although the Lives Saved Tool can be used to quantify the potential effectiveness of an intervention and set targets at a global level, this tool is unable to predict which children are at risk of stunting and fails to take into account the varying contribution and the cumulative and potentiating effects that different determinants have on stunting outcomes. The strength of our approach is that from a large array of candidate predictors, we were able to identify a small set of key variables that are routinely measured at the primary healthcare level in many countries, or that could be easily obtained.
Stunting, or linear growth failure, involves a complex interaction of genetic, household, environmental, socioeconomic and cultural influences. Although reported determinants of growth faltering after birth vary by setting, several key themes in the literature have emerged that provide support for the predictive variables in our model. First, growing evidence supports the role of maternal nutritional status on child growth outcomes. In our study, maternal height and weekly weight gain during pregnancy were identified as important predictors of a child’s future risk of stunting, and this finding is supported by a number of previous studies.26–28 Only one-fifth the heritability for adult height has been shown to be explained by genetics, and the rest is reflective of a woman’s nutrition and environment during her own early life. Shorter women are likely to have reduced protein and energy stores, smaller uterine volume, limited room for fetal development, reduced placental size and function, and decreased quantity and quality of breast milk. Paternal height was also found to be an important predictor of a child’s future growth in our study, and is similar to findings from the WHO Multicentre Growth Reference Study.29 The link between parental height and child growth highlights the transmission of undernutrition between generations30 and the importance of breaking the intergenerational cycle of chronic undernutrition and socioeconomic adversity.
Key predictive factors for stunting in our study also included infant factors such as sex, gestational age at birth, and infant weight and length at 6 months of age. Sex differences in stunting risk may be present for several reasons, including boys being more vulnerable to disease and inequalities in health than girls, differences in feeding patterns, or biological factors such as differences in sex hormones, and these findings are supported by previous studies.11 31 Although other studies have demonstrated the influence of socioeconomic adversity on the risk of stunting,32 we did not observe wealth index (as a measure of socioeconomic level) to be an important determinant of stunting in our predictive model. This may be explained by the fact that the distribution of wealth did not vary greatly between families in Ha Nam province. Although nutrition education, complementary feeding interventions and zinc supplementation have been shown to have a small but significant impact on linear growth of young children in low-income and middle-income countries,33 in our model we did not observe complementary feeding to be a significant determinant of stunting. No children in our study were recorded to have received zinc supplementation.
Other strengths of our study include the comprehensive data collected over time during both the antenatal and postnatal periods, as well as paternal factors, the large sample size and the rigorous trial design of the original cluster RCT. In addition, we have identified key predictive factors that are easy, low cost and non-invasive to measure in the field, making the tool easily accessible for primary healthcare workers in resource-poor settings that could be readily applied in different locations. The tool was developed and validated in a rapidly developing rural area, which is representative of many parts of Vietnam. Our findings may also be of relevance to other low-income and middle-income countries undergoing a similar economic transition.
We acknowledge that our model does not take into account preconception maternal and paternal nutritional status; disease morbidity for infections that may contribute to stunting (eg, recurrent diarrhoea); or information on health-seeking behaviour of mothers. Although gestational age was inversely associated with stunting risk on univariable analysis, after the inclusion of other factors we obtained a weakly positive association with probable minimal clinical significance. In addition, the use of complete cases for analysis may introduce bias as stunted children may be more susceptible to morbidity and therefore less likely to return for follow-up appointments. As the tool was developed and validated in a rural setting, it will be important to test its validity in urban locations and in other regions.
The model does not predict all children at risk of stunting, and countries using the tool would need to decide where to set the cut-offs for intervention for stunting, depending on community priorities and available human and economic resources. Further cost-effectiveness studies will assist in this decision making.
Conclusion
We have developed a tool that has important implications for the improvement of child growth in low-resource settings. First, the prediction model will enable primary healthcare workers at the community level to make a rapid assessment of the estimated future risk of stunting in a child. This will allow early preventive strategies to be put into place within the critical window of opportunity in the first 1000 days of life, a period when the greatest impact is likely to be achieved and before it is too late to change the growth trajectory. Second, the algorithm is based on standard clinical variables that are likely to be readily available at the point of assessment, and that could be collated centrally for tracking stunting risk at the national level. The development of an accessible and sustainable method for the early detection of stunting risk has the potential for a targeted prevention approach that if successful would greatly reduce the burden of child morbidity and the associated risk of chronic disease within vulnerable populations.
Supplemental material
Acknowledgments
We thank the participants and health workers in Ha Nam province, the Ha Nam Provincial Centre of Preventive Medicine, Ministry of Health, RTCCD; Alfred Pathology; and Beth Hilton-Thorp and Christalla Hajisava for departmental support.
References
Footnotes
Handling editor Seye Abimbola
SH and SB contributed equally.
Contributors SH and SB analysed the data, prepared the results, and wrote the first and subsequent drafts of the manuscript. SH, SB, JAS, JF, TDT and B-AB designed the study. SB managed the data set and performed the statistical analysis. TDT, TTTH, JF and JAS contributed to the study and survey design, and reviewed and commented on the drafts of the report. TTTH facilitated the conduct of the survey at the commune health stations. All authors approved the final submitted version of the manuscript.
Funding The study was funded by a grant from the Australian National Health and Medical Research Council (NHMRC) (Grant Number 1041988). SH is funded by an NHMRC Early Career Fellowship 1112581. JAS is funded by an NHMRC Senior Research Fellowship 1104975. B-AB was partly supported by NHMRC project grant 1131932 (the HOT NORTH initiative). The funders had no role in study design, data collection and analysis, decision to publish, or preparation of the manuscript.
Competing interests None declared.
Patient consent for publication Not required.
Ethics approval The original study protocol was approved by the Melbourne Health Human Research Ethics Committee and the Ha Nam Provincial Human Research Ethics Committee. The cluster randomised trial is registered in the Australia New Zealand Clinical Trials Registry: 12610000944033.
Provenance and peer review Not commissioned; externally peer reviewed.
Data availability statement No data are available.