Article Text

Abstract
Introduction Reducing stunting is an important part of the global health agenda. Despite likely changes in risk factors as children age, determinants of stunting are typically analysed without taking into account age-related heterogeneity. We aim to fill this gap by providing an in-depth analysis of the role of socioeconomic status (SES) as a moderator for the stunting-age pattern.
Methods Epidemiological and socioeconomic data from 72 Demographic and Health Surveys (DHS) were used to calculate stunting-age patterns by SES quartiles, derived from an index of household assets. We further investigated how differences in age-specific stunting rates between children from rich and poor households are explained by determinants that could be modified by nutrition-specific versus nutrition-sensitive interventions.
Results While stunting prevalence in the pooled sample of 72 DHS is low in children up to the age of 5 months (maximum prevalence of 17.8% (95% CI 16.4;19.3)), stunting rates in older children tend to exceed those of younger ones in the age bracket of 6–20 months. This pattern is more pronounced in the poorest than in the richest quartile, with large differences in stunting prevalence at 20 months (stunting rates: 40.7% (95% CI 39.5 to 41.8) in the full sample, 50.3% (95% CI 48.2 to 52.4) in the poorest quartile and 29.2% (95% CI 26.8 to 31.5) in the richest quartile). When adjusting for determinants related to nutrition-specific interventions only, SES-related differences decrease by up to 30.1%. Much stronger effects (up to 59.2%) occur when determinants related to nutrition-sensitive interventions are additionally included.
Conclusion While differences between children from rich and poor households are small during the first 5 months of life, SES is an important moderator for age-specific stunting rates in older children. Determinants related to nutrition-specific interventions are not sufficient to explain these SES-related differences, which could imply that a multifactorial approach is needed to reduce age-specific stunting rates in the poorest children.
- stunting
- undernutrition
- ses
- socioeconomic status
- wealth
- age
This is an open access article distributed in accordance with the Creative Commons Attribution Non Commercial (CC BY-NC 4.0) license, which permits others to distribute, remix, adapt, build upon this work non-commercially, and license their derivative works on different terms, provided the original work is properly cited, appropriate credit is given, any changes made indicated, and the use is non-commercial. See: http://creativecommons.org/licenses/by-nc/4.0/.
Statistics from Altmetric.com
Key question
What is already known?
While household socioeconomic status is widely recognised as a key determinant of stunting, little is known on how it moderates the stunting-age relationship.
What are the new findings?
Stunting rates are similar in newborn children from households of low and high socioeconomic status but diverge markedly between the sixth and 20th month of life.
Differences between children from poor and rich households cannot simply be explained by the presence or absence of determinants that are modifiable through nutrition-specific interventions but are also strongly moderated by determinants related to nutrition-sensitive interventions.
What do the new findings imply?
The relationship of socioeconomic status and stunting varies substantially with child age, highlighting the importance of considering age-specific analyses when research on determinants of undernutrition is conducted.
Reducing the high age-specific stunting rates in children from poor households may require a multifactorial approach building on both nutrition-specific and nutrition-sensitive interventions.
Introduction
The high prevalence of stunted growth (defined as height-for-age of more than two SDs below the median of a healthy reference population), with nearly one in four children worldwide affected and insufficient progress to meet internationally agreed-on targets,1 2 is a major challenge for the global health community. Two influential The Lancet series have identified a range of key interventions for the reduction of undernutrition with a particular emphasis on a ‘window of opportunity’ of 1000 days from conception to 2 years of age.3–5 Part of the motivation to focus on this stage of development stems from the observation that height-for-age z-scores rapidly decline during the first 2 years of life and tend to remain rather stable thereafter.6 7
While broad agreement exists on the importance of reducing stunting for child development,8 criticism has been raised about a disproportionate focus on behavioural interventions to tackle the problem of undernutrition.9 This is despite the observation that determinants that are likely to capture the broader socioeconomic environment faced by mothers and children are more robustly related to children’s nutritional status than direct mother-level or child-level determinants.10 11 Surprisingly, despite the importance of the socioeconomic environment, the moderating effect of income or household socioeconomic status (SES) for the age pattern of stunting or, alternatively, height-for-age z-scores (HAZ) has not been systematically described. Existing studies are largely limited to rough split-sample analyses and only a small set of countries.12–21 While Alderman and Headey22 make use of a much larger data set, consisting of Demographic and Health Surveys (DHS) implemented in 57 countries, to describe various determinants of HAZ in children below the age of 5 years, they limit their focus to seven age groups and only base their analysis on SES terciles rather than quartiles. Both aspects are likely to obscure important nuances in the relationship of SES and age-specific stunting prevalence. Using a similar sample, Rieger and Trommlerová23 provide graphical representations for the age-specific relationship between HAZ and a range of relevant determinants, including household wealth quartiles, but neither examine SES-related patterns in detail nor investigate potential variability across world regions or income groups. Moreover, none of these studies discusses how different age patterns of stunting rates in children from low-SES versus high-SES households can be explained by the presence or absence of modifiable risk factors.
Given the limitations of the extant literature, our study aims to add to the scientific discourse in three major ways: first, we graphically analyse the age profile of stunting in children aged 59 months and younger and highlight important nuances in age-specific stunting rates which could be overlooked if the ‘critical window of opportunity’ of 1000 days is understood as a uniform stage of development. To this end, we assembled a very large data set of 72 DHS, substantially exceeding the geographic coverage of previous analyses of this type.6 7 Second, we provide an in-depth analysis of household SES as a moderator for the observed stunting-age pattern and investigate how these profiles differ across country income groups and world regions. Third, we show how observed differences in age-specific stunting rates are attenuated once the presence or absence of important modifiable determinants of undernutrition is accounted for.
Methods
Data sources
The data for the present analysis were obtained from recent DHS conducted in a total of 72 countries.24 Started in 1984, DHS are an ongoing project, administered by ICF International, and yield nationally representative cross-sectional data for women aged 15–49 as well as their children below the age of five.25 We downloaded all available surveys conducted before 28 September 2017 and dropped all survey rounds that did not include a module on anthropometric measurement for children below the age of five. From the remaining set of surveys, we limited the attention to the latest survey by country to ensure that the information presented in this article is as recent as possible.
Outcome measures
The outcomes of this study were stunting and severe stunting, which indicate low or very low height-for-age and are often interpreted as measures of chronic undernutrition. DHS applied a standardised protocol for the assessment of height to ensure comparability across countries26: following WHO guidelines, enumerators were instructed to measure children below the age of 24 months in a lying position and children aged 24 months or more in a standing position. If, despite this rule, a child below the age of 24 months was measured standing up instead of lying down, 0.7 cm were added to measured height, while 0.7 cm were subtracted if a child aged 24 months or older was measured lying down. Measurement was conducted using a wooden measurement board and height values were recorded with a precision of 1 mm. To ensure data quality, enumerators were provided with at least 3 days of training on the correct measurement of height and received feedback from team supervisors during data collection in case data quality issues occurred.
DHS routinely report HAZ based on the 2006 WHO reference population27 for surveys conducted in 2007 or later, using child age calculated from the day of interview and the day of birth. Since not all countries included in our analysis had surveys conducted after 2006, relying on z-scores reported by DHS only would have resulted in a reduction in sample size. Instead, we calculated HAZ based on the WHO reference population directly with the Stata macro ‘igrowup_stata’28 using the same input information as DHS. Children were then classified as stunted if their height-for-age was at least two SDs below the median of the WHO reference population (ie, z-score less than −2) and as severely stunted if the z-score was smaller than −3 (z-scores below −6 or above 6 were considered implausible and dropped from the analysis).
For data collected in Nepal (representing 0.5% of the analysis sample), exact child age could not be calculated due to inconsistencies in calendar formats, such that we made use of HAZ reported by DHS. Similarly, where DHS did not report the exact dates of interview and birth but still reported HAZ based on the WHO reference population, these were used directly (6.6% of cases in analysis sample). Finally, in 3.4% of cases, neither the exact date of birth/interview nor HAZ were available and we calculated z-scores using rounded age in months, which was reported in all surveys. We assessed the sensitivity of our core results to the exclusion of children for whom z-scores were calculated based on rounded age.
Main independent variables
To display stunting rates by age in the main analysis, we rounded the precise child age to the nearest integer (ie, full months) or made use of rounded age in months as reported by DHS if the precise age was unavailable. In additional analyses, we further used 12 age groups. With the exception of the last age group, intervals were defined such that the lower end always contained its limit while the upper end did not. The following age groups were created (in months): ‘0 to less than 5’, ‘5 to less than 10’, ‘10 to less than 15’, ‘15 to less than 20’, ‘20 to less than 25’, ‘25 to less than 30’, ‘30 to less than 35’, ‘35 to less than 40’, ‘40 to less than 45’, ‘45 to less than 50’, ‘50 to less than 55’ and ‘55 to 59’.
Household SES was derived by calculating a survey-specific asset index from a principal component analysis of the following assets: electricity, radio, television, refrigerator, bicycle, motorcycle, car, phone, as well as binary measures for floor quality, wall material and roof material. Similar asset indices have been used in the past by us and others.29–31 To construct the index, we made use of the first principal component only, as is standard practice.32 Calculations were conducted using the Stata command factor (Stata V.14). As the number of missing values varied across surveys, we excluded assets on a survey-specific basis if more than 2% of observations exhibited a missing value or if the item was either present in all or none of the households. The validity of this approach was assessed in a sensitivity analysis based on an alternative 5% cutoff. Finally, households were grouped into survey-specific SES quartiles using the created asset index. Of these, the SES-specific analysis focused on the poorest and richest quartile only.
Statistical analysis and covariates
In order to illustrate the age-specific relationship of relative wealth and anthropometric failure, we pooled all surveys and graphically depicted stunting and severe stunting prevalence by age in months and SES quartile. Moreover, we repeated this exercise grouping countries by World Bank income classification at the beginning of a survey as well as six World Bank regions (using the 12 age groups rather than age in months to ensure statistical power).
In addition to this descriptive exercise, we sought to explain SES-related differences in stunting patterns by estimating linear probability models. To this end, we built on the framework of the Scaling-up Nutrition Movement33 and distinguished between determinants that are modifiable by nutrition-specific interventions and those modifiable by nutrition-sensitive interventions. Nutrition-specific interventions aim to address immediate determinants of undernutrition, such as adequate food and nutrient intake, parenting practices and the absence of infectious diseases.34 In contrast, nutrition-sensitive interventions focus on the underlying determinants of undernutrition, including food security, caregiving resources, healthcare infrastructure and access as well as environmental aspects such as hygiene and drinking water safety.34
In the category of determinants that are modifiable by nutrition-specific interventions, we considered whether a child was breast fed within the first hour after birth, ever received vitamin A supplements, took iron supplements in the last 7 days before the interview, was administered drugs for intestinal parasites in the last 6 months or has received the BCG vaccination as well as the first diphtheria, pertussis and tetanus vaccination. Moreover, we considered whether the stool of the last-born child is disposed safely and if the household uses non-solid fuels for cooking, as these are likely to capture healthcare behaviour and parenting practice.
As determinants related to nutrition-sensitive interventions, we considered whether the household has access to a high-quality water source and adequate sanitation, whether the child was delivered in a health facility (rather than at home), as well as the mother’s educational level, given that education is likely to influence the income-generating capability of the household and thus improve food security. The choice of indicators was based on previous studies10 11 assessing the relative importance of stunting determinants and on data availability. A detailed definition of each indicator is provided in the online supplementary appendix table S1.
Supplemental material
The degree to which these determinants are able to explain SES-related differences in undernutrition patterns was assessed with the help of linear probability models with age group–SES interaction terms (and their main effects) and by predicting the difference in the age group-specific stunting profile for the poorest and the richest quartile. Similarly, all previously mentioned determinants were included both as main effects and age group interaction terms to allow for age-specific effects. Moreover, given the potential for confounding at the regional or country level, all regression models were adjusted for survey-level fixed effects. We further adjusted for the urban versus rural location of households (which may potentially overlap with household SES), the number of children ever born to the mother, the sex of the child and whether the child is a twin. As for household SES, survey fixed effects and all control variables were included as main and interaction effects to guard against age-specific confounding. Finally, we present additional data on the bivariate association of maternal education and SES quartiles, because education has previously been described as a proxy for SES.35
Since not all surveys featured the full range of covariates, we distinguished between a main analysis sample, which was used for descriptive analyses, including the full number of countries and children, and a reduced adjusted sample, which was used for the regression analyses only. In all cases, SEs were adjusted for clustering at the primary sampling unit level. In DHS, these were typically defined as enumeration areas used in a country’s population census.25 While presented results are unweighted in this article, the online supplementary file 1 provides an additional sensitivity analysis using sampling weights. Weights were rescaled to make their sum equal to the total population in 2016 for each country, such that each country entered the average with its global population share.
Results
Sample description
The sample deduction steps are depicted in figure 1. The initial sample contained 599 834 children (excluding those above the age of 5 years) from 72 countries. A total of 160 771 observations were lost because children lacked anthropometric or age data (in months) entirely, and only 10 665 observations were lost because measured values were biologically implausible. We further excluded 12 217 observations with missing asset scores. The availability of assets was generally very good for the included observations, with 61.2% of assets scores being based on the full range of assets and 95.0% on at least nine assets. The resulting main analysis sample consisted of 416 181 observations from 72 countries. For the regression analysis (‘adjusted sample’), the inclusion of covariates caused an additional reduction of sample size by 248 658 children. A full list of included surveys is provided in the online supplementary appendix table S2.
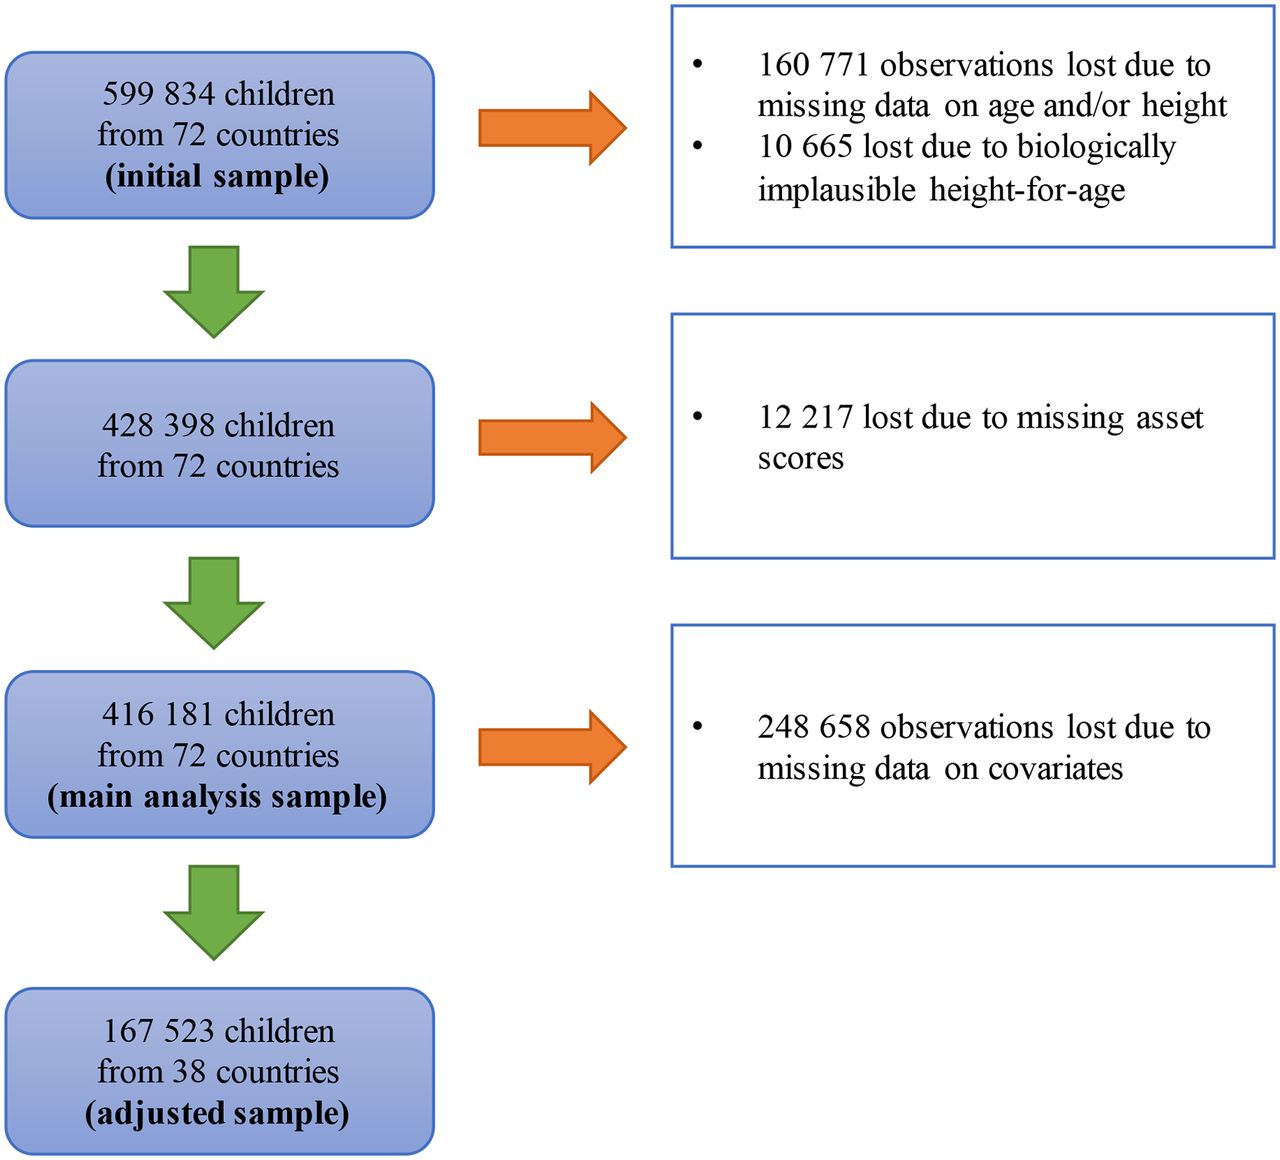
Sample selection.
A comparison of key sample statistics for the initial sample, the main analysis sample and the adjusted sample is presented in table 1. While the initial sample and the main analysis sample are similar with respect to the covered years and world regions, the adjusted sample contains slightly more recent data (no observations surveyed before 2005) and no observations from the Middle East and North Africa (compared with 8.3% in the initial sample). Nevertheless, key child-level, maternal-level and household-level statistics are similar across samples.
Sample comparison
Global undernutrition patterns by age and household SES
Age group: less than 6 months
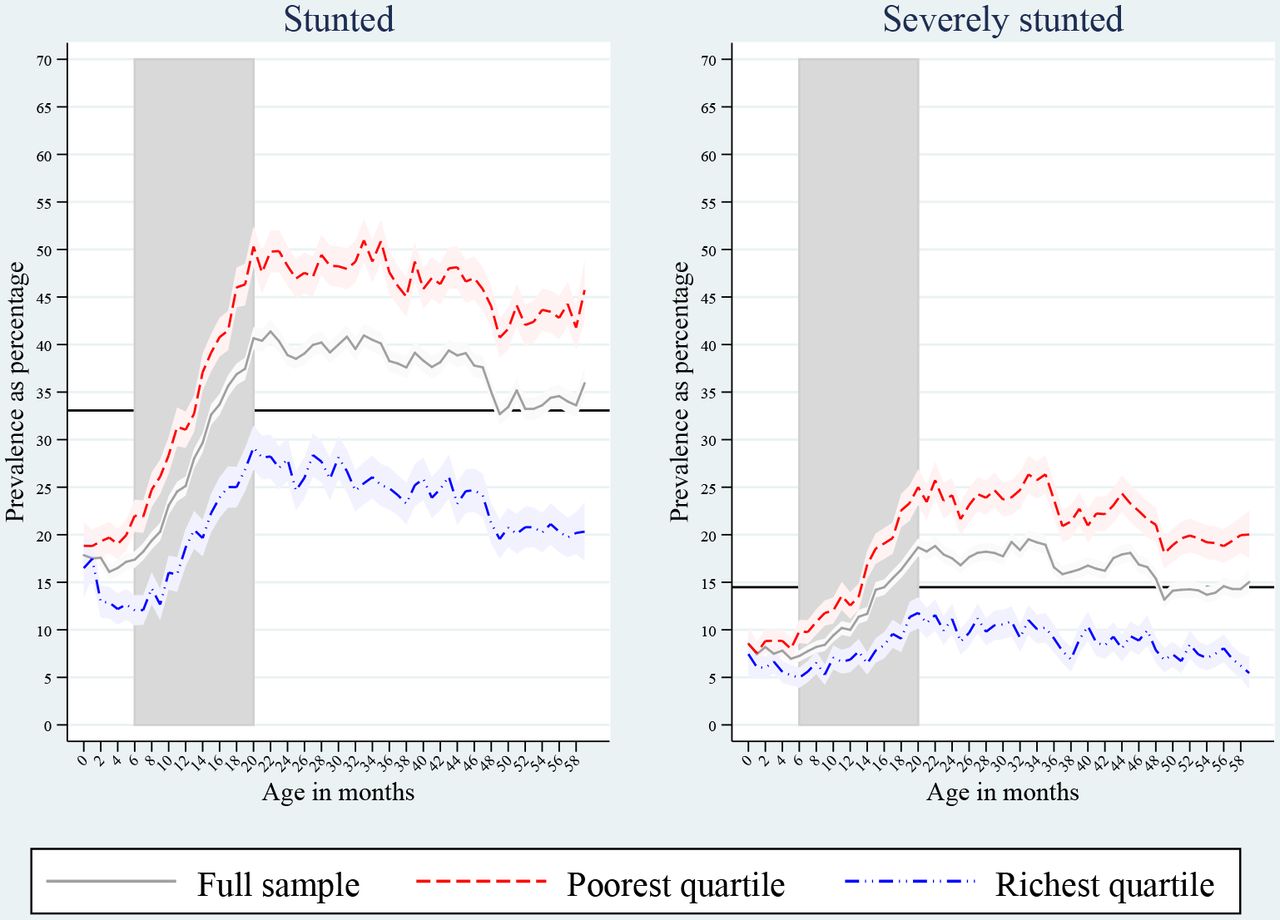
In children younger than 6 months, stunting prevalence varies slightly from 16.1% (95% CI 15.2% to 16.9%) to 17.8% (95% CI 16.4% to 19.3%) (see figure 2 for graphical depiction and online supplementary appendix table S3 for exact numbers), and we do not observe substantial differences between children living in households of the poorest quartile (with stunting ranging from 18.8% (95% CI 16.3% to 21.4%) to 20.0% (95% CI 18.3 to 21.6%) in the first 5 months) and those from the richest quartile (with stunting ranging from 12.2% (95% CI 10.5% to 13.8%) to 17.5% (95% CI 15.4% to 19.5%)). Similar patterns are observed for severe stunting with predicted prevalence in the first 5 months of life ranging from 7.0% (95% CI 6.4% to 7.5%) to 8.5% (95% CI 7.5% to 9.6%) for the full sample, from 7.6% (95% CI 6.4% to 8.7%) to 8.9% (95% CI 7.7% to 10.0%) for the poorest quartile and from 5.2% (95% CI 4.1% to 6.3%) to 7.4% (95% CI 5.2% to 9.7%) for the richest quartile. Qualitatively identical results are obtained when all surveys are weighted by each country’s population size (online supplementary appendix figure S1).

Prevalence of stunting and severe stunting as percentage by age and SES. Light bands indicate 95% CI. Horizontal lines show grand means across age groups and wealth quartiles. Vertical bands highlight the age range 6–20 months.
Age group: 6–20 months
In the age group 6–20 months (shaded area in figure 2), overall stunting prevalence has a marked tendency to be higher in older than in younger children. For instance, while only 17.4% (95% CI 16.5% to 18.2%) of children aged 6 months were stunted, prevalence reached 40.7% (95% CI 39.5% to 41.8%) in those aged 20 months. Similarly, severe stunting prevalence is more than twice as high when comparing the latter group to the former (7.2% (95% CI 6.7% to 7.8%) versus 18.7% (95% CI 17.7% to 19.6%)). With respect to the role of household SES, we make two important observations: first, both the poorest and the richest quartile feature higher undernutrition rates in children aged 20 months compared with those of 6 months of age. Second, these differences are most pronounced in the poorest quartile, with stunting prevalence ranging from 22.0% (95% CI 20.3% to 23.7%) in children aged 6 months to 50.3% (95% CI 48.2% to 52.4%) in those aged 20 months for the poorest quartile (or from 9.8% (95% CI 8.6% to 11.0%) to 25.0% (95% CI 23.1% to 26.9%) in case of severe stunting), compared with 12.1% (95% CI 10.5% to 13.6%) vs 29.2% (95% CI 26.8% to 31.5%) for the richest quartile (or 5.0% (95% CI 3.9% to 6.0%) vs 11.8% (95% CI 10.1% to 13.4%) in case of severe stunting). Again, very similar patterns are observed when weighting surveys by countries’ population sizes (online supplementary appendix figure S1).
Age group: 21–59 months
In children aged 21–59 months, we do not find (severe) stunting rates to notably exceed those measured in children of 20 months of age. Instead, both for the full sample and for the quartile-specific analysis, stunting rates tend to be smaller in children aged 4 years and older (40.4% (39.2;41.6) in month 21 compared with 35.9% (34.2;37.6) in month 59 in the full sample). Despite this pattern—with the exception of the richest quartile in the case of severe stunting—undernutrition prevalence in children aged 21–59 months is always larger than that observed in children shortly after birth. Moreover, the gap in stunting prevalence between poor and rich children observed in children of 20 months of age, exists to a similar extent in those aged 21–59 months. Again, this pattern is confirmed when using population figures as sampling weights (online supplementary appendix figure S1).
Sensitivity to methodological choices
We investigate the sensitivity of these results to key methodological choices in the online appendix. In the online supplementary appendix figure S2, we show how predicted stunting rates would differ (compared with figure 2), if we excluded the 3.4% of children for whom stunting rates could only be calculated based on rounded age. Moreover, in the online supplementary appendix figure S3, we investigate changes in prevalence occurring when a 5% tolerance of missing values is applied for the calculation of the asset index rather than the 2% cut-off used for the main analysis. Accordingly, in both sensitivity tests, the resulting predicted prevalence deviates from the pattern shown in figure 2 by less than ± 1 percentage points in all age groups and subsamples.
Variability across countries
In figure 3, we show predicted stunting prevalence for the full sample as well as by SES separately for low-income countries (LICs) and middle-income countries (MICs). While stunting prevalence is overall higher in LICs compared with MICs, the two country groups exhibit patterns that are similar to what is observed in the pooled sample. Importantly, in both LICs and MICs, differences between the poorest and the richest quartile are small in the first 5 months of life but are larger in children aged 20 months. Analogous results for severe stunting are provided in the online supplementary appendix figure S4.

Prevalence of stunting by country income group. Light bands indicate 95%CI. Horizontal lines show grand means across age groups and wealth quartiles. Vertical bands highlight the age range 6–20 months. LICs, low-income countries; MICs, middle-income countries.
We further divide the sample into six World Bank regions (East Asia and Pacific, Europe and Central Asia, Latin America and the Caribbean, Middle East and North Africa, South Asia, Sub-Saharan Africa) in the online supplementary appendix figures S5 to S10. As for the pooled sample, we find in all regions that stunting rates are lower during the first 5 months of life than in children aged 20–25 months. Finally, with the exception of East Asia and Pacific, where only a relatively small sample size (N=17 882) is available, we find stunting rates to be similar for the poorest and richest quartile in the first age group, with a clear subsequent divergence in stunting rates.
Differences between rich and poor households
A potential reason for the difference in stunting rates in children from poor and rich households is the presence or absence of determinants that are modifiable by nutrition-specific and nutrition-sensitive interventions. We present in table 2 differences in predicted stunting prevalence between the lowest and richest quartile by age group based on a reference model only adjusted for survey fixed effects, household location and the maternal-level and child-level characteristics mentioned in the Methods section (all interacted with age group), a model that additionally controls for determinants modifiable by nutrition-specific interventions and a model further adjusted for determinants modifiable by nutrition-sensitive interventions. Again, we find that differences in predicted stunting levels are small in the first age group but higher for older children regardless of model choice. Accounting for determinants modifiable by nutrition-specific interventions is associated with a moderate reduction in the difference between children from poor and rich households compared with the reference model. Overall, the absence or presence of these factors explains less than one-third of the gap between children from poor and rich households in all age groups. In contrast, when additionally adjusting for determinants modifiable by nutrition-sensitive interventions, we find that attenuation effects strictly increase for all age groups, reaching up to 59.2% in the age group 45 months to less than 50 months. Across age groups, maternal education is moderately associated with SES (Cramér’s V=0.25; see online supplementary appendix table S4 in for full cross-tabulation).
Differences in predicted stunting levels for poorest and richest quartile
Discussion
This study describes age and wealth patterns of stunting among 416 181 children based on DHS conducted in 72 countries. Similar to previous studies,6 7 we find that, during the first 2 years of life, older children tend to exhibit much larger stunting rates than younger ones. In particular, we observe strong differences in undernutrition rates between children aged six and 20 months, while no notable differences exist between children younger than 6 months. Moreover, although the richest and poorest quartile perform similarly during the first 5 months, differences in stunting prevalence between children aged 6 and 20 months are substantially more pronounced for the poorest quartile. Despite differences in the extent and the exact onset of this divergence, the pattern is surprisingly robust across World Bank income groups and regions. Finally, we build on the framework of the Scaling-up Nutrition Movement33 and show that adjusting for determinants modifiable by nutrition-specific interventions is associated with a small to moderate attenuation of the age-specific wealth quartile difference in stunting rates. In contrast, when additionally controlling for determinants modifiable by nutrition-sensitive interventions, we observe a much larger mitigation of stunting differentials in all age groups.
There is a broad consensus that the first 1000 days after conception constitute a critical period for the prevention of undernutrition.3–5 While the overall age patterns identified by the present study support this notion, it is worth stressing that, given the important nuances in the age profile of stunting in children below the age of 2 years, more attention should be devoted to the health and living conditions occurring at various developmental stages rather than treating the first 1000 days as a uniform stage of development. Moreover, SES is a key moderator for the stunting-age pattern, as the differences in prevalence between children aged up to 6 months versus 20 months or older are substantially lower for the richest quartile than for the poorest quartile. Large SES-related differences in child undernutrition rates hence do not appear to be the result of intrauterine growth retardation but tend to develop later when children are directly exposed to the household’s living conditions. Unfortunately, socioeconomic inequalities in stunting have been shown to be highly persistent across time,36 and our regression-based results suggest that determinants modifiable by nutrition-specific interventions on their own are not associated with a substantial attenuation in stunting rate differentials. Instead, differences between the poorest and richest quartile were mitigated by up to 59.2% once we additionally accounted for determinants modifiable by nutrition-sensitive interventions. While such an exercise does not represent causal evidence, this result and previous evidence on age-pooled data10 11 suggest that stunting is a complex phenomenon and it might require a multifactorial approach to overcome the high undernutrition rates observed in the socioeconomically disadvantaged.
Several limitations apply to this study. While DHS made use of standard protocols for anthropometric measurement in order to ensure cross-country comparability, an analysis of survey data from 52 countries collected between 2005 and 2014 revealed that quality differences exist across surveys, although no systematic patterns by World Bank region or income group were identified.26 Moreover, as DHS do not contain information on income, we used household assets to derive socioeconomic status, which may have caused us to miss out certain dimensions of relative poverty. With that said, since the pioneering work of Filmer and Pritchett,32 who have shown that asset-based measurement can provide a valid proxy for household wealth in the absence of income or expenditure data, the use of asset indices has become a widely spread practice. A further limitation is the loss of observations in the sample deduction process, which limits the geographic representativeness of this study. In particular, no observations from the Middle East and North Africa were available for the analysis of determinants related to nutrition-specific and nutrition-sensitive interventions. Nevertheless, we showed that key characteristics on the child, maternal and household level stayed very similar despite the exclusion of missing values.
Moreover, we are constrained to the analysis of cross-sectional data. Hence, in order to be able to interpret the identified patterns as trends, we would need to assume that children in older age groups represent the future state of children who are currently younger. However, given that relatively few changes in the nutrition-related environment can be expected over the course of a maximum of 5 years, we consider this assumption plausible. The use of observational data further implies that the assessment of the attenuation effect of determinants modifiable by nutrition-specific vs nutrition-sensitive interventions does not necessarily represent causal mechanisms. Lastly, the choice of these determinants is limited by data constraints. While a previous study found dietary diversity to be important,10 we did not construct a comparable measure given the varying availability of nutritional data across different DHS. This limitation also implies that it was not possible to account for exclusive breastfeeding without imposing strong assumptions.
Conclusion
We highlight important patterns of age and SES as moderators for stunting in children younger than 5 years. Our results show that the window of opportunity during the first 1000 days since conception is not a uniform stage of development but rather contains important nuances with respect to the exact timing of growth faltering, which does not appear to start before the sixth month of life, as well as to the performance of children from relatively poor and rich backgrounds. Studies analysing SES as a determinant of stunting need to take this heterogeneity into account, rather than pooling children into large age groups. Moreover, we argue that a stronger focus of the nutrition community on a multifactorial approach, building on both nutrition-specific and nutrition-sensitive interventions, may help to reduce age-specific stunting rates in children of low SES.
References
Footnotes
Handling editor Douglas James Noble
Contributors CB, SV and SVS jointly conceptualised the study. CB analysed the data and drafted the manuscript. CB, SV and SVS contributed to the interpretation of results and writing.
Funding The authors have not declared a specific grant for this research from any funding agency in the public, commercial or not-for-profit sectors.
Competing interests None declared.
Patient consent for publication Not required.
Ethics approval For this type of study ethics approval is not required as all analyses have been conducted with
publically available secondary data.
Provenance and peer review Not commissioned; externally peer reviewed.
Data sharing statement All data are open access and can be obtained from https://dhsprogram.com