Article Text

Abstract
Background Responsible for considerable global human morbidity and mortality, Aedes aegypti and Ae. albopictus are the primary vectors of several important human diseases, including dengue and yellow fever. Although numerous variables that affect mosquito survival and reproduction have been recorded at the local and regional scales, many remain untested at the global level, potentially confounding mapping efforts to date.
Methods We develop a modelling ensemble of boosted regression trees and maximum entropy models using sets of variables previously untested at the global level to examine their performance in predicting the global distribution of these two vectors. The results show that accessibility, absolute humidity and annual minimum temperature are consistently the strongest predictors of mosquito presence. Both vectors are similar in their response to accessibility and humidity, but exhibit individual profiles for temperature. Their mapped ranges are therefore similar except at peripheral latitudes, where the range of Ae. albopictus extends further, a finding consistent with ongoing trapping studies. We show that variables previously identified as being relevant, including maximum and mean temperatures, enhanced vegetation index, relative humidity and population density, are comparatively weak performers.
Results The variables identified represent three key biological mechanisms. Cold tolerance is a critical biological parameter, controlling both species’ distribution northwards, and to a lesser degree for Ae. albopictus which has consequent greater inland suitability in North America, Europe and East Asia. Absolute humidity restricts the distribution of both vectors from drier areas, where moisture availability is very low, and increases their suitability in coastal areas. The latter is exacerbated by accessibility with increased likelihood of vector importation due to greater potential for human and trade movement.
Conclusion Accessibility, absolute humidity and annual minimum temperatures were the strongest and most robust global predictors of Ae. aegypti and Ae. albopictus presence, which should be considered in control efforts and future distribution projections.
- environmental health
- public health
- arboviruses
This is an open access article distributed in accordance with the Creative Commons Attribution Non Commercial (CC BY-NC 4.0) license, which permits others to distribute, remix, adapt, build upon this work non-commercially, and license their derivative works on different terms, provided the original work is properly cited, appropriate credit is given, any changes made indicated, and the use is non-commercial. See: http://creativecommons.org/licenses/by-nc/4.0/.
Statistics from Altmetric.com
Key questions
What is already known?
Aedes aegypti and Ae. albopictus are two important vectors of global diseases, including dengue, Zika, yellow fever and Chikungunya.
Numerous mapping exercises have been conducted with limited consensus on key drivers.
What are the new findings?
Accessibility, absolute humidity and annual minimum temperatures are consistently the strongest predictors of the presence of both species of vectors.
Variables previously identified as being relevant, including maximum and mean temperatures, enhanced vegetation index, relative humidity and population density, are comparatively weak performers.
What do the new findings imply?
Vector monitoring policy and disease risk mapping can use these key global drivers in future modelling efforts for control.
Introduction
Mapping of vectors and disease is a continuing process requiring evaluation of environmental and social factors that contribute to successful establishment or transmission.1–3 Two major mosquito vectors, Aedes aegypti and Ae. albopictus, which are responsible for the transmission of globally important diseases such as dengue, Zika, yellow fever and Chikungunya, have been studied and mapped at regional and global scales.4–9 These studies collectively use a range of different environmental and anthropogenic predictors to understand their distributions, which creates differences and additional uncertainties in the findings between map outputs. As these vectors are responsible for considerable disease and cost burden,10 exploring the predictive performance of current variables and establishing the strongest spatial drivers can aid global policy in the targeting of interventions and allocation of resources for national vector control programmes.
Multiple factors determine vector presence, population size and carrying capacity. Due to their short and complex life-cycles, a multitude of environmental parameters have been proposed to be critical to population establishment and successful reproduction in a location.11–13 Many of these parameters come from studies which examined epidemiological endpoints where these are assumed to be a proxy of vector abundance, including temporal correlations which have been observed between dengue incidence and temperature,14 15 rainfall,16 17 wind17 18 and humidity19 20 across a variety of case study sites. Overall, three general variable groupings have been identified as being critical to vector establishment: temperature, moisture availability and anthropogenic indicators which demonstrate host availability.
Temperature is known to be critical as it detrimentally affects both species’ poikilothermic and small-bodied physiology at the aquatic larval stages,20–22 with critical isothermal limits inhibiting emergence to the adult stage altogether.7 23 Additional variables explored include daily, monthly and annual minimum, mean and maximum air temperature, and diurnal range.24–28 Another key temperature group that affects population regulation is ground and surface temperatures, which can significantly prolong or shorten life expectancy as vectors at immature stages are often restricted to small, cryptic habitats with strong density dependence effects.21 29 This is further complicated by the vectors’ unimodal response to temperature, egg overwintering behaviour, anthropogenic microclimates and secondary effects of temperature-driven stage transition.30 31
Another important group is moisture availability. Although hygrosensation and desiccation avoidance are still understudied in insects, parameters such as rainfall and humidity are known to cause regional variation in the distribution of both species and restrict their ability to establish. The relationship between rainfall and mosquito populations is multifaceted, contributing to habitat creation and larval mortality.32 Evidence both supports and contradicts the role of rainfall in vector establishment, especially during disease outbreaks,33–35 where complex precipitation patterns, surface water dynamics and a diversity of time lags affect the local vector population size.36–38 Another disputed proxy of moisture availability affecting these species is relative humidity, which is thought only to affect behavioural or survival vector changes at the extremes.12 39 As a ratio measure of actual and saturated vapour pressure, relative humidity is strongly dependent on temperature, making comparisons of similar humidity values in different locations difficult to interpret.40 Other studies have thus proposed alternate quantifiable proxies such as absolute humidity and vapour pressure as covariate candidates for vector survival or dengue incidence.20 41–43 Further alternatives include the number of wet days and vegetation indices such as the normalised difference vegetation index and enhanced vegetation index (EVI), which represent habitat stability and reduced desiccation risk.44
The final group is a factor that complicates all climatic measures. Both vectors show thermal regulation behaviour and avoidance of unsuitable temperatures, where their anthropophilic nature,45 indoor resting and exploitation of artificial habitats such as water tanks46 increase their proximity around hosts. Ongoing urban expansion is therefore likely to increase the availability of sheltered habitats for either vector to establish where adequate temperatures, artificial pools and host presence will enhance their survival and reproduction rates. This may even be observed in areas where the host density was previously low,47 necessitating the inclusion of a variable which represents anthropogenic space.
The heterogeneity of variables explored across local studies is reflected in spatial analyses and models used to estimate Ae. aegypti and Ae. albopictus distributions. At the global scale, Khormi and Kumar6 used CLIMEX to estimate the distribution of Ae. aegypti using a range of variables including maximum and minimum monthly temperatures, precipitation and relative humidity. Kraemer et al 44 then estimated the global distribution of Ae. aegypti and Ae. albopictus using boosted regression trees (BRTs) with EVI, minimum relative humidity, cumulative precipitation, urban classification and temperature suitability maps published by Brady et al 5 as covariates. At a regional scale using different sets of WorldClim variables, Fischer et al 48 and Cunze et al 7 examined the limits of Ae. albopictus in Europe using maximum entropy models (MaxEnt), with similar analyses performed for Italy49 and Pakistan.50 Both Caminade et al 51 and Proestos et al 9 also explored the presence of Ae. albopictus in Europe, with the former using sigmoidal functions for temperature, minimum and maximum temperature, and precipitation, and the latter using temperature, precipitation and relative humidity criterion. Recently, Ducheyne et al 52 published suitability maps for both vectors across the understudied Eastern Mediterranean region, citing the importance of precipitation and host availability.
Mapping studies that fail to add the most important determinants can lead to confounded and spurious results, and to date no study has considered all variables identified as potentially explanatory in local and laboratorial findings. To consolidate previous modelling efforts and resolve inconsistencies between them, we test the predictive power of a large set of proposed environmental and anthropogenic factors, identified by previous mapping efforts or local studies as potential factors enhancing or limiting survival or fecundity. In doing so, we explore assumptions held over the importance of variables such as relative humidity, EVI, rainfall and diurnal ranges of temperatures. We aim to ascertain the top performers among temperature, moisture and host availability indicators which can provide insight into the key biologically limiting factors that inhibit the vectors’ overall spread and show the predictive ability of very similar variables which would otherwise be competing for explanatory power. We carried out the analyses by evaluating the performance of these covariates in different candidate sets of temperature, moisture availability and anthropogenic variables using an ensemble of BRTs and MaxEnt models. Our final goal is to produce maps of vector suitability based on the most optimal set of covariates identified.
Methods
Two modelling exercises were carried out using BRTs and MaxEnt, which are modelling techniques used to estimate species distributions by examining the relationships between recorded presence points and biologically relevant spatial variables. First, to obtain the highest contributing variables in explaining the distributions of Ae. aegypti or Ae. albopictus, sets of variables which included at least one temperature, moisture availability and anthropogenic variable were proposed for both BRTs and MaxEnt runs and repeated 10 times. The overall highest contributing variables were used in 250 BRTs and MaxEnt fits for each species to spatially map their suitability.
Data collection
A comprehensive database of 19 930 and 22 137 geopositioned occurrences of Ae. aegypti and Ae. albopictus, collected by Kraemer et al,53 was used as presence-only records.53 Data from this compendium were sourced globally within the period of 1960–2014 from published literature and unpublished occurrence data from national entomological surveys (see Kraemer et al 53 for a description of presence point collection methods and quality control). All covariate data available for this time period were collected and split into subcategories of temperature, moisture availability and anthropogenic variables. Based on data sources from previous studies, WorldClim7 49 50 and ERA-Interim (ERA) data6 were used as environmental covariates.
WorldClim is a compilation of global terrestrial climate surfaces, using monthly weather station data over the time period from 1950 to 2000 at an interpolated 0.0083° (~1 km) resolution and the ANUSPLIN software.54 The variables consist of monthly total precipitation, minimum and maximum temperature, and 19 derived bioclimatic variables which include seasonal ranges of temperatures and precipitation. The annual median temperature, maximum rainfall, median rainfall and minimum rainfall were calculated. ERA is a global reanalysis climatic data set from 1979 to date published by the European Centre for Medium-Range Weather Forecasts. It contains 60 vertical layers in a fully coupled land–atmosphere–ocean system and is obtained at a resolution of 0.125° (approximately 14 km) at six hourly intervals. Air temperature at 2 m, soil temperature and moisture (level 1: 0–5 cm), and total rainfall were used. To extract the minimum and maximum temperatures, the 5th and 95th percentiles along the temporal dimension of the climatic data sets were used in favour of Fourier transform methods and Savitzky-Golay filters, as the removal of unusual weather dynamics was preferred over denoising. Absolute humidity was calculated from vapour pressure using the ERA dewpoint and air temperature with Tetens conversion. To represent wet days from the ERA data set, the average number of light, medium and heavy rain days each year, classified as 1 mm, 5 mm and 10 mm per day by the World Meteorological Organization,55 was calculated and labelled as the minimum, median and maximum number of wet days.
For vegetation cover, the EVI derived from National Aeronautics and Space Administration’s Moderate Resolution Imaging Spectrometer56 and gap-filled by Weiss et al 57 was used. Altitude data were obtained from SRTM 90m Digital Elevation Database V.4.1.58 For the anthropogenic variables defining host availability, the 2010 United Nations-Adjusted Socioeconomic Data and Applications Center population density estimates59 and accessibility maps60 were used. Nightlight data were not used as they were assumed to be a proxy of these. Accessibility is represented by an urban agglomeration index map based on population density and travel time to the nearest population of 50 000 people. All data sets were resampled to 5 km resolution using bilinear interpolation (all the variables used are listed in online supplementary table 1, grouped as temperature, moisture and anthropogenic).
Supplemental material
Modelling
All subsequent analyses were carried out in R V.3.3.2.61 We employed two machine learning techniques: BRTs and MaxEnt. These are two powerful modelling techniques able to fit complex surfaces from presence data to represent species distributions. BRTs select relevant variables while overcoming inaccuracies from a single tree model and reducing prediction variance.62 MaxEnt has also been used extensively to explore multiple species distributions63 by maximising entropy with the occurrence points as constraints.64
Each BRT and MaxEnt fit was generated and evaluated using the gbm and dismo R packages.65 66 BRT model parametrisation was done following the methods of Elith et al 67 to determine the optimal model configuration in terms of learning rate, tree complexity and bag fractions. Cross-validation and forward stage search reduce bias provided a large number of trees were fitted, where a minimum threshold of 1000 was assumed here.67 For MaxEnt, the recommendations of Elith et al 63 were followed. All model performance was assessed by the True Skill Statistic (TSS), otherwise known as Youden’s Index, which is independent of prevalence, minimising the mean error rate for positive and negative observations, and maximising the sum of sensitivity and specificity. Binary presence and absence suitability thresholds were calculated using the optimal threshold that maximised the TSS of the models, which has consistently been found to produce accurate predictions.68
Suitable combinations of variables were assessed in algorithm 1 (online supplementary table 2). A correlation matrix was calculated between each variable and combinations of variables were proposed. Each combination had at least one variable from temperature, moisture and anthropogenic groupings (online supplementary table 1), with a correlation of less than 0.4 between all variables.
Pseudo-absence data were obtained across a 0.2°×0.2° grid by random sampling, which yields more reliable distribution models.68 Antarctica and areas above 56°N in latitude, which are highly unlikely to have populations of either vector, were excluded as they are uninformative.
To reduce sampling bias across continents, hierarchical clustering was used to create 100 point blocks for presence and 1000 point blocks for pseudo-absence, where four random blocks were independently drawn per model run from each of the three general longitudinal regions: Americas, Europe-Africa, Asia-Oceania. From these blocks, 1000 presence and 10 000 pseudo-absence points were then randomly selected, with subsequent pairing of test presence blocks with the test absence blocks closest to the training presence blocks to further reduce spatial bias. Fivefold cross-validation was used within each BRT and MaxEnt, and further BRT hyperparameter optimisation and model simplification were carried out in algorithm 2 (online supplementary table 2). The first modelling exercise ran 871 variable combinations using MaxEnt and BRTs 10 times to ascertain the highest contributing variables in algorithms 3 and 4 (online supplementary table 2). The second exercise ran BRTs of the top-performing variables a further 250 times to establish CIs and drew prediction maps of suitability over areas with missing data based on the variable raster maps.
Results
We present the maps of the median Ae. aegypti and Ae. albopictus suitability based on the three highest contributing variables in the final ensemble model (figure 1) using BRTs. BRTs generally performed well (TSS for BRTs—Ae. aegypti: median 0.84 (IQR 0.76–0.86); Ae. albopictus: median 0.71 (IQR 0.66–0.78)) and outperformed MaxEnt (TSS for MaxEnt—Ae. aegypti: median 0.78 (IQR 0.75–0.82); Ae. albopictus: median 0.69 (IQR 0.63–0.75)). We therefore dropped MaxEnt results in the final ensemble model. The top 5 and bottom 5 variable contributors for both species are presented in figure 2, with the full list available in online supplementary figure 1.
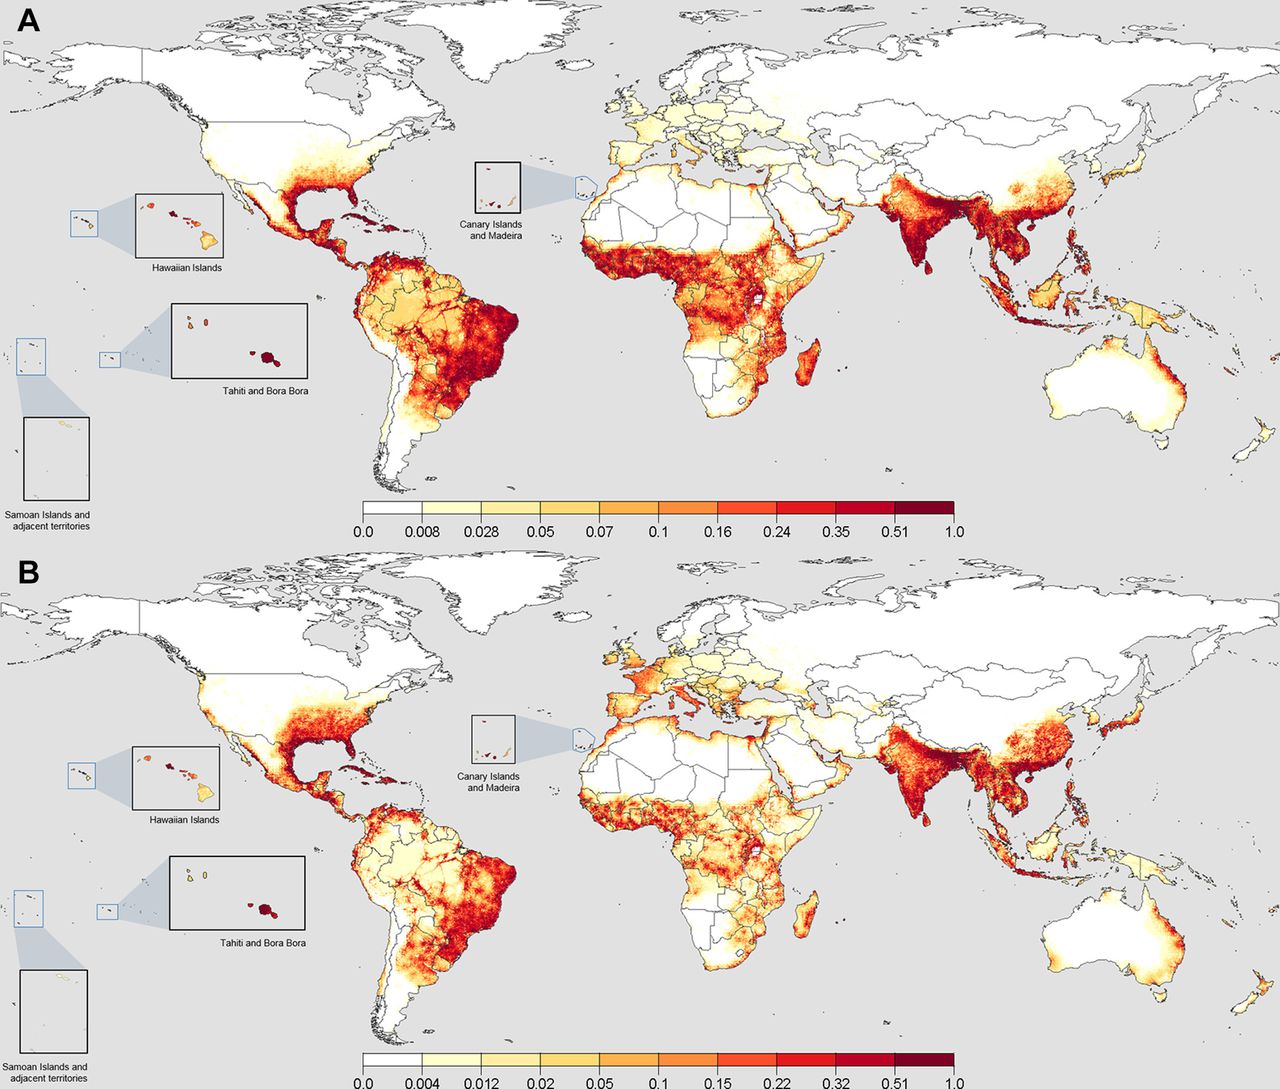
Suitability maps for Aedes aegypti and Ae. albopictus at the 50th percentile from 250 boosted regression trees. When converted to binary presence/absence, values greater than a median threshold of 0.24 for Ae. aegypti and 0.22 for Ae. albopictus indicated the presence across all fits. Panel (A) shows the results for Ae. aegypti, where the Indian subcontinent, South-East Asia, Eastern South America, Mid-Africa, Caribbean and Southern North America have the highest projected suitability. Notably, East Australia, Madagascar and the coastal regions of the Middle East show areas of high suitability. Europe, the heavily forested areas of the Amazon and latitudinal fringes of the distributions show sharp waning to areas of no suitability. Panel (B) shows the results for Ae. albopictus, where considerable similarities exist across the greatest areas of suitability for Ae. aegypti. Greater northward suitability exists in North America, Europe, China and the southern coast of Korea and Japan.
Performance of covariates
The top three selected variables which consistently explained the majority of the presence point distribution in the variable selection process were accessibility (time required to travel to an area of 50 000 population), median absolute humidity and minimum annual temperature (figure 2), which were subsequently used in the final ensemble model of BRTs for both species. Suitability substantially declines when one of these variables is unsuitable for mosquito population growth, highlighting the necessity of all three for large-scale mosquito establishment (online supplementary figure 2). Accessibility has a high relative influence for both species’ BRTs (figure 3A), highlighting the influence of increased transportation, globalisation and urban spread, with no lower threshold. The partial dependency plots (online supplementary figure 3A,B) demonstrate that a higher probability of presence exists for Ae. aegypti in areas with good accessibility at 620 mins away (or lower) from the nearest city of 50 000 people comparison to Ae. albopictus at 880. Values greater than these thresholds, representing areas farther away from urban centres, are inhibitory to mosquito population growth, although Ae. albopictus is able to exist in areas which are less urban.
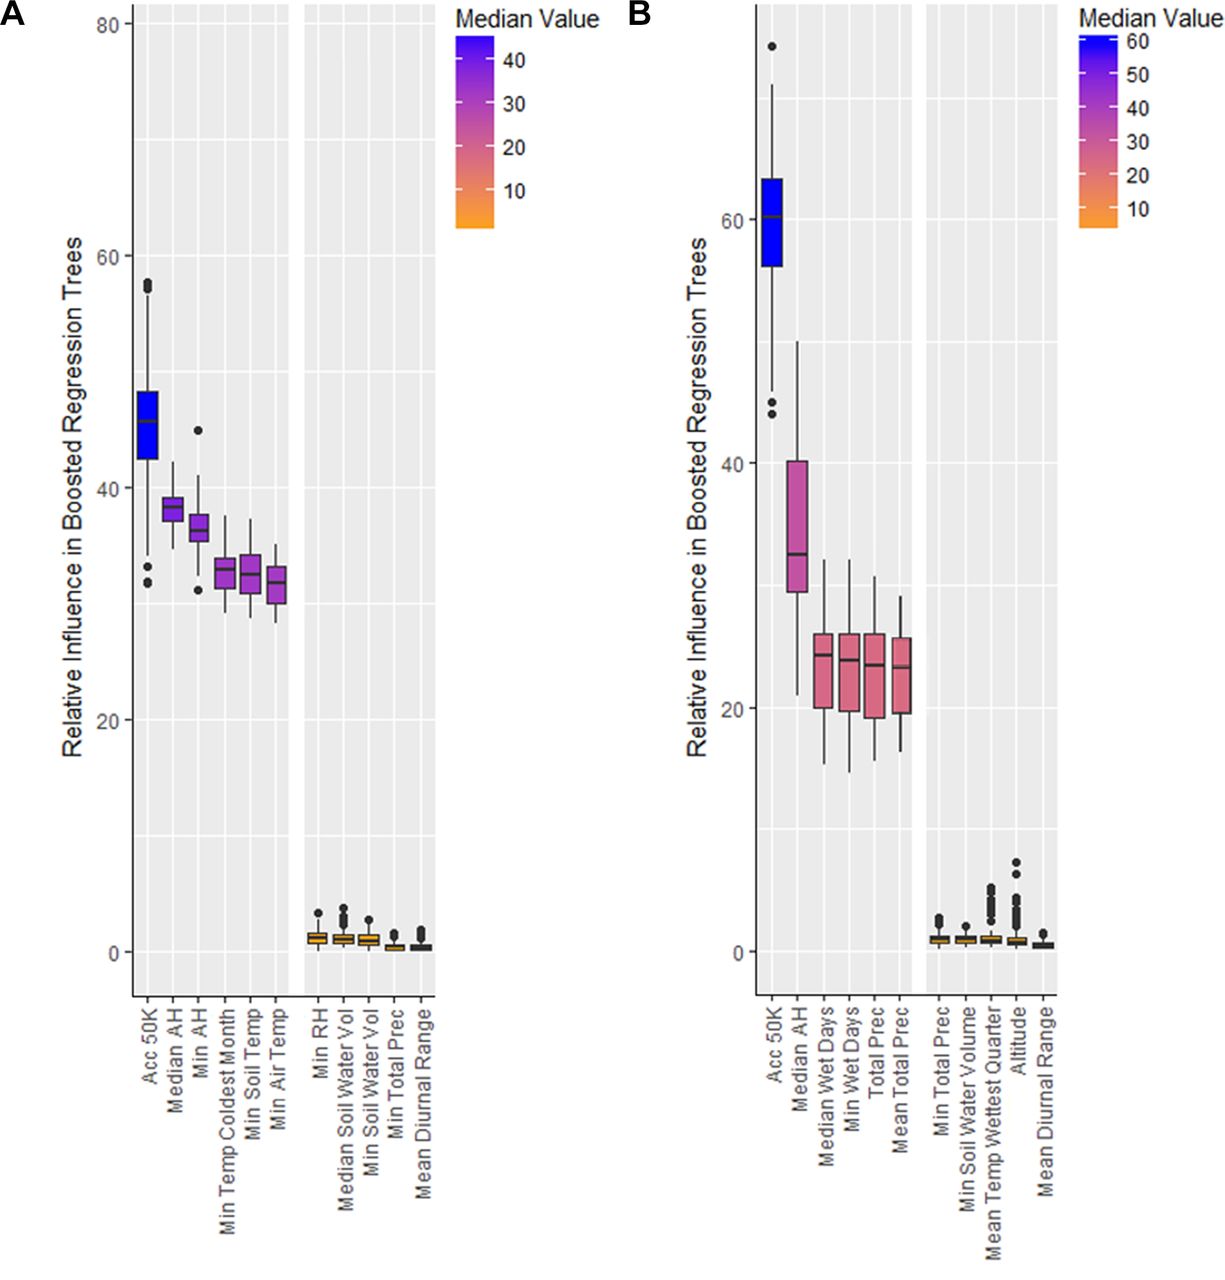
Top-performing and bottom-performing variables in relative influence in boosted regression trees for the prediction of both Aedes aegypti and Ae. albopictus presence. Panel (A) shows the top-performing variables for Ae. aegypti are Socioeconomic Data and Applications Center (SEDAC) accessibility, ERA annual median and minimum absolute humidity, WorldClim (WC) minimum temperature of the coldest month, and ERA annual minimum soil and air temperature. The bottom performers were ERA annual minimum relative humidity, ERA annual median and minimum soil water volume, ERA annual minimum total precipitation, and WC mean diurnal temperatures range. Panel (B) shows a similar trend for Ae. albopictus, where SEDAC accessibility and ERA annual median absolute humidity are the best performers, with ERA annual median and minimum wet days, and WC annual total and mean monthly precipitation also performing well. Annual minimum temperatures still perform as the best temperature constraint for Ae. albopictus, as displayed in the full version of this figure in online supplementary figure 1. The worst performers for Ae. albopictus were ERA annual minimum total precipitation and soil water volume, WC mean temperature of the wettest quarter, altitude, and WC mean diurnal temperature range. AH, absolute humidity; RH relative humidity.

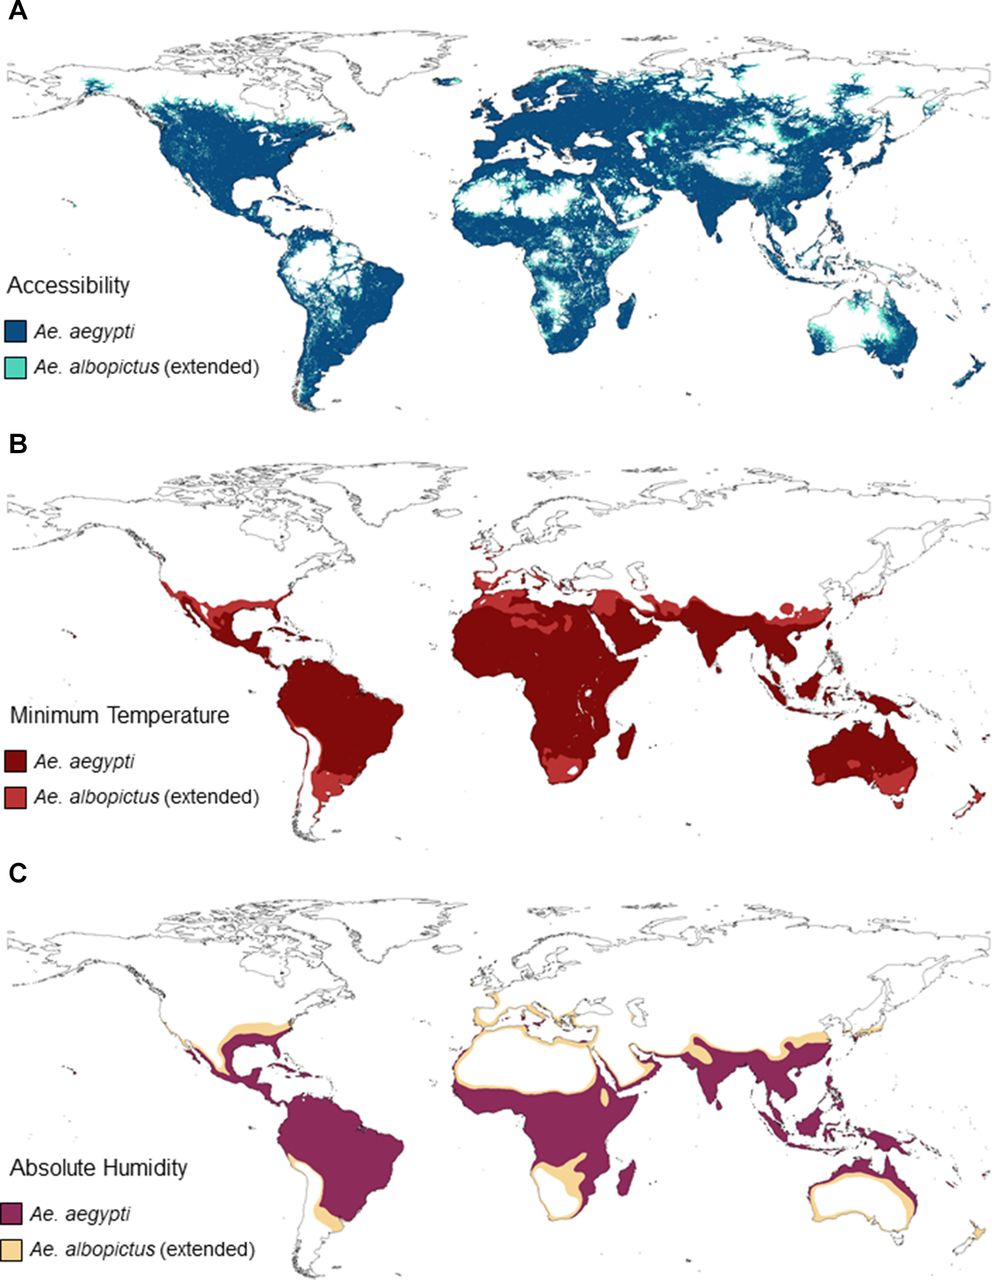
Effects of the three covariates identified in the final models for Aedes aegypti and Ae. albopictus. We used the threshold for the highest sum of sensitivity and specificity as a cut-off for the marginal effect on logit(p) and generated maps indicating areas where, according to that variable, the vector is predicted to be present. Panel (A) shows the effects of accessibility where very inaccessible areas hinder establishment for both species. Ae. albopictus is however able to establish in less accessible areas in comparison with Ae. aegypti, being less anthropophilic. Panel (B) shows the effects of temperature on Ae. aegypti and Ae. albopictus. Ae. albopictus is able to occupy almost the entire range of Ae. aegypti and shows extension beyond these regions into cooler areas. Panel (C) shows that absolute humidity affects Ae. aegypti and Ae. albopictus similarly.
For Ae. aegypti, various representations of minimum temperature from both ERA and WorldClim performed equally well (figure 2A, online supplementary figure 1A,B), supporting the findings of temperature being a constraint for the latitudinal expansion of Ae. aegypti’s distribution. Ae. albopictus shows a greater area of potential establishment in comparison with Ae. aegypti when limited by annual minimum temperatures (figure 3B). Ae. aegypti requires warmer climatic regimens, with increasing probability of presence where minimum temperatures are above 8°C, which differs from Ae. albopictus which prefers a distinct cooler range of at least 2°C (online supplementary figure 3C,D). Both species however are similar in their restrictions at high minimum temperature climatic regimens above 24°C, which is indicative of their unimodal responses to temperature.
Median absolute humidity, a measurement of water vapour in the air regardless of temperature, performed well as a proxy for moisture availability for both species where relatively humid climates are preferred. Ae. albopictus, preferring natural rainfed habitats, was additionally influenced by precipitation indices, including wet days and total monthly precipitation covariates, whereas Ae. aegypti shows less sensitivity, being more able to exploit human-filled water containers (online supplementary figure 1C,D). Both species showed a similar response, with the increased probability of presence with values above 10 g/m3 (figure 3C, online supplementary figure 3E,F). Neither species showed an upper threshold demonstrating its preference for humid conditions within areas of suitable temperature and accessibility.
Variables which did not contribute notably for either species across methods included mean and maximum temperatures, spatially explicit GDP, EVI, altitude, diurnal temperature range, wind speed, relative humidity and soil water volume.
Predicted suitability range maps
After bootstrapping, the spatial predictions were well constrained to a similar distribution, differing in intensity of suitability at the peripheral latitudes and in areas of lower suitability, which reflects areas of uncertainty for mosquito establishment or low potential suitability overall (online supplementary figure 4).
In the Americas, high suitability for Ae. aegypti was observed in Brazil, where the highest density of presence data exist (figure 1A). We found that the suitability extends into northern Argentina and the Amazon rainforest via major travel routes. Suitability is not homogeneous within the rainforest or areas with high altitude due to poor accessibility. In the USA, suitability is very low beyond the utmost south-eastern states, possibly due to lower humidity values and colder winter temperatures. Ae. albopictus showed similar suitability ranges with an extended northerly and coastal westerly distribution in the USA, owing to its greater tolerance to low temperatures (figure 1B). The projected distributions in the Central Americas show that the conditions are more suitable for Ae. aegypti but equally suitable for both species in the Caribbean islands.
The coastal regions of Portugal, Spain, southern France and Italy showed a favourable environment for Ae. aegypti (figure 1A). With ongoing recorded dengue outbreaks, Sudan, Oman, Egypt, Saudi Arabia, Iran and Yemen also showed suitability, particularly at the Nile Delta and coastal regions. The species continues to have good suitability in mid-Africa and down the eastern coast towards Madagascar. Higher temperatures and humidity values (figure 3B,C) also exist in these locations in comparison with the south-western coast. Ae. albopictus had lower values of suitability outside of highly accessible areas across Africa and the Middle East (figure 1B).
The presence of Ae. albopictus in Europe is notably different from Ae. aegypti, being spread across a wider latitude range and differing ecozones. We identified Italy and surrounding islands, western France, the coastal areas of Portugal and Spain, and the Mediterranean coastline as suitable areas for Ae. albopictus, which have recorded populations according to the European Centre for Disease Prevention and Control.69 70
The Indian subcontinent and mainland South-East Asia were highly suitable for both Ae. aegypti and Ae. albopictus (figure 1A,B). The inland areas of South-East Asia showed particularly high suitability with high accessibility and climatically suitable regimens for year-round populations. Papua New Guinea and Kalimantan showed lower suitability inland, possibly due to inaccessibility. More northerly areas of China, the southern Korean peninsula and southern Japan were also suitable for Ae. albopictus.
Discussion
At a global scale, minimum annual temperature, median absolute humidity and accessibility were selected as the covariates which explained the majority of the presence points for both Ae. aegypti and Ae. albopictus. Representative of thermal stress, moisture and host availability, the covariates combined restricts the distribution of both species when values are unsuitable for the vectors’ survival or reproduction.
Multiple studies have identified minimum temperature6 51 or the mean temperature in the coldest yearly quarter,48 71 72 month50 or January7 as critical factors in determining presence. The minimum estimated temperature thresholds for Ae. aegypti range from 4°C to 10°C73–75 and for Ae. albopictus from −5°C to 1°C,12 72 76 which is in agreement with our 8°C and 2°C estimates. We identified Ae. albopictus suitability across the Mediterranean coastline, western France and the southern UK coastline, which is more in agreement with Caminade et al,51 where the temperature criteria were not limiting. We show almost no suitability for Scotland and Denmark, unlike previous studies,9 51 where the cut-offs chosen designate them as potential sites for mosquito presence. Our maps did not match the predicted European distribution of Kraemer et al,44 which shows very limited suitability beyond northern Italy, showing instead more spatial similarity with their temperature suitability variable map.5 We did however observe similarities with their North American outputs. Our maps also show strong differences for Ae. albopictus across India and South-East Asia, with strong suitability and higher suitability southwards in Japan due to higher minimum temperatures. Ae. albopictus eggs generally show remarkable tolerance with recorded captures as north as 40°N in Honshu Island, Japan, provided the mean temperature is above −2°C in January.27
Inversely, Ae. aegypti’s tolerance to higher temperatures in comparison with Ae. albopictus is reflected by its higher suitability across Africa and the Middle East, which is also supported by Ducheyne et al,52 although they identified maximum temperature as an important variable. In contrast, the current analysis finds that maximum temperature variables have relatively poor performance, supported by ground observations at sites with consistently high temperatures in North Africa, the Middle East and Indian subcontinent, especially at port cities where heavy commerce contributes to importation.77 ,6 51 48 71 72 ,50 ,7 Other studies have also observed lower prediction power when using the warmest yearly quarter temperature data in comparison with coldness indicators.7 48 71 Similarly, annual mean temperature was a poorer predictor for both species, in agreement with previous studies.7 52 78 Equally, relationships inferred with altitude49 50 52 78 are likely to be a function of temperature.
Their behavioural avoidance of unsuitable temperatures and transitional adaptability are further reflected by the poor performance of the diurnal temperature range or temperature seasonality, previously used,50 52 78 and soil or surface water temperature. Both species are able to exploit habitats unaffected by ground thermal dynamics, exhibiting container breeding behaviour where temperatures are less erratic.79 Although the role of behavioural thermoregulation is unclear at large spatial scales, their exploitation of sheltered microhabitats at temperatures where most humans inhabit is evident at the global scale. The use of population density in this study to explain their anthropogenic nature is thus problematic. Population density has previously been used as a predictor,44 50 52 but we observed high uncertainty in its predictive performance, which was dependent on the other variables selected and subsets of presence points, indicating overall that both species can exist in areas of high and low population density.
As a composite indicator of population density and transportation networks, accessibility was a very strong performer with high influence and increased suitability along networks and inhabited nodes in our maps. Our findings support the ability of Ae. aegypti and Ae. albopictus to establish at a wide range of population densities as both can be found in urban and rural settings.73 Both provide exposure to hosts, artificial breeding habitats and settings where vector control is very challenging. This may partially explain why the spatially explicit gross domestic product generally performed poorly. Populations of either vector exist in both affluent areas such as Hong Kong and Southeastern USA80 and areas with higher levels of poverty.81 We hypothesise that urban expansion, which facilitates larger less-disconnected mosquito populations, is the strongest anthropogenic driver.82
Uncertainty was also observed in the use of precipitation variables, which is reflected both in our study and the wide range previously used such as the mean values in the warmest7 48 or driest48 50 or coldest78 portion of a year. Annual precipitation has been shown to be a relatively weak predictor by previous regional and global studies,7 71 which our study supported, reflecting the complex temporal effects of precipitation at large spatial scales. We however found that the number of wet days was a good predictor for Ae. albopictus, in agreement with previous findings,4 12 but not for Ae. aegypti. EVI was a moderate predictor for both species overall, being potentially confounded by absolute humidity, which is generally higher where transpiration processes occur. Previously used in mapping efforts as vegetation provides wetness, shelter and nectar feeding opportunities,44 the global effects of EVI are difficult to extract where small-scale vegetated areas appear sufficient for mosquito population growth.83 The effects of land use50 may also be complicated as either vector may be able to exploit microhabitats within a range of land types such as urban, periurban, rural low-density housing and agricultural areas.
We found that the highest contributing covariate for moisture availability was absolute humidity, a function of dewpoint temperature and vapour pressure. Proximity to the coast or large water bodies can raise absolute humidity, causing coastal areas to appear more suitable alongside greater populations of people due to accessibility. Absolute humidity values are sufficiently high for both species across India, which is contrary to maps of Kraemer et al,44 which used precipitation as its indicator of moisture, and Khormi and Kumar,6 which used relative humidity. Absolute humidity values also support populations across South-East China and Asia but is limited to North Australia and New Zealand, providing potential insight into limiting factors that prevent further spread.
Relative humidity is widely used as a covariate to model mosquito mortality,6 9 but Ae. albopictus populations have been observed with summer humidity values as low as 35% in Europe.12 84 Relative humidity does not appear to be limiting where, for example, the low values across West India are not inhibitive with populations recorded widely. Where relative humidity levels are low, absolute humidity can remain high.85 Dengue incidence or vector density has been correlated to absolute humidity20 41 and vapour pressure,2 43 86 but little work has been done to examine the role of absolute humidity on mosquito mortality.
Concerns of the vectors’ ongoing spread with high apparent physiological adaptability and multiple disease vector competence make Ae. albopictus a serious future public health threat and Ae. aegypti a continuing issue. Continued ongoing introduction via trading is likely to enhance the spread of both vectors, as observed with Ae. albopictus and tyre imports into the USA and Europe,4 making the mapping of distributions an ongoing challenge. Our findings support those of Hales et al,43 where they discuss the importance of vapour pressure, which is very strongly correlated to absolute humidity, as a strong determinant of dengue. With greenhouse gas-induced warming hypothesised to cause ongoing increases in absolute humidity and temperature87 and urbanisation continuing to spread, the distribution of both of these vectors is likely to increase. Ascertaining the strongest global drivers for their distribution is vital to gain insight into future areas of risk for disease transmission and should be a priority for future research.
Several limitations exist in our estimates. The lack of a temporal dimension in this modelling approach and covariates emphasises the importance of global variables that demonstrate the strongest forcing effects on vector populations across space and time. The effects of other variables that may enhance seasonal or annual population survival are difficult to ascertain in their strength and applicability across different local areas under those exhibiting the greatest effects. Owing to the long time scale of vector collection, which is considered to be cumulative and not representative of the year of collection, the percentiles of all available climatic data within the vector data collection period were used where possible to represent the spatial drivers independent of time. Errors in the raw covariate values are an additional source of extrinsic error, which is difficult to estimate. Annual fluctuations in temperature and extreme events could allow either vector to establish temporarily in areas when data were collected, causing thresholds to shift. The vector may additionally also show adaptations to climatic changes and host preferences over this period of vector collection.
The use of pseudo-absence sampling can also negatively impact distribution models68 and introduce error in the predictions. Ascertaining true absence points is challenging despite the extensive global sampling undertaken as both species are occasionally passively transported, can reproduce and establish rapidly, and coexist with many other mosquito species.88 Detection probability and sample selection bias, and the anthropophilic nature of both species, are further difficult to separate when considering accessibility. The use of presence points is also problematic in these methods where no temporal dimension exists, and historical data collected are assumed to still indicate presence today. Similarly, the success of mosquito control programmes is both highly temporal and difficult to assess with differing environmental regulations and government expenditure.
Omission of key variables can create spurious correlations and model fittings, which is problematic among large-scale studies. We propose that species distribution mapping be a twofold process, where the fitting informs which collated variables from local statistical studies of climatic drivers of mosquito populations and laboratorial knowledge of their behaviour are the top performers at the study scale, which can be used with bootstrapping of the presence and pseudo-absence data to ascertain the optimised distributions and uncertainty. The removal of variables which have a non-global effect or are observed locally for select locations, or are possible collinear variables showing clear secondary effects from the strongest drivers, can provide insight into critical variables for use in current population studies and future distribution mapping with climate change.
Different time scales, spatial scales, numbers of weather stations used or sources for climatic data, size and sampling of mosquito or disease by proxy sampling data sets, and study outcome can all impact the relevance of a variable in a study. The wide range of variables used, even in regional studies,10 is evidence of the uncertainty surrounding the environmental and anthropogenic drivers of mosquito populations, where this study highlights that at the global scale minimum temperature, absolute humidity and accessibility are critical to establishment success. Local studies with strong gradients in vector population presence can use these variables as a starting point for exploration, although other key drivers may be present, such as different water storage practices, local climate phenomena and the interactions between them. For example, the provision of habitats by artificial containers in Singapore is likely to be a strong driver where factors such as rainfall may contribute. Further mechanistic studies should be carried out which may disentangle environmental and anthropogenic drivers at smaller spatial scales, especially with changing environmental regimens. There is a general need to integrate the findings of mechanistic and statistical studies to better understand the non-linear responses of environmental drivers across space and time.
Both the difficulties in locating cryptic microwater habitats and their high biting rates at a range of host densities make these vectors challenging to control. By understanding their distributions, new technologies such as Wolbachia,89 designed to reduce vector reproduction capacity, can continue to be effectively trialled by identifying more ideal candidate sites. Furthermore, traditional control methods can be evaluated by comparing case data in neighbouring areas of similar estimated vector suitability. Where importations of either vector is being observed, the question of whether establishment is possible is imperative to assess, especially where autochthonous cases of the diseases they transmit occur. A key step forward is to use this study’s findings to examine the effects of climate change and the key variables identified here on these vector populations as the diseases they transmit have been identified as a global health and security risk priority.90 Overall, provided minimum temperatures and absolute humidity values are sufficiently high with access to human hosts, either vector will continue to be able to establish across a large global domain. The vectors’ anthropophilic behaviour, thermal tolerance and desiccation resistance at a global scale are remarkable, as shown in the maps presented.
References
- 1.↵
- 2.↵
- 3.↵
- 4.↵
- 5.↵
- 6.↵
- 7.↵
- 8.↵
- 9.↵
- 10.↵
- 11.↵
- 12.↵
- 13.↵
- 14.↵
- 15.↵
- 16.↵
- 17.↵
- 18.↵
- 19.↵
- 20.↵
- 21.↵
- 22.↵
- 23.↵
- 24.↵
- 25.↵
- 26.↵
- 27.↵
- 28.↵
- 29.↵
- 30.↵
- 31.↵
- 32.↵
- 33.↵
- 34.↵
- 35.↵
- 36.↵
- 37.↵
- 38.↵
- 39.↵
- 40.↵
- 41.↵
- 42.↵
- 43.↵
- 44.↵
- 45.↵
- 46.↵
- 47.↵
- 48.↵
- 49.↵
- 50.↵
- 51.↵
- 52.↵
- 53.↵
- 54.↵
- 55.↵
- 56.↵
- 57.↵
- 58.↵
- 59.↵
- 60.↵
- 61.↵
- 62.↵
- 63.↵
- 64.↵
- 65.↵
- 66.↵
- 67.↵
- 68.↵
- 69.↵
- 70.↵
- 71.↵
- 72.↵
- 73.↵
- 74.↵
- 75.↵
- 76.↵
- 77.↵
- 78.↵
- 79.↵
- 80.↵
- 81.↵
- 82.↵
- 83.↵
- 84.↵
- 85.↵
- 86.↵
- 87.↵
- 88.↵
- 89.↵
- 90.↵
Footnotes
Handling editor Alberto Garcia-Basteiro
Contributors BLD carried out the data processing, modelling work, and drafted and revised the paper. HS, MJ, ARC and LRC drafted and revised the paper.
Funding This study was funded by the Singapore Ministry of Health (Communicable Diseases Public Health Research Grant CDPHRG14NOV007).
Competing interests None declared.
Patient consent Not required.
Provenance and peer review Not commissioned; externally peer reviewed.
Data sharing statement No additional data is available.